
The RBA publishes the below graph its Chart Pack series and it is widely referenced in economic discussions about asset prices and credit. The low real cash seen during 2001 and 2002 is often assigned part of the blame for the exorbitant debt binge and house price growth around that time. It was, however, not a uniquely Australian phenomenon, but there are still lessons to take away from this period. One lesson arises from the unique way the RBA measures the real cash rate.
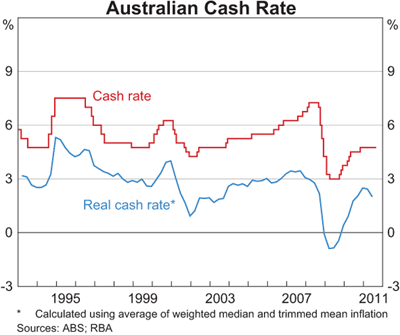
There are a few interesting points to note in the chart. First, the RBA uses the average of the weighted median and trimmed mean inflation measure, rather than the headline CPI. The RBA calculated these measure independently from 1986 to 2007. Since then the ABS has been undertaking the calculation and directly incorporating it into their CPI release.
The debate about the appropriateness of each of these inflation measures is an interesting one, but the only point I will reiterate today is that home mortgage costs were included in the CPI prior to 1998. They were replaced with a home construction cost index, meaning the net effect was to exclude residential land from the CPI in 1998.
The other interesting point is that the RBA inflation measure used in the above graph is actually 0.1percentage points higher on average than the headline CPI since 1986 (3.0% instead of the headline 2.9%). But there is quite a difference in the timing of price changes in the RBA measure and the headline measure. By trimming off the big price movers in the consumption basket on the up and downside, as the RBA does, you get a smoother result. But since prices changes don’t happen simultaneously, but flow through the economy in particular ways, this smoothing results in timing differences which may be important (more on RBA inflation measures here).
So I constructed a new real cash rate graph to demonstrate the difference between the RBA measure and the real cash rate observed by households across the whole basket of consumption goods using the headline CPI (still excluding land post-1998). The resulting graph is below.
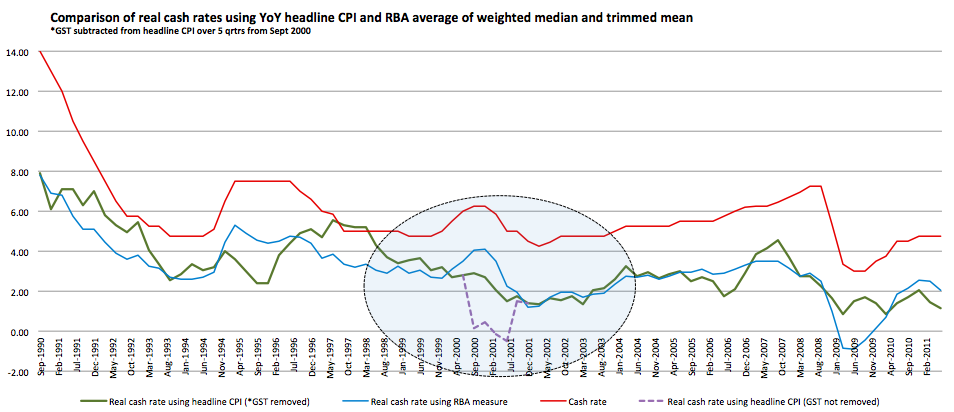
The period 2000 to 2003 is highlighted to show how the introduction of the GST saw significant adjustments in consumer prices, and if the headline CPI is used the real cash rate hovers near zero for a year, before springing back to around 1.5% during 2002 and 2003.
I have removed the GST effect on the CPI with reference to the numerous estimates of its effect in this paper. Surprisingly, all of estimates find that the GST increased CPI between 2 and 3% in total. This adjustment significantly smooths the real cash rate trend. Using the RBA measure you don’t get to see that even after excluding the GST effect the real cash rates plummeted from over 5% in 1997 to around 1.5% in early 2001, where it stayed for two years. This drop is similar in magnitude to the one observed between 1990 and 1993 as a reaction to the recession but starting from a lower interest rate base.
Additionally, if the CPI was calculated using the pre-1998 method, you would probably see real cash rates even a little lower during that early 2000s period.
Don’t get me wrong. I don’t believe that the broad house price boom during that period was solely a product of interest rates being too low for too long. But it is one factor, and it may very well have been a factor contributing to loosening lending standards around that time. At least we now have a new perspective on the real cash rate number to complement the official interpretation.
While this might be ancient history, the lessons that the measure of inflation matters to the real cash rate level, and that lower interest rates have unintended consequences, are important to remember at this time.
(Next week I’ll be publishing some re-engineered CPI paths for the pre 1998 CPI methodology. It’s worth waiting for).