
The S&P/ASX 200 closed in positive territory today, with strong bids before the close after a mixed session in the morning. The index is up 27 points or 0.6% to 4296 points. In after hours trading, the market is slightly above 4300 points.
Asian markets experienced similar gains, with the Nikkei 225 closing steady at 8955 points whilst the Hang Seng closed up 0.86% to 20378 points.
In other risk assets, the AUD is up slightly to 1.0664 against the USD, whilst WTI crude steadied at $88.83 USD per barrel. Gold rallied overnight on QE3 rumors but also had a steady Asian trading day at $1835 USD an ounce.
Movers and Shakers
It’s mixed across the board on the ASX, with only CSL dragging the index down, BHP-Billiton, Telstra and the banks providing the bids.
Overall the banks were up around 0.5 to 0.6%, although NAB was the laggard up 0.25%. Surprisingly, Suncorp (SUN) is now back up to almost pre-correction high, rallying almost 5% today.
BHP Billiton (BHP) put on 1%, as did RIO. Harvey Norman (HVN) experienced a (probable) short covering rally, up 3.5%, and as earnings season winds down, McMillan Shakespeare (MMS) had a very strong post-reporting day, up over 10%.
The Charts
As I mentioned previously, in the short term, there is strong resistance at 4300 points – the high reached during the rebound rally from the epic correction of early August. The market almost got over this level today (and is being bid up over as I write this in overnight futures). A repeat of this failure will shake out the rest of the bulls and let the bears add more shorts, likely sending the market back down to strong support at 4100 points.
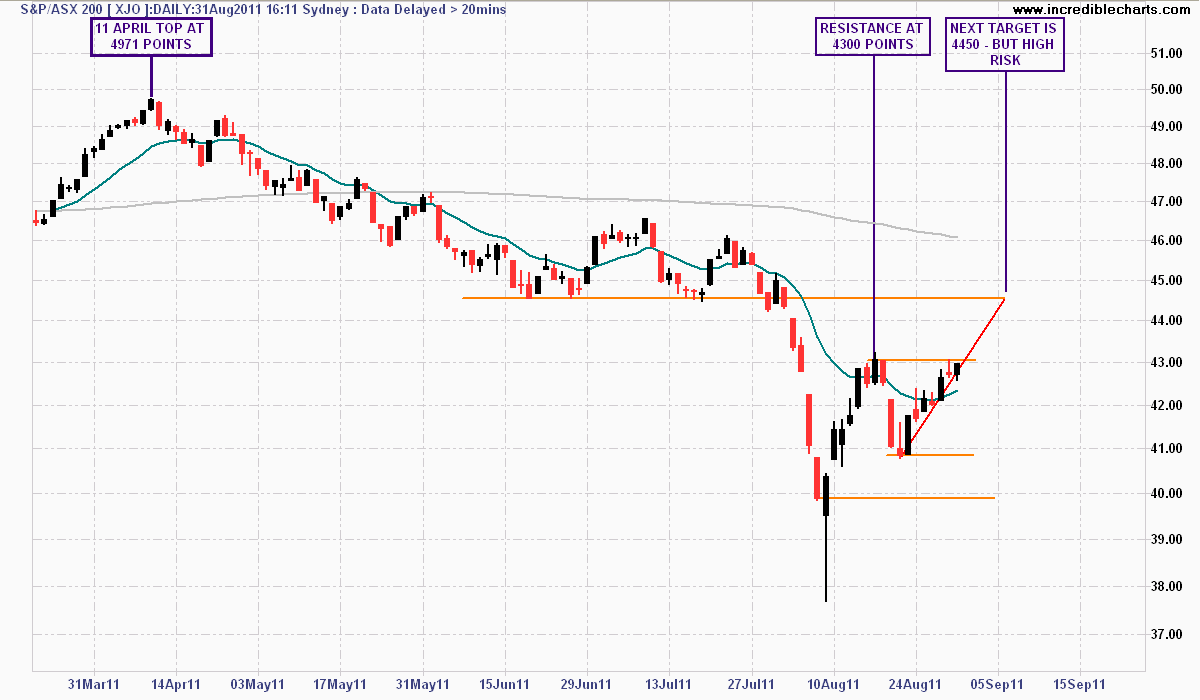
However, the sniff of QE may be too much for risk takers – all risk markets are rising together on the possibility of The Bernank easing.
The weekly chart – which should be about as “zoomed in” most investors should look at – still remains revealing – note the support at 4100 points, now tested for four weeks in a row, with target resistance of 4500 points. The Index is building on strong levels of support but a quick glance to the left shows a similar pattern during the post-Greece Crisis (Mk1) of May last year.
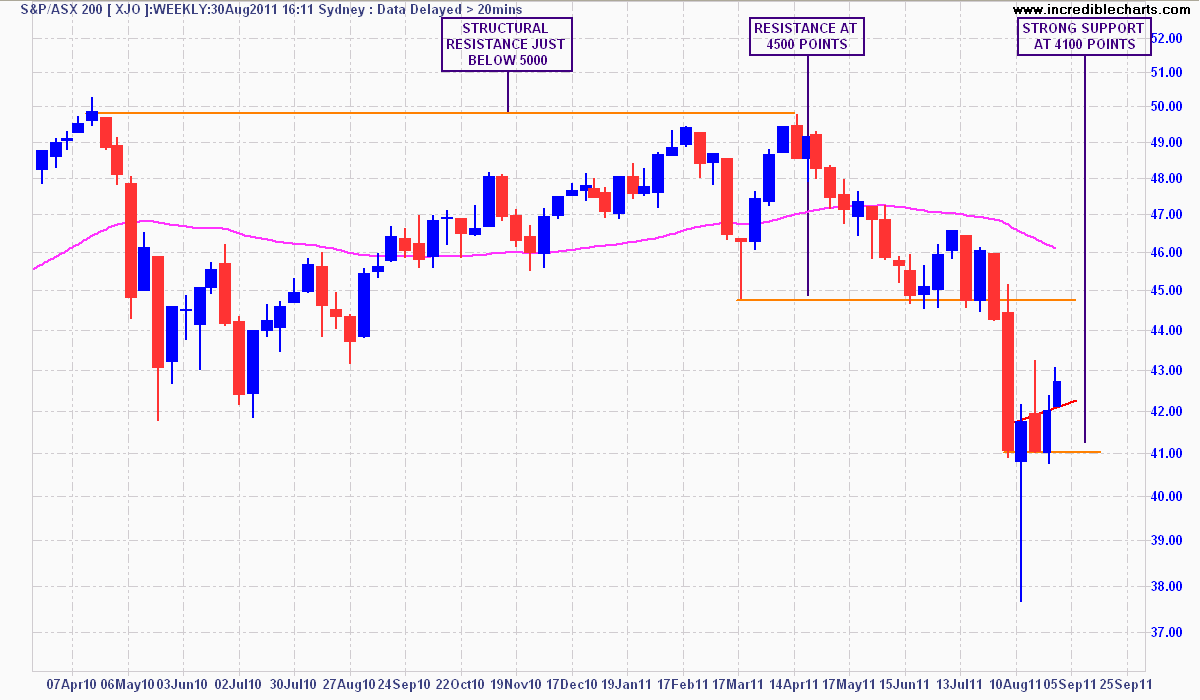
Weekly chart of ASX200 - click to enlarge
The 260 day weighted moving average (pink) line is trending down, and turning over sharper than last year’s sideways funk – its still a bear market, although a rally up to 4500 points (the intermediate resistance level of late June/early July) is conceivable and completely normal in the context of a bear market rally.