
The S&P/ASX 200 closed slightly down today after a strong rally in the morning, to finish 5 points down at 4167.
Asian markets experienced larger losses, with the Nikkei 225 closing down 1% at 8639 points, and the Hang Seng down 1.3% at 19619 points.
In other risk assets, the AUD bounced back against the USD and was over 1.05 but is now at $1.0485, whilst WTI crude cooled off and is steady at $85.34 USD per barrel. Gold clawed back some of its record one-day loss from last night and stands at $1844 USD an ounce.
Movers and Shakers
It’s mixed, but mainly green across the board, with the telco and consumer sectors up, but utilities down with a lot of volatility due to earnings reports. Seven West Media (SWM) gained almost 20% on short covering due to its profit result, whilst Billabong (BBG) and Pacific Brands (PBG) also having double digit rises in a single day.
All the banks closed the day down, with ANZ and CBA losing 0.6%, whilst NAB and WBC dropped almost 2%.
BHP Billiton (BHP) closed the day level after announcing a record corporate profit, whilst RIO dropped 1.7%
Daily Chart
Imagine a large shoe (like in Monty Python Flying Circus) pushing down on the market and this explains why it struggles to get above the 15 day moving average (green line) with the 260 day weighted moving average slowly, and ominously, tipping over.
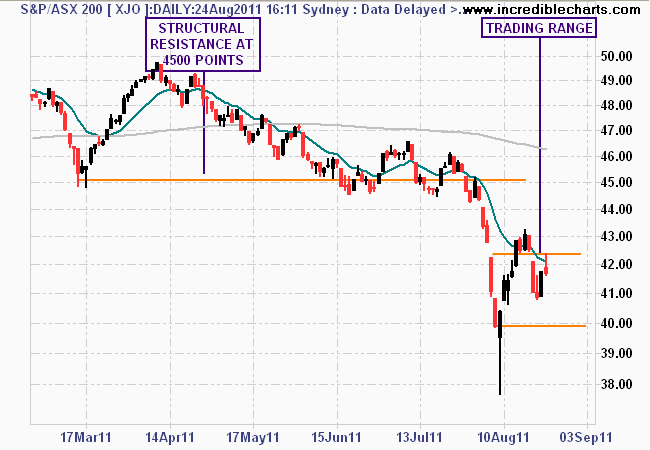
Daily chart of ASX200 - green line is 15 day moving average
In the short term, a trading range has been established between 4250 and 4000 points, as other equity markets are reacting to speculation of imminent QE3 and other stimulation across the developed world. The local bourse has now failed four days in a row to get above resistance at 4250 points, including today’s intraday rally (for the day traders out there, the head and shoulders pattern was epic and proved profitable for sellers)
As I said yesterday, a reactionary rally – to any type of news, good or bad – is not uncommon in bear markets, but the weight of two years of sideways action still lingers as we move to the weekly chart, and the probable medium term price action.
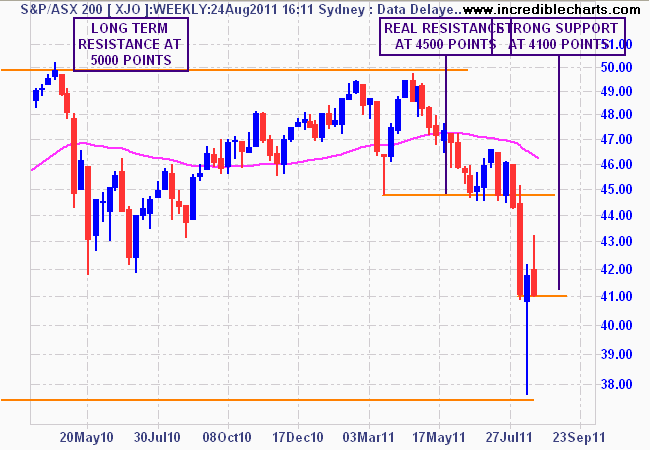
Weekly chart of ASX200 - pink line is 260 day weighted moving average
The support and resistance levels are clear: medium term structural resistance at 4500 points (the target for any sustained rebound rally), with strong support at 4100 points (tested three weeks in a row) and secular, long term resistance at 5000 points (the target to exceed to reverse this secular bear market).