
Summary
The S&P/ASX200 finished the week 83 points higher, up 1.84 per cent to close at 4,591 points on Friday. After one of the biggest one-day moves of the year, the market experienced a slight sell off on Friday to finish just below the 4600 points level.
Monthly Analysis
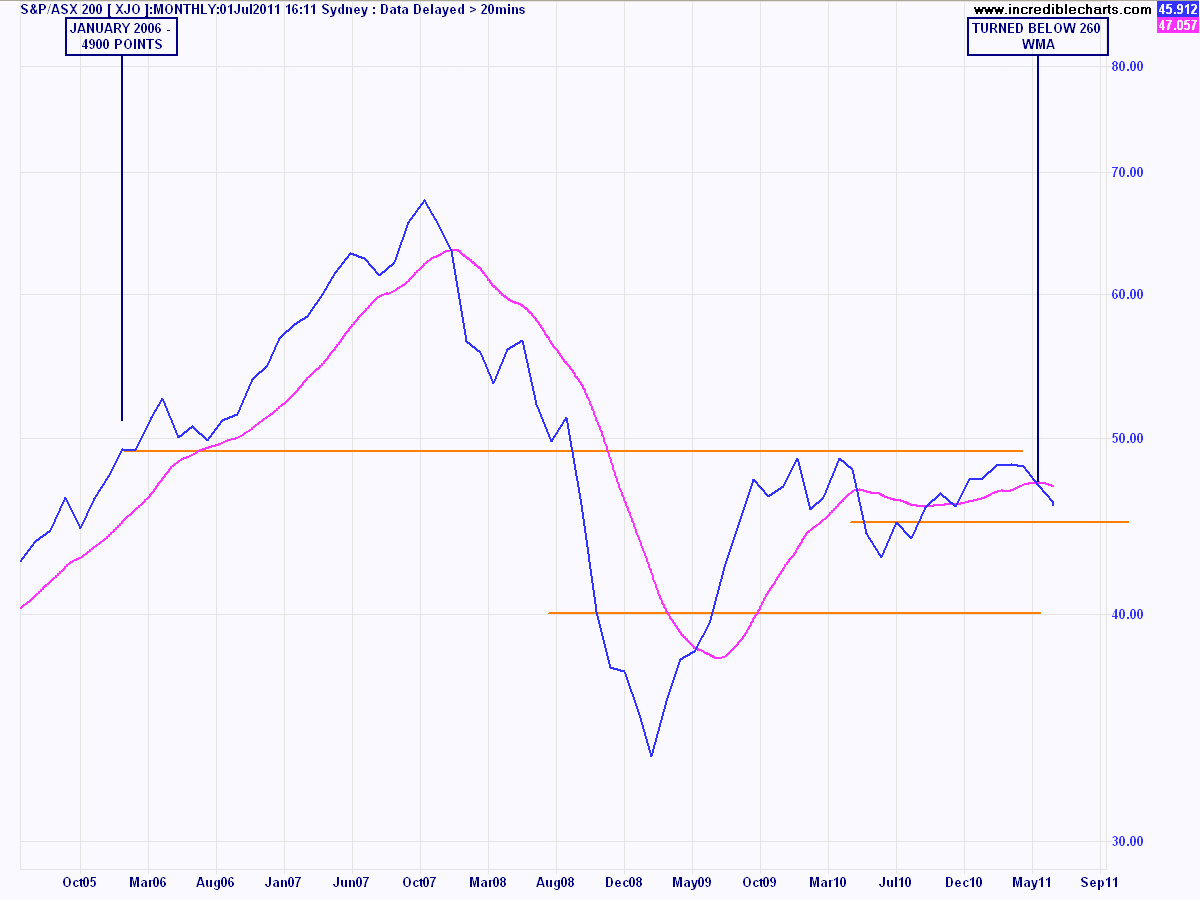
The market is almost replicating the 2001-2003 bear market, in terms of price development and pattern (double top). The 260 day moving average (my preferred indicator of general consensus) is slowly rolling over, with monthly price beneath. 12 month momentum has been reversing, signalling the end of the reflation rally since August last year and is about to turn negative.
Directional movement (an indicator of the ability of the market to trend in a direction, and the strength of that trend) is broadly negative. Intra-month volatility has been high, and the number of dips (up to 5%) and corrections (5% to 10% plus) higher than the average.
Long term support is at 4000 points, with long term resistance at 5000. The market has moved between these two ranges for 2 years now. These are clear signs of a sideways bearish market.
Monthly chart - click to enlarge
Weekly Chart
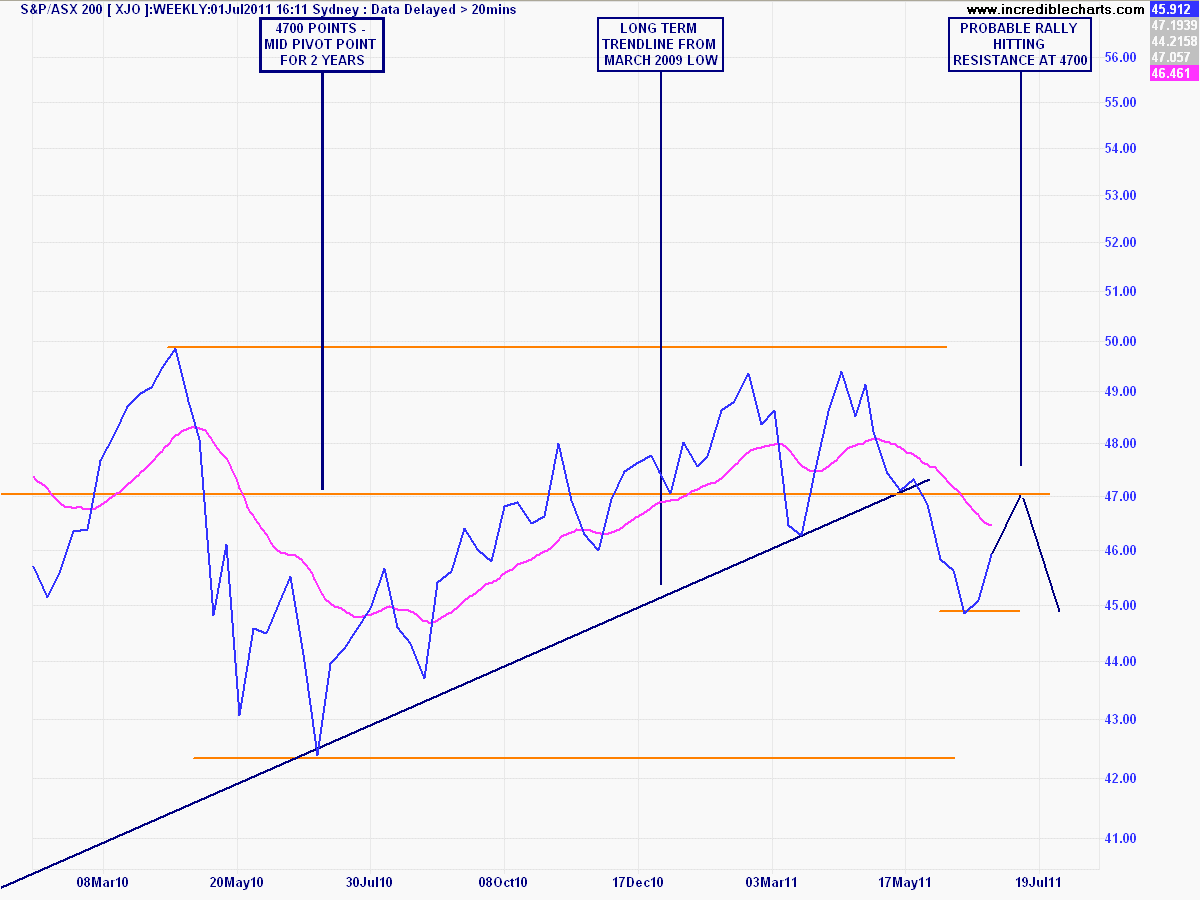
The weekly chart illustrates the volatility of the previous 18 months. The black trendline is from the post-March 2009 lows, which was tested by the Japan/MENA correction but finally broken in late May. Weekly price has found a temporary bottom or support at 4500 points for the last 3 weeks, with medium term resistance at 4700 points.
Secondary indicators suggest a possible new rebound rally (with potential path marked on map) but it is coming off weak momentum and may end up replicating the May-August period of 2010, before another round of QE2 was announced. A sustained rally would need to break the 63 day moving average (marked in pink) and weekly price to close over 4700 points, for a new target of 5000 points.
Weekly Chart - click to enlarge
Daily Chart
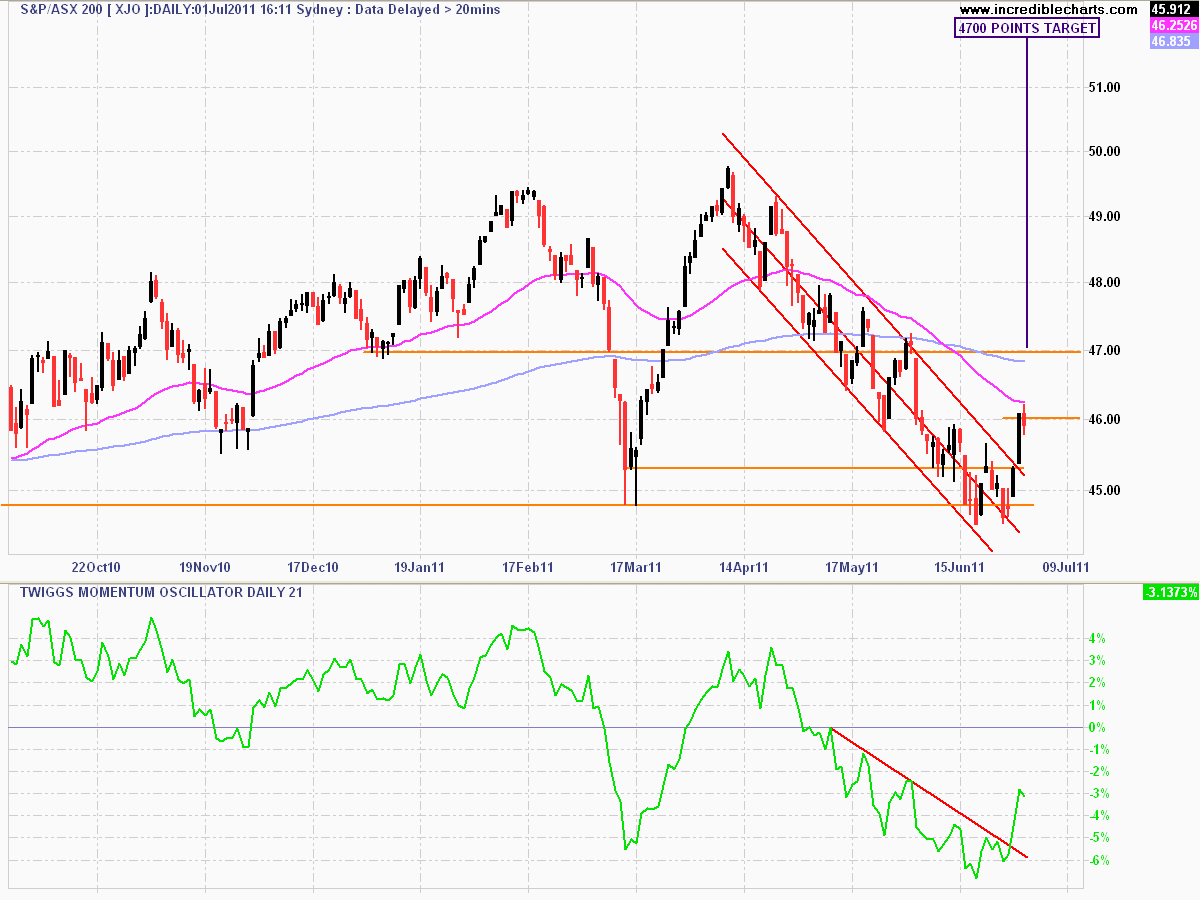
The daily chart clearly shows how the market has broken through the correction’s downtrend with the last two days action above this channel and the 15 day moving average (not shown for clarity).
There is temporary support at 4530 points, but significant resistance at 4600 points (the market has not closed above this line, save for yesterday’s End of Financial Year buying spree, for well over a month).
Secondary indicators are suggesting a short term rally, but directional movement is extremely weak, so the signal is far from clear.
Daily chart - click to enlarge
Conclusion
The S&P/ASX200 Index still has a significant weight upon it, reflecting the multi-speed economy (I would characterise as full speed (mining), first (housing) and reverse (retail)) and broader global factors, namely:
- lack of continued fiscal stimulus from US, EU and China
- slowing Japanese demand from manufacturing
- decelerating Chinese output and tightening of interest rates/liquidity
Whilst the resource sector will have upside in coming months and quarters, (although commodity prices are coming off the boil), continued bearish from foreign investors, particularly on our banks, and as a result of the high AUD is weighing on all other sectors, particularly retail.
The monthly and weekly charts support a continued bear market rally thesis, with increased volatility compared to an out and out bull market (or Ponzi market as it appears in the US at the moment). The daily chart is showing a potential rebound rally, with a target of 4700 points, but this is a low probability, and even if it eventuates, it is likely that macro factors will drag the market down.
Resistance at 5000 points and support at 4500 points create a probable channel where prices will gravitate for the time being and provide opportunities for hedging, particularly through option spreads.
Disclosure: The content of this post should not be taken as investment advice or construed as a recommendation to buy or sell any security or financial instrument, or to participate in any particular trading or investment strategy. The views expressed are the opinion of the author only. The author may have a position in any of the securities mentioned. Any action that you take as a result of information or analysis is ultimately your responsibility. Consult someone who claims to have a qualification before making any investment decisions.