
The S&P/ASX 200 slumped this morning on overnight falls from other equity markets, and has stabilised at 4485 points, falling 1.2%.
Other Asian markets are experiencing similar losses, with the Nikkei 225 down 1.05% at 9941 points, and the Hang Seng down 0.8% at 22354 points.
Other risk assets are steady, with the AUD consolidating at 1.1032 against the USD, whilst gold fell slightly from its record high, now at $1617 USD an ounce. WTI crude is down over half a percent at $96.87 USD per barrel.
Movers and Shakers
It’s red across the board, with all sectors down except telecommunications (Telstra and Telecom NZ are both up 0.3% and 0.4%). The banks have all suffered, with CBA down 0.6%, WBC down over 1%, but Macquarie – after releasing earnings guidance – sharply down 4.4%
The resource twins BHP and RIO are down 1.5% and 1.3% respectively, whilst my preferred offspring – Cochlear (COH) and CSL – are also down 1.1% each
The big winners amongst ASX200 stocks are Platinum Australia (PLA) up 5%, Commonwealth Property (CPA) up 4% and Emeco Holdings (EHL) up 1.7%.
The biggest losers include Aquila (AQA) down 5%, Minara Resources (MRE) down 3.5% and St Barbara Mines (SBM) down 3.4%
Daily and Weekly Charts and Stagflation
Here’s the crux folks – the ASX200 is at a crucial point, yet again. The daily chart shows that today’s fall brings the index down below the Japanese low of March and approaches the 4450 point (touched 3 times) in the previous correction. If the market closes below this critical point, the next target for support is 4200 points.
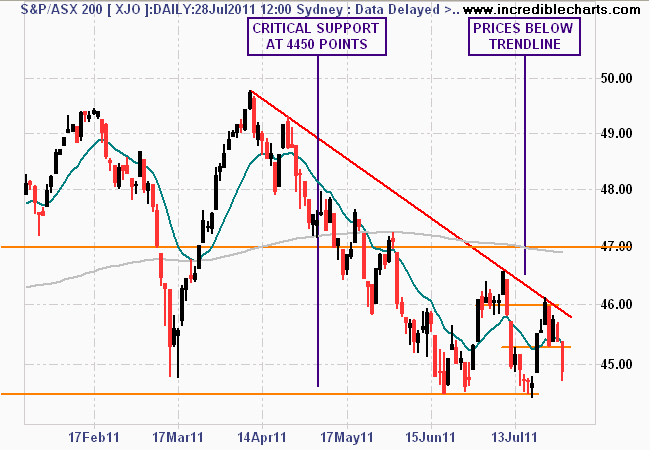
Daily candlestick chart of ASX200 - green line is 15 day moving average
The weekly chart shows that the market has now bounced along this crucial support level for six weeks in a row. The market has had to absorb carbon price news, no rate rise but then higher CPI figures, and now the US debt ceiling debacle. A lot to chew on.
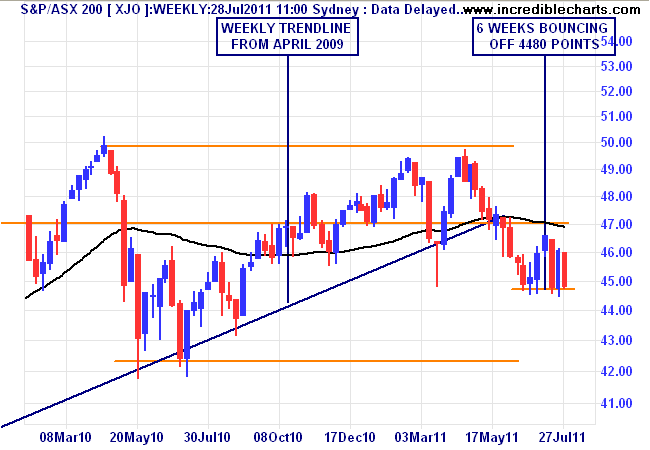
Weekly candlestick chart of ASX200 with 260 day moving average
Consensus from brokerage houses, economists, banks and other financial institutions points to the market rebounding from current levels to the emphermal 5000 point barrier before the end of the year, and continuining onwards and upwards as FutureBoom! and the comeback consumer make their mark.
Will this happen or are we still likely to continue our sideways funk into 2012, 2013 and maybe beyond? Let me remind you that markets move sideways (sic) as much as they go up or down – and sometimes they do so for a decade or more. The last large stagflationary period in Australian economic history was the 1970’s. And I mean the ENTIRE 1970’s.