
The S&P/ASX200 Aussie Index closed at 4583 points, down 100 points or 2.1% for the week, continuing its correction from the mid-April high of 4971 points, or a 7.8% loss. Closing SPI futures from overnight had the ASX200 trading at 4543, 40 points down from Friday’s close.
Overnight risk markets remain in a bearish phase, with the Dow Jones down 97 points, or 0.8%, the S&P500 down 12 points or nearly 1% and the NASDAQ down 40 points or over 1.5%
Europe is still swallowing the “PIIG” of Greece, preparing another rescue package, with late rallies pushing most bourses just into the black. The FTSE was up slightly, the DAX almost 0.5%.
Gold rallied strongly as the USD was sold off regaining its mid-week losses to close at $1542 USD an ounce. Oil remains just on $100 USD a barrel.
See the weekend links for details regarding other markets including commodities and Deus Forex Machina’s weekly analysis of the Aussie dollar.
Daily Chart
The daily chart shows the falling wedge/trend channel remains in place, with the next target just above 4500 points. Momentum is clearly negative and the ASX200 remains in a bearish position.
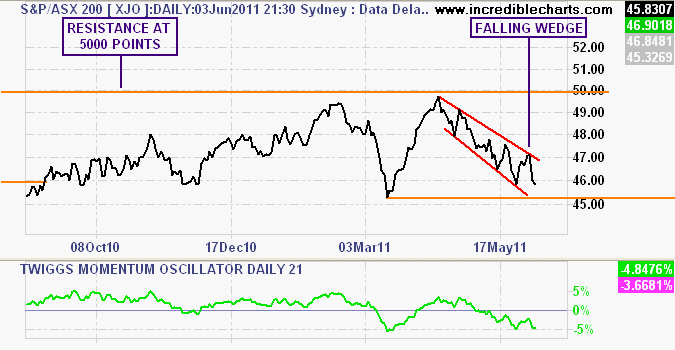
Daily chart of ASX200 with Twiggs Momentum Oscillator
Weekly Chart
The weekly chart shows this correction in the context of last 12 months of price action. The 4600 point level is the midpoint between the major support and resistance lines at 5000 and 4200 points. Note that medium momentum remains negative (lower half of chart).
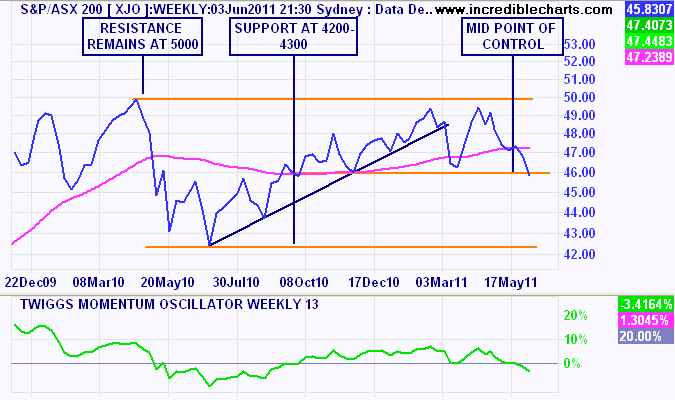
ASX200 weekly chart with medium term momentum
Monthly Chart
The monthly chart shows this sideway movement clearly with the overall market still within a 5 year trading range (closing on 6 years of sideways movement). The real bottom in the market is around 3900-4000 points, although it did overshoot this level in March 2009. 5000 points remains the key resistance level and only a break above will constitute a new bull market in stocks.
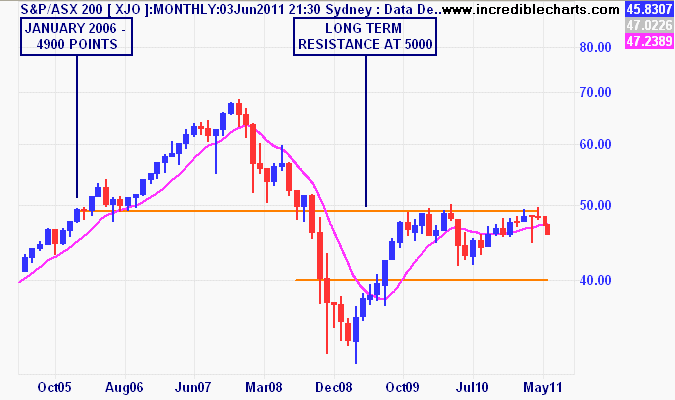
ASX200 Monthly chart since mid-2005