
The S&P/ASX 200 dropped on the open, and at midday is down over 53 points or 1.16% to 4520 points. The correction has now wiped off just over 9% of price in the ASX200, just below the conventional 10% level of a complete correction.
Asian markets are all down, with the Nikkei down over 0.4%, the Hang Seng dropping almost 1% and Singapore down 0.43%
Other risk assets are mixed, with the AUD dropping below 1.07, now 1.0658 against the USD, gold steady at $1542 USD an ounce. WTI crude remains below $100, at $98.95 USD per barrel.
Movers and Shakers
The banks are generally down, CBA 1.2% and NAB 1.2%, with ANZ down 1.1% and WBC steady. The major resource stocks continue to push the index down, with BHP again down 0.8% and RIO falling 0.3%
In other ASX200 stocks, Sigma Pharmaeutical (SIP) is up 7.4% whilst Metcash (MTS) is up 2%, uranium stocks Paladin (PDN) and ERA are down heavily (4% and 3% respectively) whilst Transpacific (TPI) is down over 7%
ASX200 below critical support level
The market remains in a downward, albeit decelerating trend pattern and is now at the Japanese earthquake lows just above 4500 points.
The hourly chart shows the lower channel support has been broken, whilst the daily chart shows the market now right on the Japan earthquake low. A break below this level would extend the correction, with the next target at 4200 points – the lows in the May flash crash of 2010.
The weekly chart (last of below) shows the key difference between the Japan earthquake/MENA riots low of March and now: the market closed the week above the 4600 support level (overshoot of this on a daily level is normal, its the weekly close that matters) in the former, whilst it is on track to close 2 successive weeks below currently.
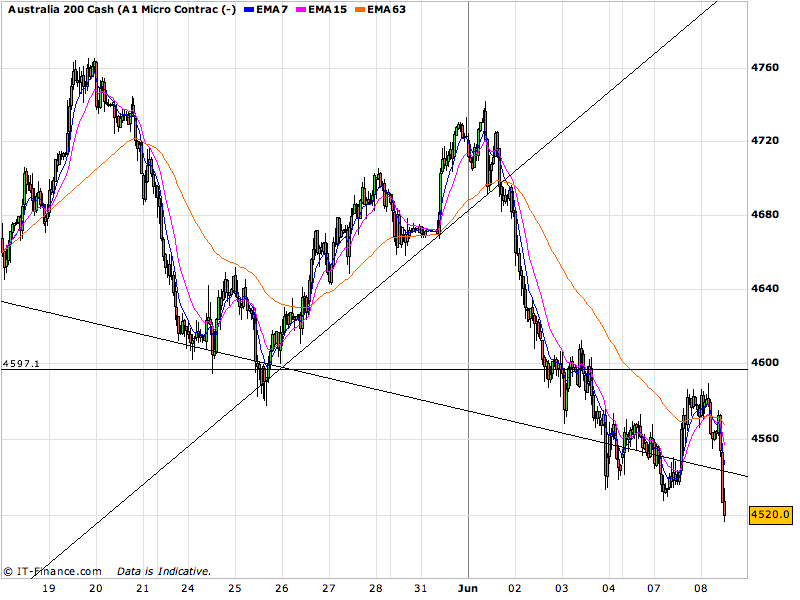
Hourly chart of ASX200
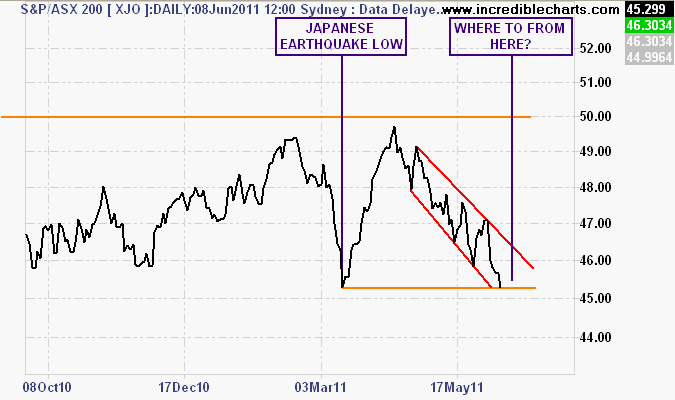
Daily chart of ASX200
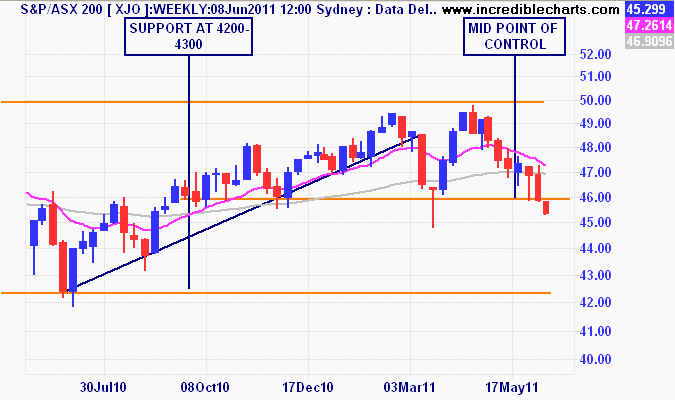
Weekly chart of ASX200 - note long shadow on Japan low candle