
The S&P/ASX 200 continues to slip, down 15 points to 4567, after following Wall Street’s losses over the weekend. Asian markets are down even furthera, with the Nikkei down 0.94%, the Hang Seng down 1.31% and Singapore down 0.42%.
Other risk assets are steady and even rising, with the AUD at 1.0744 against the USD, with gold back up to $1546 USD an ounce. WTI crude remains above $100, at $100.11 USD per barrel.
Movers and Shakers
The banks are generally down, with ANZ falling almost 0.8%, whilst NAB and WBC are down 0.5%, although CBA is up slightly. The major resource stocks are pushing the index down, with BHP down 0.7% and RIO falling 0.45%
Iluka (ILU) is up 6% on pricing news, whilst Gunns (GNS) drops almost 5% and Qantas (QAN) down 3.5% but its competitor Virgin (VBA) climbs almost 2 percent.
ASX200 Daily Chart
The market is still within a falling wedge/trend channel pattern and is fast approaching the Japanese earthquake lows just above 4500 points. As I mentioned in my study published this morning, a failure of this support level (which would be replicated by a failure in the Dow Global Index falling below 260, and other technical charts on the US and EU markets) would likely bring in a sideways bearish market, unable to attain the current market level for 12-18 months.
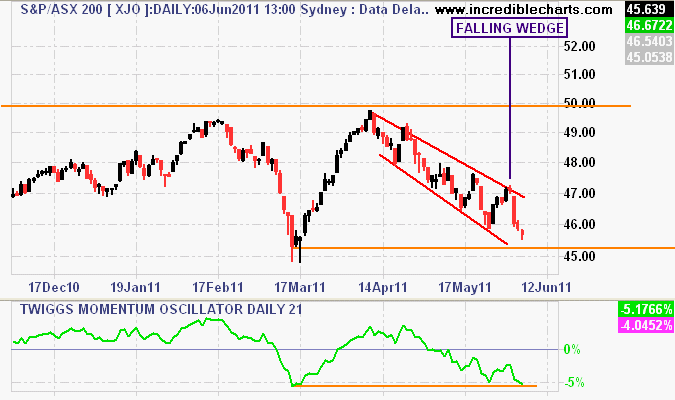
Daily chart of ASX200 with medium term momentum indicator
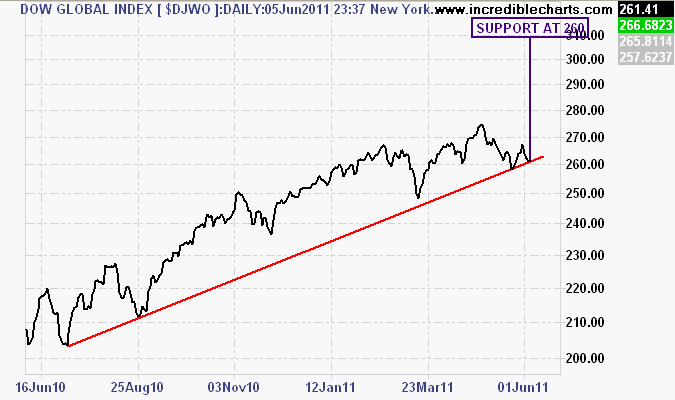
12 month daily chart of Dow Global Index - trend is still intact...just