
The S&P/ASX 200 is down 2 points or 0.04% to 4707 just after midday, after rallying strongly in overnight trade, but pulling back at the open this morning amongst the jitters around the negative GDP figures. Asian markets are also mixed, with the Nikkei down 0.2%, the Hang Seng down 0.2% and Singapore up 0.33%.
Other risk assets are mixed as well, with the AUD at 1.0731 against the USD, whilst gold is down to $1533 USD an ounce. WTI crude is slowly rising above $100 again at $102.93 USD per barrel.
The correction in the ASX200 has now stalled, with the daily chart showing the short term downtrend channel has been broken to the upside.
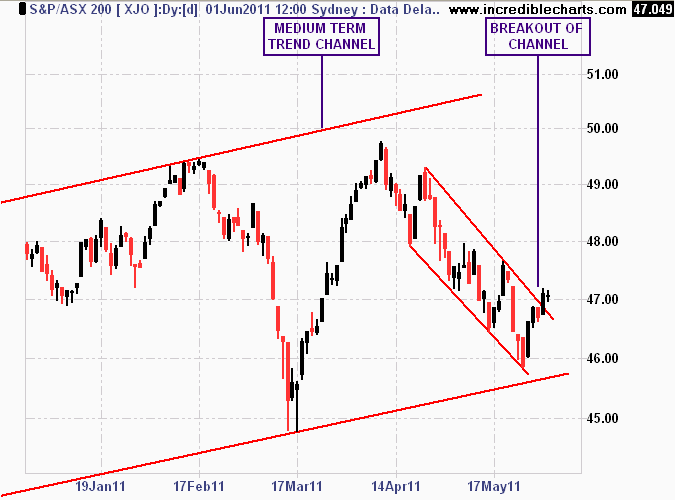
Daily chart with medium term and short term trend channels
The weekly charts show the medium term trend channel that has been in place since early June 2010. The Japanese/MENA correction in March respected the bottom of this channel, and it appears this month’s correction has done the same.
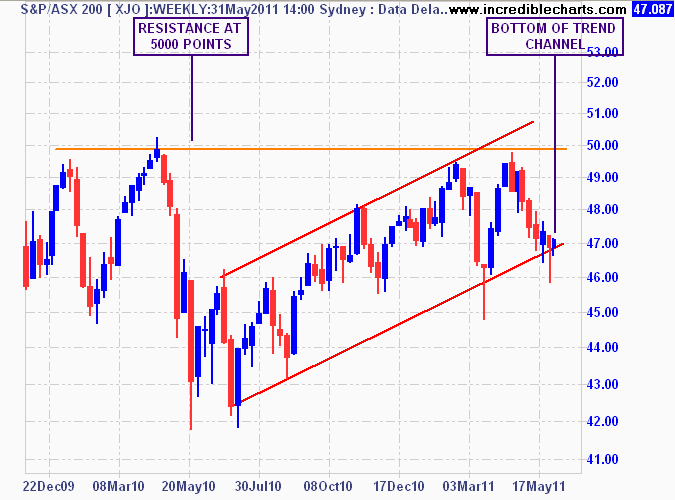
Weekly chart showing bottom of trend channel
The hourly chart is respecting a trendline from the bottom of the correction channel on the 26th May to today’s prices. A failure of this trend – at 4700 points – would indicate a sideways pattern from the remainder of the week, or possibly a continuation of the correction.
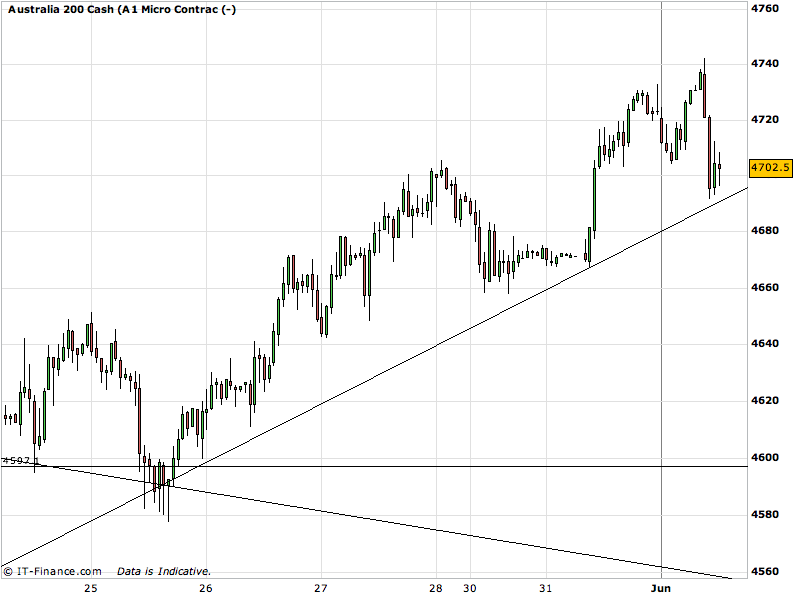
Hourly chart with possible new trend from 26th May low