
The S&P/ASX 200 opened down sharply reacting in line with overnight markets which were all down 1 to 1.5%, reversing yesterday’s gains. At just after midday, the index has lost just over 60 points or 1.31% down to 4510.
Asian markets are similarly effected, with the Nikkei down 1.1%, the Hang Seng down 1.4% and Singapore just under 1%.
Other risk assets are mixed, but the AUD has dropped over 1 cent and is now 1.0576 against the USD, gold up slightly to $1526 USD an ounce. WTI crude has been caned, now at $95.36 USD per barrel.
Movers and Shakers
It’s red across the board, with banks and resources all down strongly. CBA is down 1.14% to just below $50, ANZ down 1.6%, WBC down a large 1.71% and NAB down almost 1 percent. BHP has been hit strongly, down 1.4% with RIO suffering similar losses, both now at 2 year lows.
In other ASX200 stocks, its pretty grim with only Rock Oil (ROC) up 3% and Sigma Pharma (SIP) up just over 2%. The smaller resource stocks are getting smashed: Murchison Metals (MMX) down over 8%, Aquarius Platinum (AQP) down 6.4% and so on. Not a good day to be long resources.
ASX200 now below critical support
The market is now teetering below the Japanese earthquake lows at just above 4500 points – what today and this week’s close brings in will support market direction for the rest of the financial year (and calendar year probably).
A break below this level will extend the correction, with the next target at 4200 points – the lows in the May flash crash of 2010. Only a breakout above 4620-4650 points in the coming week or two would confirm a rebound in stocks, and at this point, with all macroeconomic data around the world pointing to slowdowns, deceleration or outright recession, it will likely be an impulse (short covering) rally at best.
Daily Chart
The daily chart shows how the current price activity has broken below the low point of the Japanese/MENA lows of March. This break of support is very bearish in the short term.
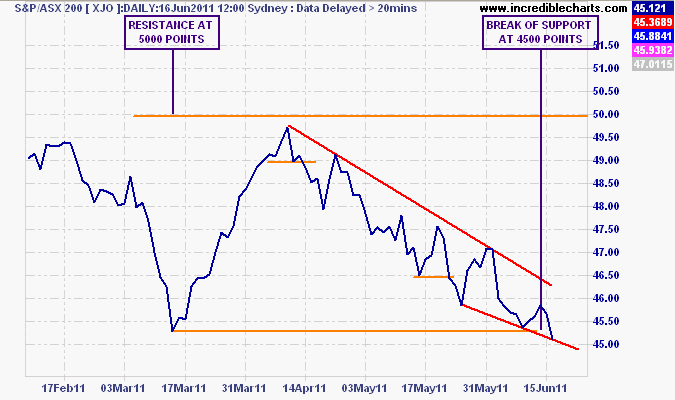
Daily chart of ASX200 - support at 4500 appears broken
Weekly Chart
The weekly chart shows the QE2 induced rally is well over and current prices are below the mid-point of control (4600 points) that has been in place for almost 2 years (look to the left – notice how the triple top pattern oscillates its mid point around 4600). Three consecutive weeks below this point is extremely bearish and adds weight to the probability that prices will continue to fall to the next support level at 4200 points.
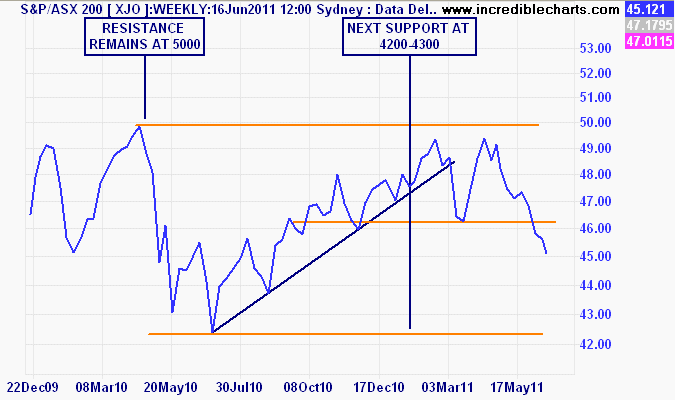
ASX200 weekly chart - market appears to be have lost its way....