
 There is always media chatter about what markets are going to do in the short to medium term. It’s most intense at the end of each year, as the financial pundits stare into their crystal balls and attempt to divine the direction of the All Ords, FTSE, Nasdaq, S&P 500, Nikkei and every other major index. In my experience it is most always an “up” prediction, unless the market is in the midst of a meltdown like it was in December ’08. However, in 2010 there has been a bit of talk about an entrenched sideways market – one that’s neither bullish nor bearish and where leading indices stagnate over a long period (noting that most market commentators think 12-24 months is a long period).
Most of the talk has been centred in the US market, with its odd combination of increasing corporate profit, high unemployment and a money-printing fed. However, some have recently been predicting the same for the Aussie market with MacroBusiness’s own Sell on News exploring the possibility in the excellent article “Bull-muddle-bear”. Houses and Holes has been continually beating the drum over lacklustre lending and business confidence data, whilst The Prince thinks the technical’s point to a long-term sideways move too. The recent mediocre results for business and consumer confidence also seem to support a muddle-through future for Australia, with markets neither dropping or advancing considerably.
What is a side-ways market?
The definition of a sideways market is dependent upon your time frames. I could pick a few months in the middle of the 2006/07 share market boom where prices went nowhere, but I wouldn’t say it was a sideways market because my investment timeframe is in years. On the other hand, a day trader may think of it as a sideways market.
To simplify the matter, I’ll define a sideways market as:
- Any period greater than two years where the major indices (ASX200, All Ords) went nowhere and
- There was no major correction.
Has it Happened Before?
The Australian markets have been increasing for some 20 years, punctuated by a few short (but painful) corrections. According to the All Ords chart below, the last one started after the ‘87 crash and finished in October ‘92. Over this 5 year time frame the All Ords went from 1,203 to 1,420. That’s an annualised growth rate of only 3.4% – lacklustre to say the least.

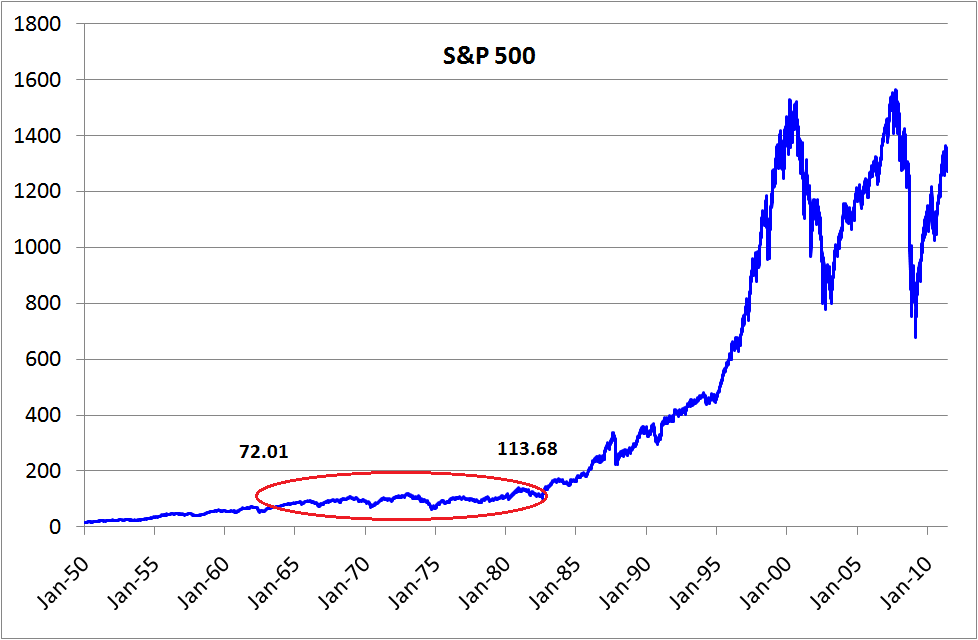
Looking at the US markets, the 50+ year old S&P 500 looks like this:
Due to the large timeframe, I’ve plotted it logarithmically below:
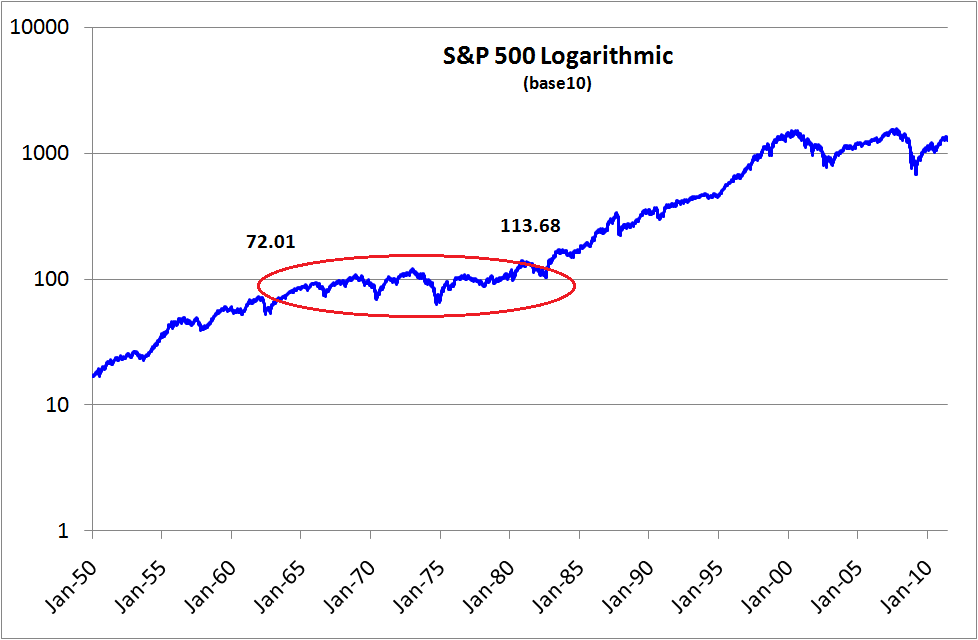
From December ’61 to February ’82, the S&P500 moved from 72 points to 113.7, which equates to a measly 2.3% annualised return over a 20 year period. Now that’s a sideways market. I’d wager a long-term Australian index would show similar behaviour given how correlated the Australian and US markets were during the 20th century.
So long-term sideways markets can, do and will occur. However, one thing to keep in mind when looking at a period like ’61 to ‘82 is that the index (in this case the S&P 500) is not a business. While overall the share market went nowhere, individual businesses were still started, succeeded or failed, new products and services were invented or discarded, economic shocks came and went, wars were waged and Jimi Hendrix rocked our world. All these things affected individual companies and their share prices (maybe not Jimi), so volatility and hence buying opportunities still existed. It just happened at a micro scale rather than in big mass market movements.
What about now?
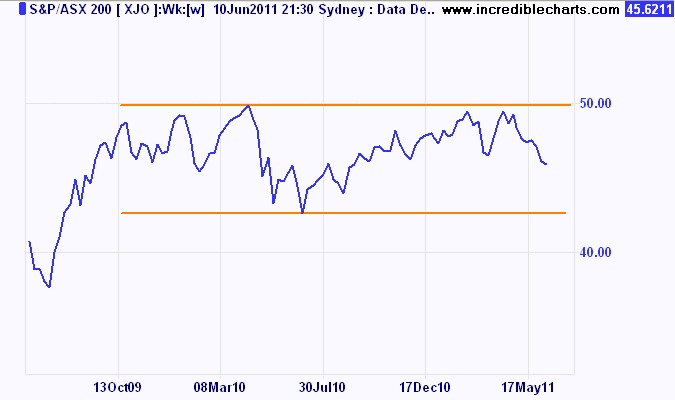
Well, the ASX200 for the last five years is shown below:
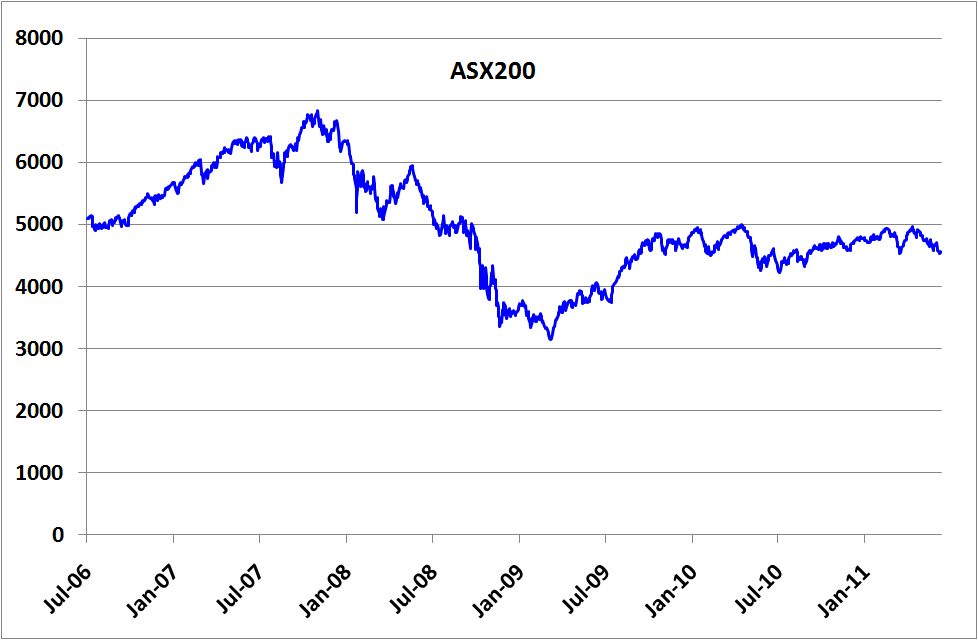
The trading types out there would say the market has traded “in a range” between 4,000 and 5,000 since about September ’09. They may even hop onto a charts program and draw nice lines like the one below from Incrediblecharts (tips hat to The Prince):
As a value investor I think about the macroeconomic fundamentals and the possible risks that lie ahead rather than the lines on a chart. On the horizon I see the following risks:
- Eurozone sovereign debt issues, especially Greece in the short term,
- Inflationary issues in China and the Communist Party’s response,
- The deflation/correction on the Australian housing bubble,
- Political deadlock in the US over government debt,
- Oil shocks arising from revolutions in the Middle East,
- Further housing falls in the US as unemployment stays high,
- A sustained high Australian dollar severely hampering our tourism and manufacturing sectors,
- Global food inflation.
On the opportunities side I see:
- An approaching mining boom (should China sustain its growth trajectory),
- Low government debt in Australia, allowing for fiscal cushioning if required in an emergency,
- Relatively low Australian unemployment.
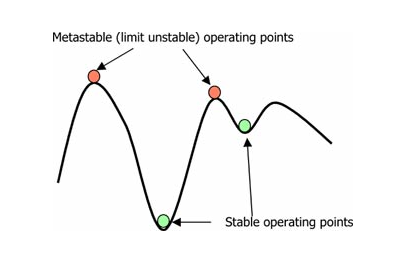
The Australian economy seems to be in a meta-stable state i.e. a precarious position that would require just one incident to push it into a new direction. The Aussie consumer is cautious but not panicked because unemployment is low. Interest rates and the RBA’s jaw boning seemed to have cooled the non-resource sectors of the economy in order to make way for Futreboom! So far so good, given the impact the GFC had elsewhere.
However, if any of the aforementioned risks create a big shock – whether it’s declining commodity prices, higher credit prices or higher oil prices – I believe the Australian economy will be pushed in a new direction, most likely downwards. And equities prices will follow.
So my prediction is a sideways/muddle through market until something big happens. Sort of like saying the sun will rise tomorrow, but it’s as good as I can give you without channelling Nostradamus.
How does this change the Value Investors approach?
If a sideways market is on the cards, many finance types will advise looking for defensive stocks. Which is the same as saying “chase them dividends!” Defensive stocks are typically your blue chips with high or consistent dividend yields (the big 4 banks, Telstra, BHP with the current dividend policy). These are in contrast to your “growth” stocks – typically smaller businesses that reinvest a lot of their earnings in order to “grow the business”.
While seeking out high dividend stocks may seem like a good idea in uncertain times, investors can often miss out on better returns in the long run because they neglect those companies that are expanding their equity base. This can be shown by a simple example with two companies – a “Dividend Company” which gives out all its earning as dividends and a “Growth Company”, which retains half of its earnings:
“Dividend” Company
| Year 1 | Year 2 | Year 3 | Year 4 | Year 5 | ||
| Equity per share | $10.00 | $10.00 | $10.00 | $10.00 | $10.00 | |
| Return on Equity (ROE) | 20% | 20% | 20% | 20% | 20% | |
| Dividend | 20% | 20% | 20% | 20% | 20% | |
| Reinvested | 0% | 0% | 0% | 0% | 0% | Total |
| Total Earnings | $2.00 | $2.00 | $2.00 | $2.00 | $2.00 | $10.00 |
| Dividends | $2.00 | $2.00 | $2.00 | $2.00 | $2.00 | $10.00 |
“Growth” Company
| Year 1 | Year 2 | Year 3 | Year 4 | Year 5 | ||
| Equity per share | $10.00 | $11.00 | $12.10 | $13.31 | $14.64 | |
| Return on Equity (ROE) | 20% | 20% | 20% | 20% | 20% | |
| Dividend | 10% | 10% | 10% | 10% | 10% | |
| Reinvested | 10% | 10% | 10% | 10% | 10% | Total |
| Total Earnings | $2.00 | $2.20 | $2.42 | $2.66 | $2.93 | $12.21 |
| Dividends | $1.00 | $1.10 | $1.21 | $1.33 | $1.46 | $6.11 |
The growth company is adding half of its earnings to its equity base, which allows it to generate more earning in the following year. The rest are given out as dividends. By contrast, the growth company gives out all its earnings and the equity base is static.
After 5 years, the dividend company has paid out $3.89 more in dividends. However, the equity base is $4.64 lower than the growth company. This means that by year 5, the earnings per share of the growth company are 46% higher than the dividend company.
Which company would you rather own?
It’s a simplified example (no buy backs/raisings, consistent ROE) however the principle still applies to all businesses. Given the choice between these two companies, a value investor should always pick the growth company. No matter what kind of market you’re in, if a company has increased its equity base and earnings per share, you can expect the share price to follow. This may take a while in a sideways market, but you can rest assured the earnings are increasing as time goes by. If the market continues to underprice the growth stock, then the value investor would actually buy more.
Summary
So if a sideways market is upon us, chasing dividend stocks doesn’t always produce the best outcomes. Growing a company’s equity base means the earnings will also grow, assuming ROE is maintained. That’s a big caveat, but looking for companies with high ROE, low debt and a durable competitive advantage goes a long way to ensuring you pick a winner in any market. The likes of Woolworths, Cochlear and Cabcharge would tick most of these boxes.
In this week’s Equities Spotlight article we’ll examine another Australian-listed company that fits the bill. In the mean time, I highly recommend The Prince’s article examining the investment outcomes of Telstra (a classic dividend stock) and comparing them with Cochlear (a growth stock).
https://www.macrobusiness.com.au/2011/03/telstra-still-a-telegraph-pole-stock/
Disclosure: The author is a Director of a private investment company (Empire Investing Pty Ltd), which has an interest in some of the businesses mentioned in this article. The article is not to be taken as investment advice and the views expressed are opinions only. Readers should seek advice from someone who claims to be qualified before considering allocating capital in any investment.