
The S&P/ASX 200 is up 36 points or 0.78% to 4626 points just after midday, reversing some of this weeks losses. Asian markets are up, the Nikkei 1.2%, the Hang Seng up slightly at 0.37% and Singapore steady.
The AUD is above 1.05 against the USD, whilst gold continues to rise at $1529 USD an ounce and WTI oil up strongly at $101 USD per barrel.
The 12 month daily chart shows a trend channel, with current prices gravitating to the bottom. Bullish investors and swing traders can use this correction opportunity to go long this channel trade.
The weekly charts show the medium term sideways channel that has operated for almost 2 years, with prices gravitating around a point of control of 4600-4700 points. Resistance at 5000 points is very clear, with the triple top from late 2009, early 2010 and a subsequent double top failing in early 2011.
Strong support is evident at 4400-4500 points, with medium term support at 4600 points. Strong buyers have stepped in on almost every occasion at the 4600 point level.
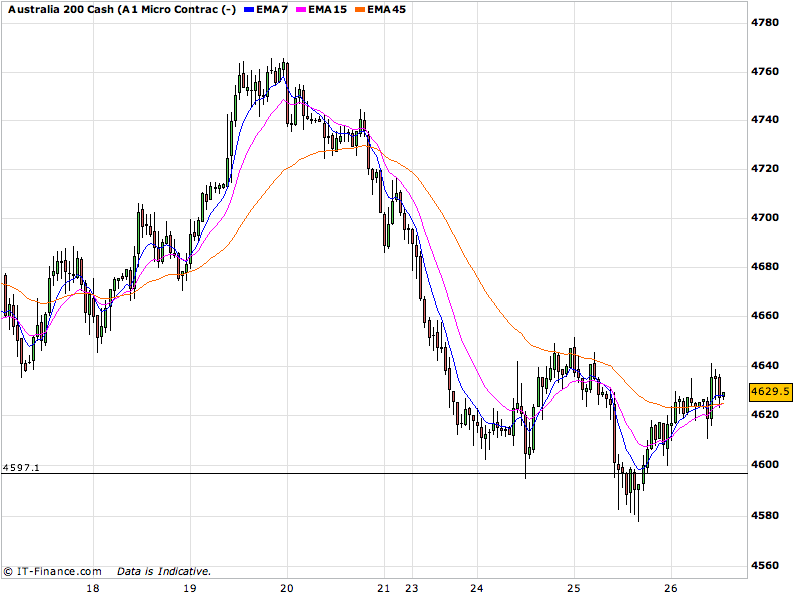
Hourly chart - note support at 4600 points
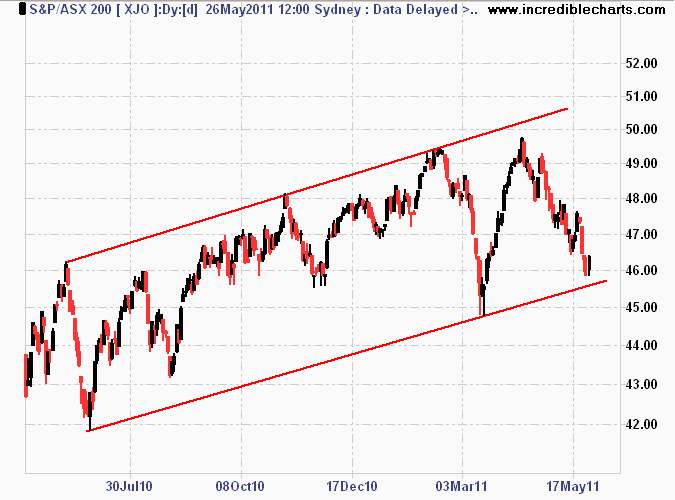
Daily chart showing medium term trend channel
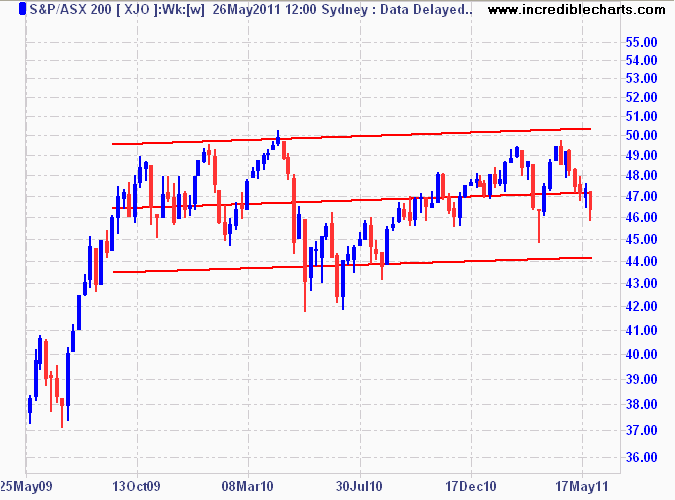
Weekly chart showing 2 year sideways channel