
The S&P/ASX 200 is up 25 points to 4684 just after midday, continuing to claw back some of this weeks losses. Asian markets are mixed however, with the Nikkei down 0.24%, the Hang Seng up 0.76% and Singapore also up 0.71%.
Other risk assets are up too, with the AUD above 1.07 against the USD, whilst gold stabilises after an early morning drop to $15269 USD an ounce. WTI crude is again above $100, at $100.75 USD per barrel.
So where is the Aussie market? As I showed yesterday, the 12 month daily chart shows a trend channel, with current prices gravitating to the bottom. The shorter term charts show a downtrend channel that has not yet broken to the upside – this would require a close above 4700 points.
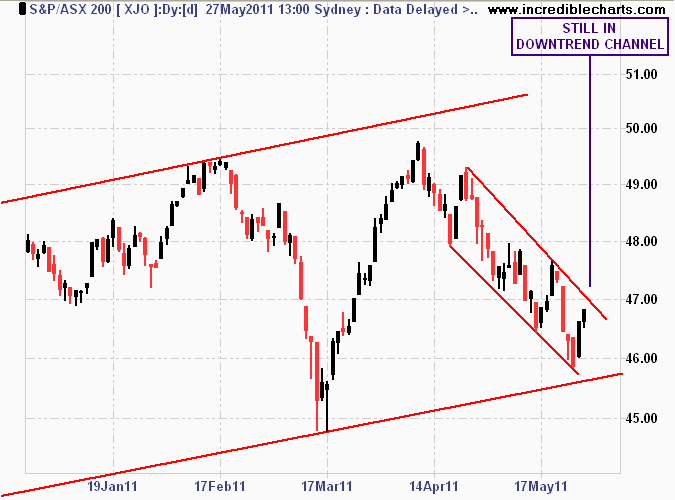
Daily chart showing medium term trend channel and shortterm channel
Hourly charts show this may happen sooner rather than later with a strong rebound from Wednesdays low.
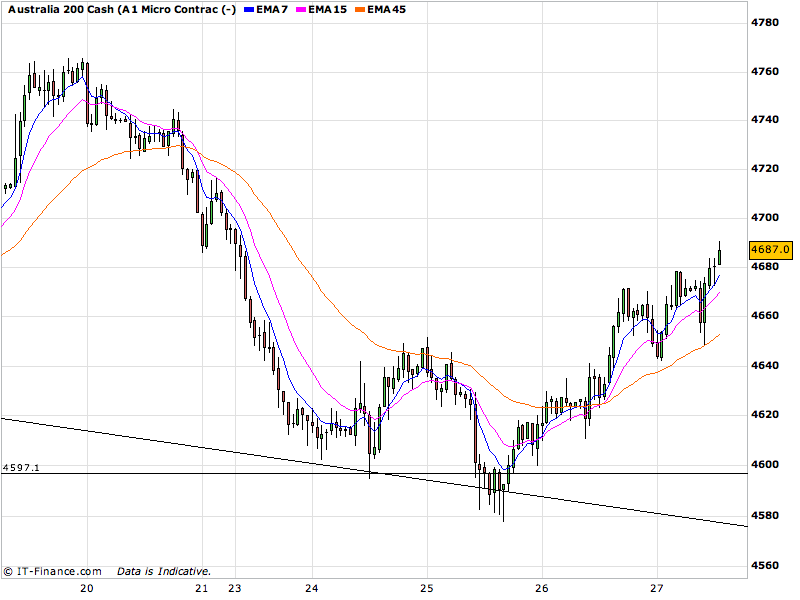
Hourly chart showing rebound in the ASX200 since Wednesday
Note that the weekly charts still show the medium term sideways channel that has operated for almost 2 years, with prices gravitating around a point of control of 4600-4700 points. Resistance at 5000 points is very clear, with the triple top from late 2009, early 2010 and a subsequent double top failing in early 2011. This is still a sideways market.