
Profit
Compared to the March 2011 HY results, NPAT was up 16% to $2.43 billion and cash earnings increased 22%, with all divisions experiencing growth (except Corporate Functions). This can be seen in the Cash Earings chart below.
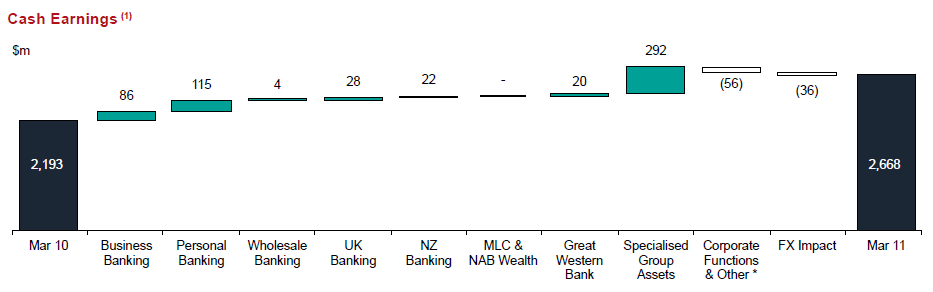
Similarly to ANZ &WBC, NAB benefited strongly from a fall in impairment charges of 20% compared to HY 2010 (shown in the Specialised Group division).
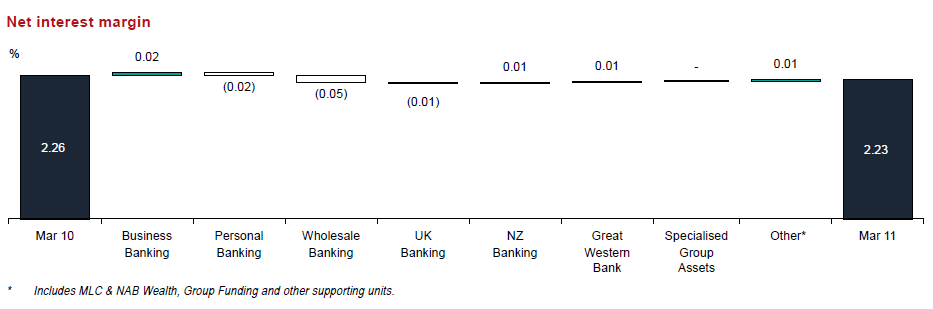
Net interest margin (NIM)
Compared to March 2010, NIM decreased 3 basis points from 2.26% from 2.23%. NAB highlighted an increase in deposits as well as an increase in wholesale funding costs as the main drivers.
Lending
Housing loans increased by 11.3% since March 2010, whilst non-housing lending increased very slightly by 0.5%. This slight increase in non-house (business) lending is better than the 4% drop reported by WBC yesterday. The Lending split is shown below.
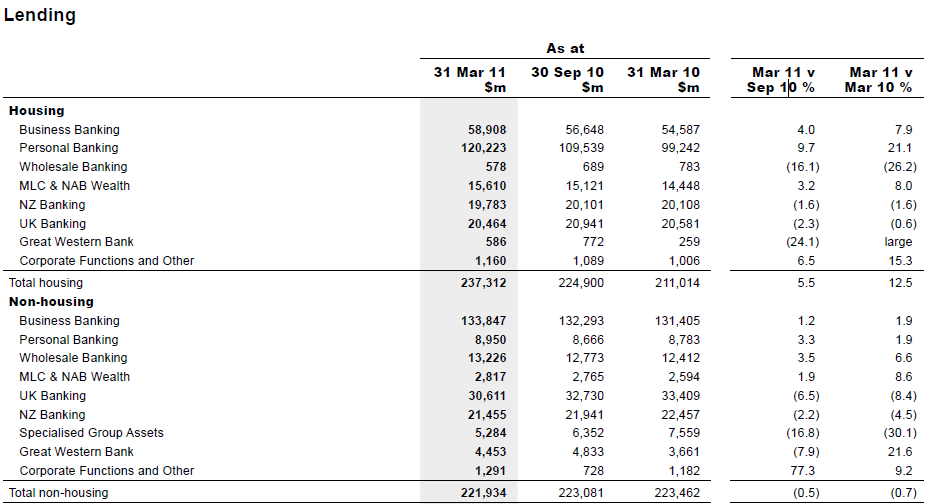
NAB claims “Australian system credit has generally remained stronger, reflecting the more buoyant national housing market, but business credit has been surprisingly slow to grow despite sustained growth in economic activity”. That first comment would seem to be at odds with the overall market figures we’ve seen come out recently, but does seem to fit the loan growth profile of NAB.
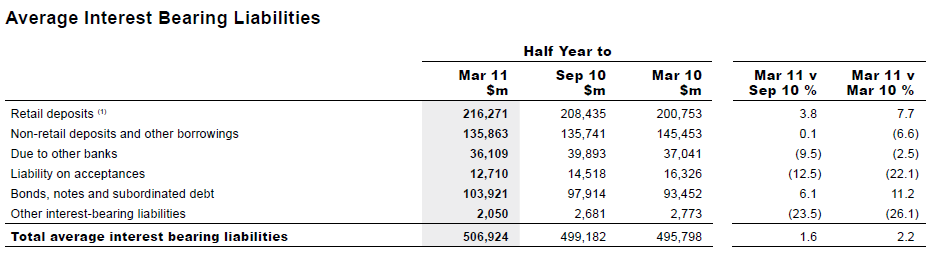
Funding
Customer deposit growth has grown 7.7% to $216B, which has offset a decrease in wholesale funding since March 2010. However, in the last 6 months wholesale funding has increased a modest (see chart below)
Like all big four banks, WBC has been competing for deposits and making an effort to reduce their wholesale funding.
Dividend
WBC announced an interim dividend of 84 cents, up 12.5% on the prior period, representing a 68% payout ratio.
Arrears Watch
After ANZs sharp jump in 90+ days retail delinquencies, we’ve been keenly awaiting NABs result. Whilst I couldn’t find a number giving the same retail delinquencies (it’s a big report so if anyone else sees it let me know), I did find the following for impaired assets:
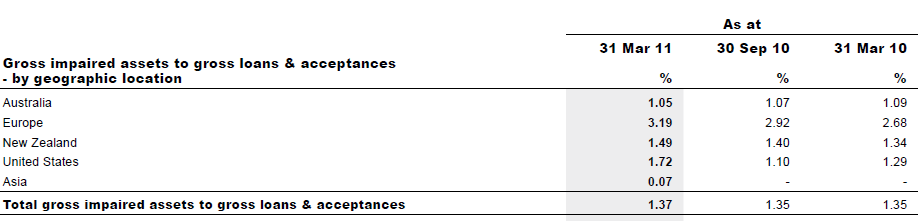
It looks like Australia’s doing ok (down 2 bps) whiles everyone else is up. As I said, if anyone can find a different data set then shout it out.
Summary
So on the face of it NABs result looks pretty solid. As with ANZ and WBC, deposits are up and wholesale funding is down. NAB still has a big exposure to mortgages (although not as much as CBA or WBC) and even seems to have stolen some more of the mortgage markets as their home lending increases. Their delinquencies seem to be stable, with off-shore operations increase impaired assets slightly.
As I said with the ANZ post, Empire still considers the big 4 a risk due to their Australian mortgage exposure and a future of average returns on equity (low teens as opposed to 20%+ pre-GFC).
Disclosure: The author is a Director of a private investment company (Empire Investing Pty Ltd), which has no interest in any business mentioned in this article. The article is not to be taken as investment advice and the views expressed are opinions only. Readers should seek advice from someone who claims to be qualified before considering allocating capital in any investment.