
Lots of charts to look at today, first the usual fractal look at the Australian market, and then a quick look at the major components of my “Crashlist”. This is a select list of equity, FX and PM markets that I watch each evening as they open and analyse each morning before the Australian market open.
Australian Market Summary
With a couple hours to go, the S&P/ASX200 index looks set to close the week 1.61% higher, after a mid-week pause. Today’s action has been strong with the mid-level resources stocks soaring. Traders are also still likely the four major banks which continue their upward trend, with NAB and WBC nearing their mid-February highs.
Monthly Summary
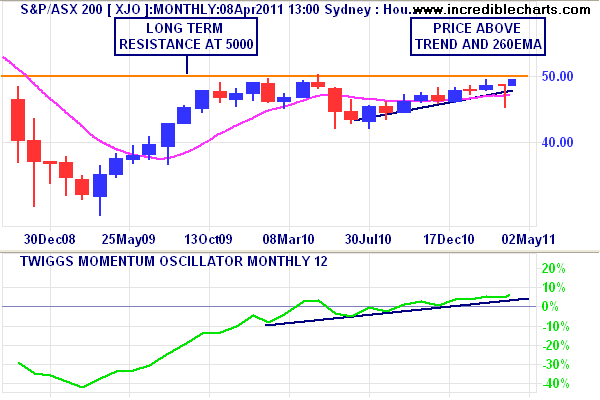
The impact of the Japan Earthquake shows as a faint tail on the monthly charts – as the medium term rally to catch up to other equity markets continues.
Momentum is also solid, passing the 5% stage for what I consider a bullish market stance. Again, the 5000 level remains key resistance, and with the overly large representation of the banks and major resource stocks, now almost at their recent highs, one wonders where the push will come to get over this level.
Weekly Summary
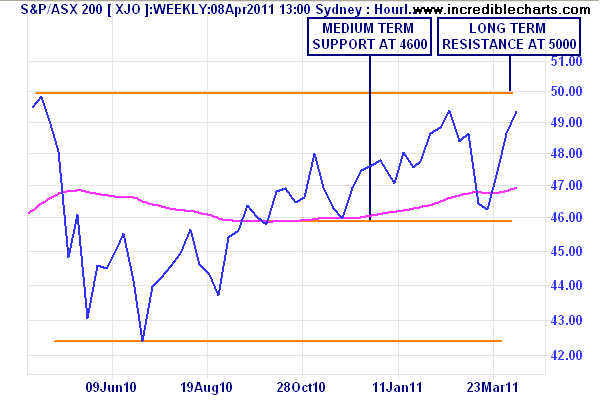
This chart is a little clearer, showing the intra-week of the Japanese/MENA impacts. Medium term support clearly remains at 4600 points, whilst the market at large desperately wants to reach its historical high.
Daily Summary
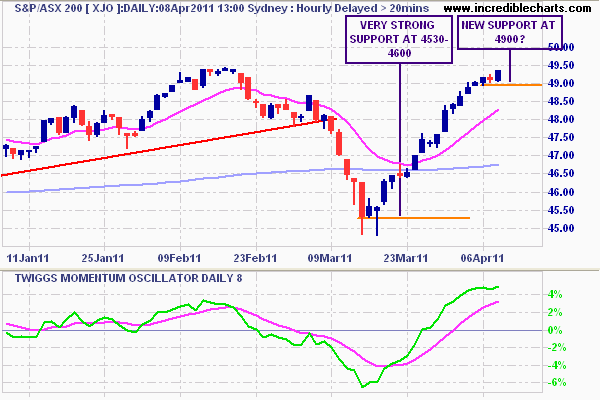 Finally the daily chart, using candles (red candle is a down day, blue candle an up day) illustrates the very strong rebound in recent weeks. Clear support at 4600 points is evident, whilst locally, 4900 points may turn out to be a new support.
The short term momentum indicator suggests the mid week pause that I forecast last week is now returning on track for a medium term trend.
Regardless of economic fundamentals (or the perceived fundamentals: if you think the Australian employment market is “full” I have several bridges and rugs to sell you), the market still follows the rest of the world, and there appears to be some major topping action occurring.
Crashlist Analysis
With a possible US government shutdown looming, and on the back of the recent ECB interest rate rise, times are interesting to say the least. I’ll go through the basic currencies and gold (but I repeat myself) first, then the Asian markets and then finally the US markets.
First, the unmistakeable surge in the AUD/USD pair from mid-March onwards.
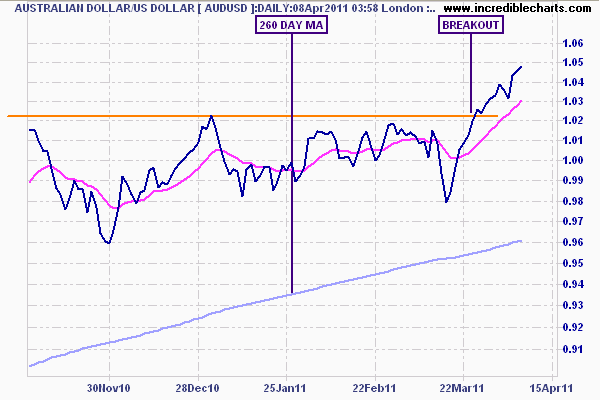
Note how the long term 260 day moving average is trending nicely, indicating very strong internal support by speculators (and the 5% who buy the Aussie for real purposes). The breakout from the $1.02 level was followed by a classic dip (a shakeout) and then preceded upwards again.
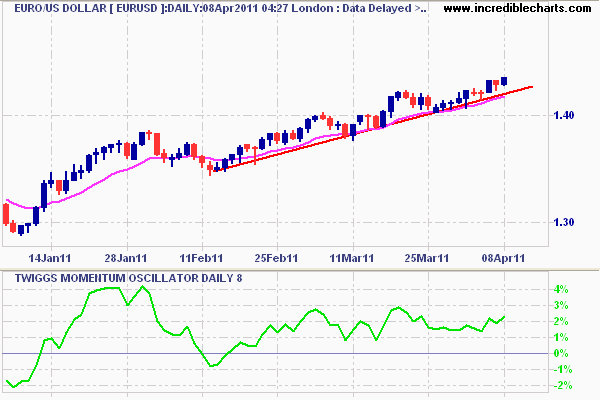
The Eurodollar is doing even better, having trended strongly since mid-February. Notice how it respects its 15 day moving average (a running level of support) and the trendline. Short term momentum supports continued action as do all directional indicators.
As the ECB continues to raise rates (or the perception is there it will) whilst the US runs negative real rates, one can ponder how far the Euro can go. The next target is just over 1.50. With news of an “unpredictable” Portugal bailout swallowed by the market without a shudder, that target could be broached soon.
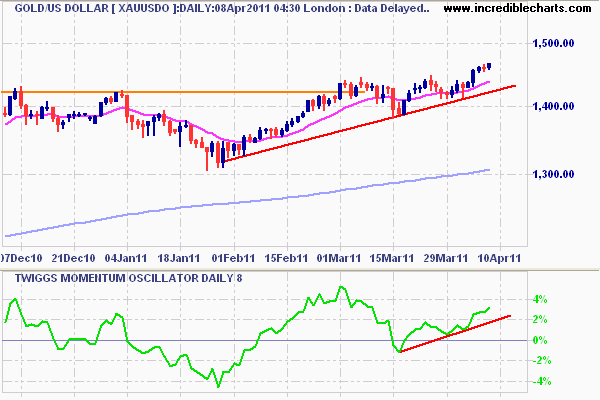
Spot gold in USD continues its breakout of its recent reverse head and shoulders pattern past historic, un-adjusted for inflation high. Gold has a similar behaviour to other currencies and is usually inversely correlated to USD.
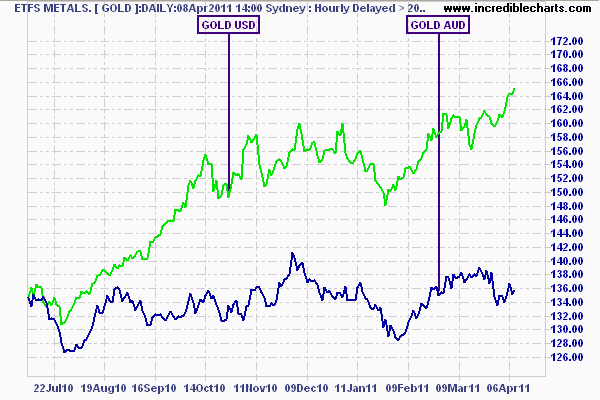
Unfortunately for AUD holding gold speculators, the march upward in the spot gold price is not reflected in the AUD price – as shown in this comparison graph of the GOLD ETF (Aussie) and spot Gold (USD).
Now to the Asian markets:
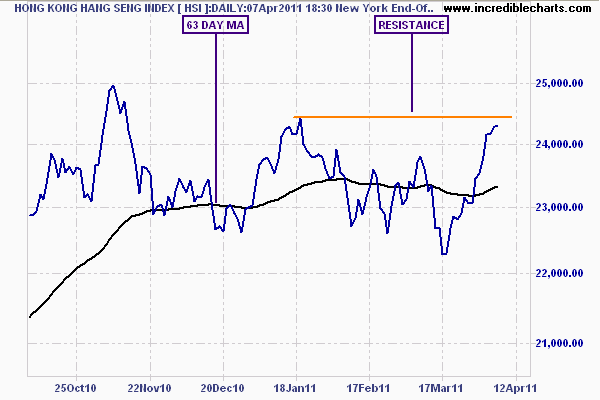
The Hong Kong Hang Seng Index (HSI) is flittering with medium term resistance, as its daily price fluctuates around the 63 day moving average since late last year. A too-strong rebound rally off the Japan earthquake will likely struggle to get past that level.
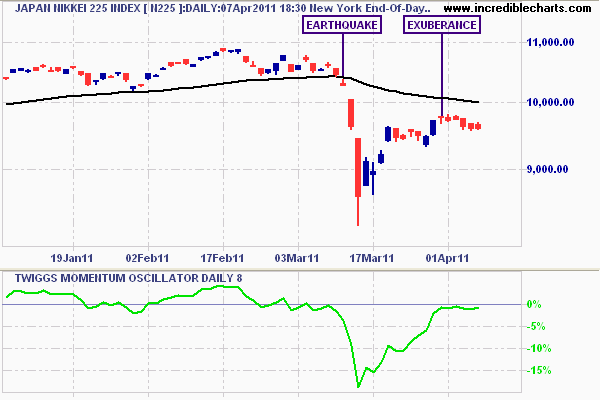
The daily chart of the Nikkei 225 reveals the dramatic fall in values due to the earthquake, and some very healthy exuberance thereafter. However – note that short term momentum is definitely not bullish, and it remains well below the 63 day moving average. A report of another large aftershock today and increased commodity prices (therefore increased input costs) against a rising yen will put a damper on the markets in my opinion.
US Markets
The weekly S&P 500 charts reveal a probable dip or correction to the main trend begun in August last year is forthcoming.
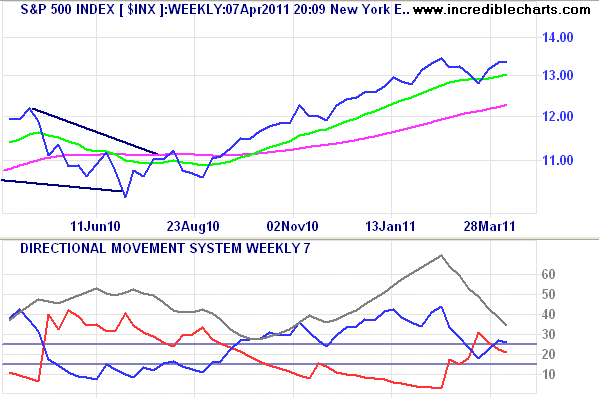
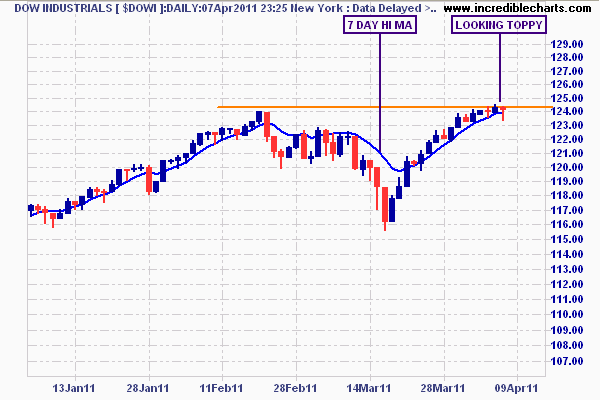
The medium term directional indicator is dropping fast, whilst confusion abounds from the Japanese earthquake fallout (pardon the pun). A closer look at the daily charts – both the Dow Jones and S&P500 – reveals some topping action as prices hit resistance and short term momentum reverses.
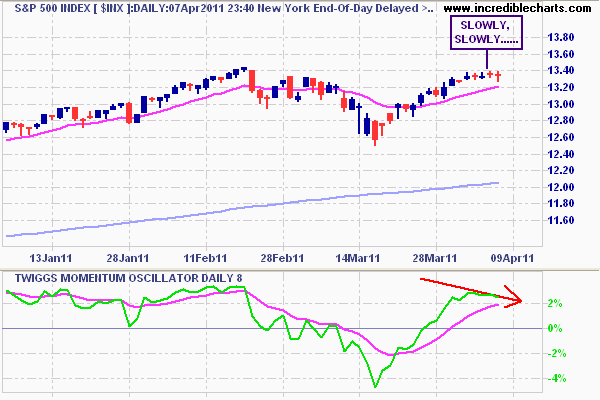
There is still some way to go for QE2 with upcoming POMO filling the US equity markets with liquidity. However, the looming US government shutdown could turn this a possible dip or pause into a correction.
Disclosure: The Prince is a full time equities trader, running a personal account. I may have positions (long and short) in some or all of the securities mentioned above. This post is not advice or a recommendation to buy or sell. Do your own research and consult an adviser before allocating capital.