
Summary
The S&P/ASX200 finished the week 90 points lower, or 1.83 per cent to 4,823 points on Friday. After a sideways move around the 4875 point level, the market experienced a broad sell off on Friday.
The market is now back to its pre-Japan/MENA correction pause level, with support at 4800 points. Curiously, the correlation with the US market has reversed, as the former gains new highs, whilst the Aussie tracks sideways. Commentators suggest this is due to the high AUD impacting local company earnings and a Chinese central bank applying the brakes, but the “cautious consumer” and lack of housing construction and lending is also weighing on the market (although banks are up).
The miners are also experiencing high volatility, with the S&P/ASX300 Resources index down 7.8% since 11th April. Interesting times!
For my full weekly trading report, download here. Trading Weekly 30th April 2011 – MacroBusiness
Monthly Analysis
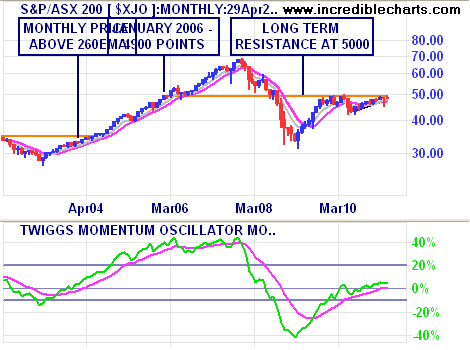
The market is almost replicating the start of the 2003 boom, in terms of trend development, but the key difference is momentum and directional strength. The former is tapering and the latter is weak, with no strong signals. Intra-month volatility has been high, and the number of dips and corrections higher than the average.
These are clear signs of a bear market rally, not a new bull market.
Directional movement is still weak on the monthly chart, as we approach the all important 5000 point resistance level.
Weekly Chart
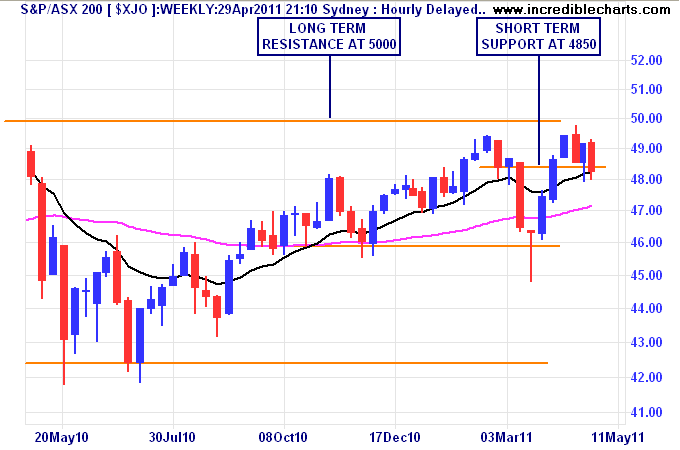
The weekly chart illustrates the volatility of the previous 12 months. The Japan/MENA correction found a bottom near 4600 points and the market has rebounded swiftly, returning to its medium term trend.
However, the current week has closed below short term support at 4850 points. Secondary indicators suggest a bearish sideways pattern continuation, with the possibility of continued falls to 4600 points.
Daily Chart
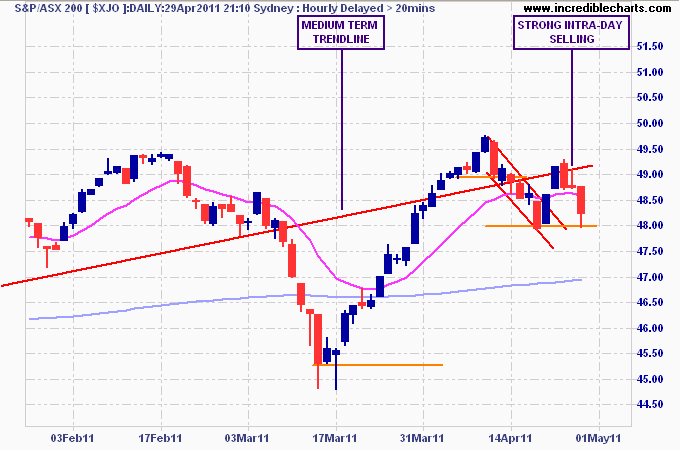
The daily chart clearly shows how the trader’s have been in control of the local market, as dips, corrections, rallies and rebounds proliferate.
The rebound from the early April dip has failed, with support broken at 4875 points. Strong intra-day selling is readily apparent (note the long “wick” on Thursday’s candle, and the deep bearish Friday candle).
The next support level is 4800 points. Secondary indicators are suggesting a sideways bearish position.
Conclusion
The S&P/ASX200 Index continues to baffle observers as being out performed by poorer and more debt-laden economies like the US, UK and Europe. The Chinese and commodity markets (but I repeat myself) are weighing on the local market and it appears the grand old correlation of AUS to US is slipping away.
The monthly and weekly charts support a continued bear market rally thesis, with increased volatility compared to an out and out bull market (or Ponzi market as it appears in the US at the moment).
Resistance at 5000 points and support at 4600 points create a probable channel where prices will gravitate for the time being. There maybe some short term price movements to be had, but on the whole, investors should stay away from the market – the old adage, “sell in May and stay away”, seems to be self-fulfilling.
Disclosure: The content of this document should not be taken as investment advice or construed as a recommendation to buy or sell any security or financial instrument, or to participate in any particular trading or investment strategy. The views expressed are the opinion of the author only. The author may have a position in any of the securities mentioned. Any action that you take as a result of information or analysis is ultimately your responsibility. Consult someone who claims to have a qualification before making any investment decisions.