
Weekly Summary
Apologies for not posting my regular end-week summary, but this blogger is feeling the combined effects of moving house and re-valuing the avalanche of HY earnings reports. What follows is my analysis from last week but with notes on today’s correction and what it may mean looking ahead for the rest of this month and quarter.
The benchmark S&P/ASX200 index closed just below the psychologically important 4800 level today, falling 1.36 per cent to 4,797.9 points. Today’s move was across the board and some of it could have been attributed to many companies going ex-dividend (on this date, any new owner of stock is not entitled to the dividend, hence the “value” of the stock should go down by the amount of the dividend), including market heavyweight BHP Billiton (plus Monadelphous, Brambles and Toll).
The banks continue to take a heavy toll with CBA down approx. 10% since its early February high – with the remaining big banks also retracing their New Year rallies.
Ostensibly, the reason for today’s move is the ongoing unrest in the Gulf/Arabian states, but even though the 4800 level was breached, the medium term trend line from the August 2010 lows is still intact.
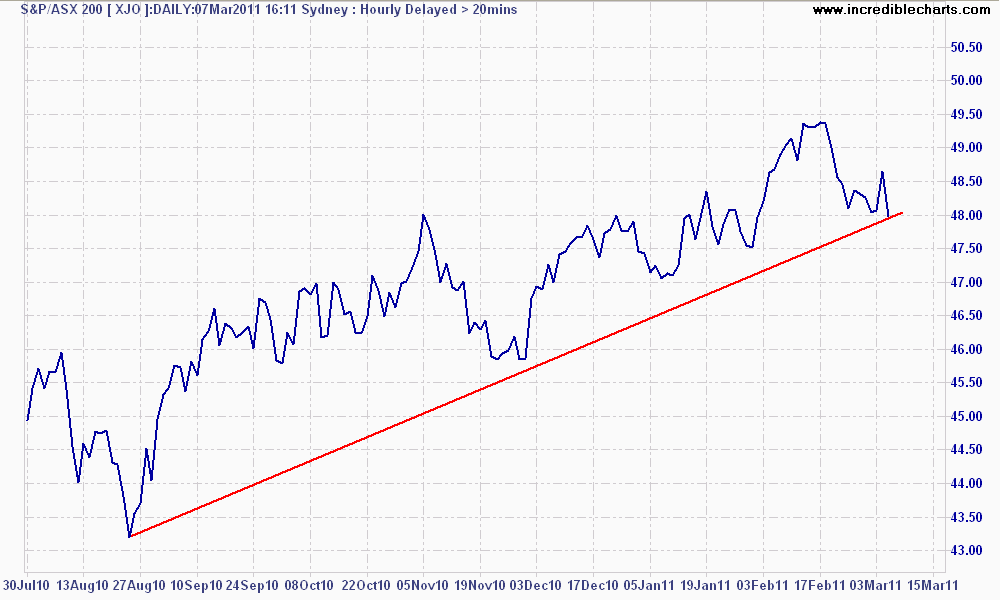
Trend is intact on daily chart, but...
Although worryingly, on the weekly chart, the trend appears broken. This is still intra-week however – and for longer cycle traders is not confirmation of an end of a trend (which differs from a correction).
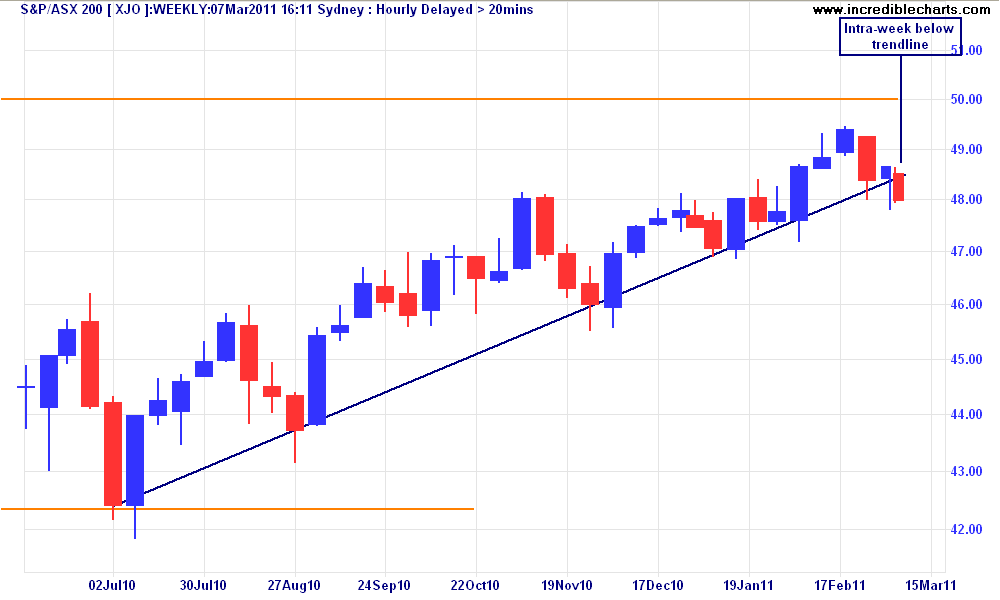
...but intra-week looks ominous
Although markets are getting “quicker” by the decade (e.g HFT), most activity gravitates around weekly and quarterly cycles as the “big money” moves in and out of sectors, stocks and themes.
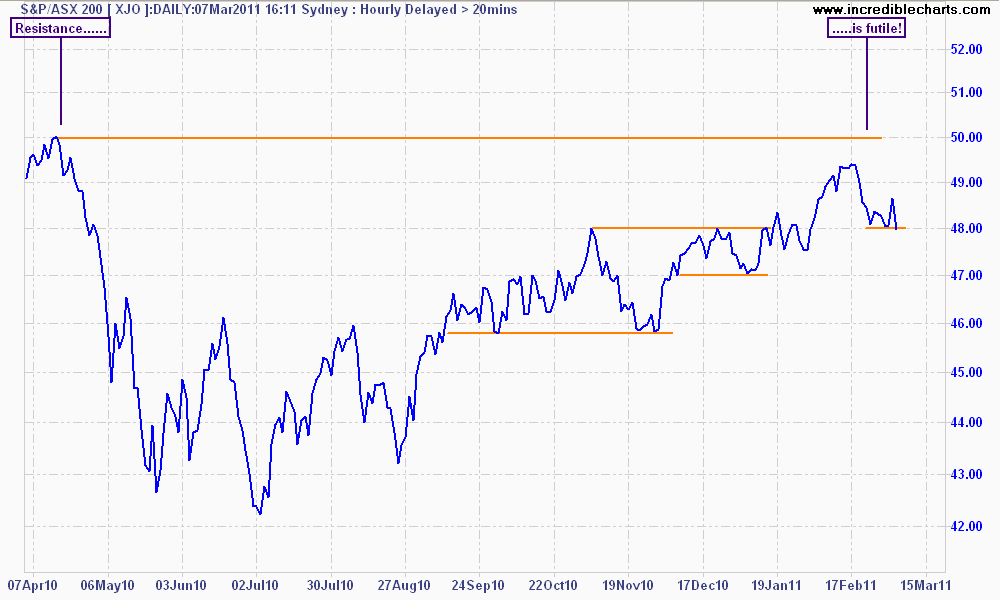
Support and Resistance
The 4800 point level remains as the significant support level whilst 5000 is the local and long term resistance. This has serious consequences on buyers and sellers behaviour, and for the more adept traders allows use of strategies that strangle this game of numbers.
But for long term investors who are relying upon future price increases, the 200’s continual headslam into the magical 5000 figure is an impatient waiting game. “Buy the Dip” is an oft-quoted reaction to today’s correction, but like property “investors”, too many months (and years) waiting for an eventual breakout (i.e more rainbows, less rain) may weigh on those investors who wish to participate in today’s highly engineered markets.
Short Term Rally is still high probability
The rah-rah crowd are almost all guns blazing in their combined belief that the market is undervalued and ready to tear away. This blogger is not a believer, but still “goes to church” to listen to the sermon (with a copy of Macrobusiness hidden between the covers of the hymn book).
If what they are reading from their scriptures (e.g dividend yield exceeds bond yield, forward P/E estimates are below historical averages, historically high planned capex, strong but lazy balance sheets, the miracle Gittins! economy, its only “uncertainty” not fundamentals) is what the market believes to be the truth, then this blogger – like most traders – will find religion quickly and ride that train. And stop mixing his metaphors.
Several technical factors still support a possible short term rally:
- Volume build up: continues to rise from the January low
- Corrections continue to respect the well-watched 50 day moving average: although 3 of the last 8 trading days have closed below this level
- Resistance levels soon become support levels (see chart above) e.g 4600 to 4800, then 4700 to 4800, now 4800 to 5000
- Price action still above the 260 day moving average (which indicates a bullish, but not full-blown bull market) since Sept 2010
But basic charting analysis suggests a more bearish stance: a classic head and shoulders pattern is developing, with a neckline at approx. 4750 points.
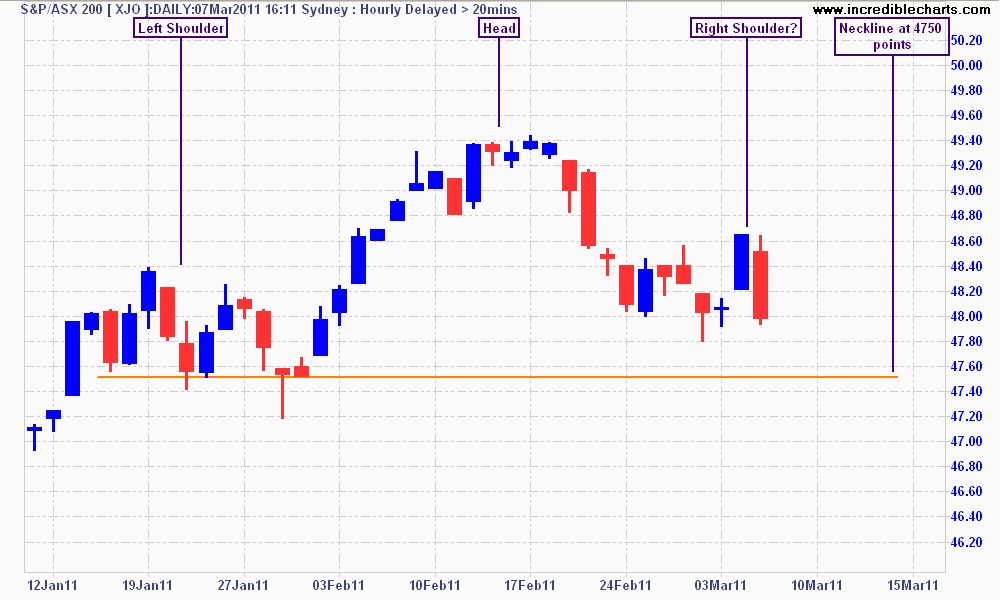
click to enlarge
Risks and Rewards ahoy
Bears need to watch for the index to close below 4800 for the week, with a correction underway if it cuts the 4750 neckline. Bulls need to see prices shrug off recent bad news and bounce off 4800, with a new rally confirmed on a breakout above 5000.
Disclosure: This blogger trades and may have underlying positions in all or any of the above mentioned companies and indices, both long and short. Like all endeavours, do your own research as none of the above constitutes investment or trading advice.