
As falling housing prices continue to spread to more and more markets across the nation, the eyes of the public and of property analysts is often fixed on the various price indices measuring the decline.
As things currently stand, prices are down 5.9% at a five-capital-city aggregate level, with the worst performer, Sydney, down 8.3%, followed by Melbourne, down 7.2% since its peak in the last year’s worth of data.
On the other hand, the best-performing locales so far are Adelaide, down by 3.0% and Brisbane (including Gold Coast) down by 4.0%.
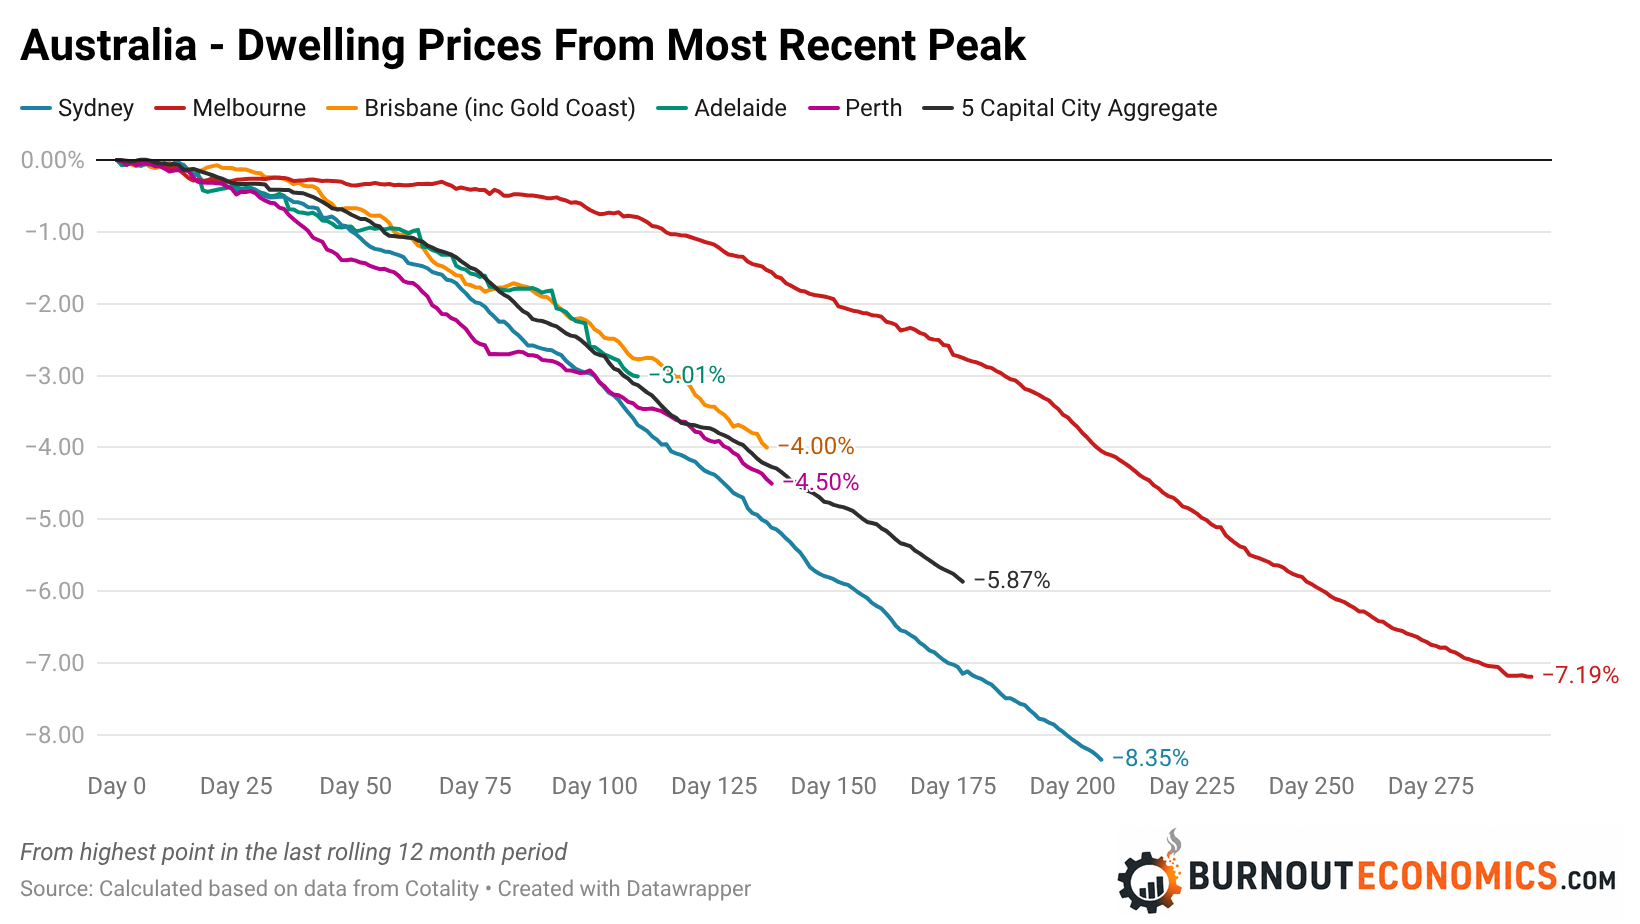
It’s here that we encounter a problem: are housing prices down by 5.9% at a five-capital aggregate level? Or is it actually more? Potentially significantly more?
Due to the impact of revisions to the Cotality Daily Index, the magnitude of housing price falls has been significantly greater than initially believed, and improvements in the path of price falls that some commentators have based more positive outlooks on have, in time, been revealed to never have existed at all.
In order to quantify this, I have taken two random dates and the latest figures, which cover up to yesterday.
Prior to the start of May, the random data points, which are the 17th of July and 17th of August, perform very similarly to the latest data.
But the closer the data gets toward the present, the more divergent they become.
Take the 18th of June, for instance.
On a rolling 30-day basis, the figures published on 17 July had the five capital city aggregate down by 0.41%.
By the 17th of August it had fallen to a decline of 0.71%, and by the 28th of September it had been revised down to a fall of 0.86%.
Getting on for half a percent worth of revisions over just a 30-day period.
As the chart below reveals, there have been false stabilisations in the rate of price falls, only to be revealed as never real in revisions.
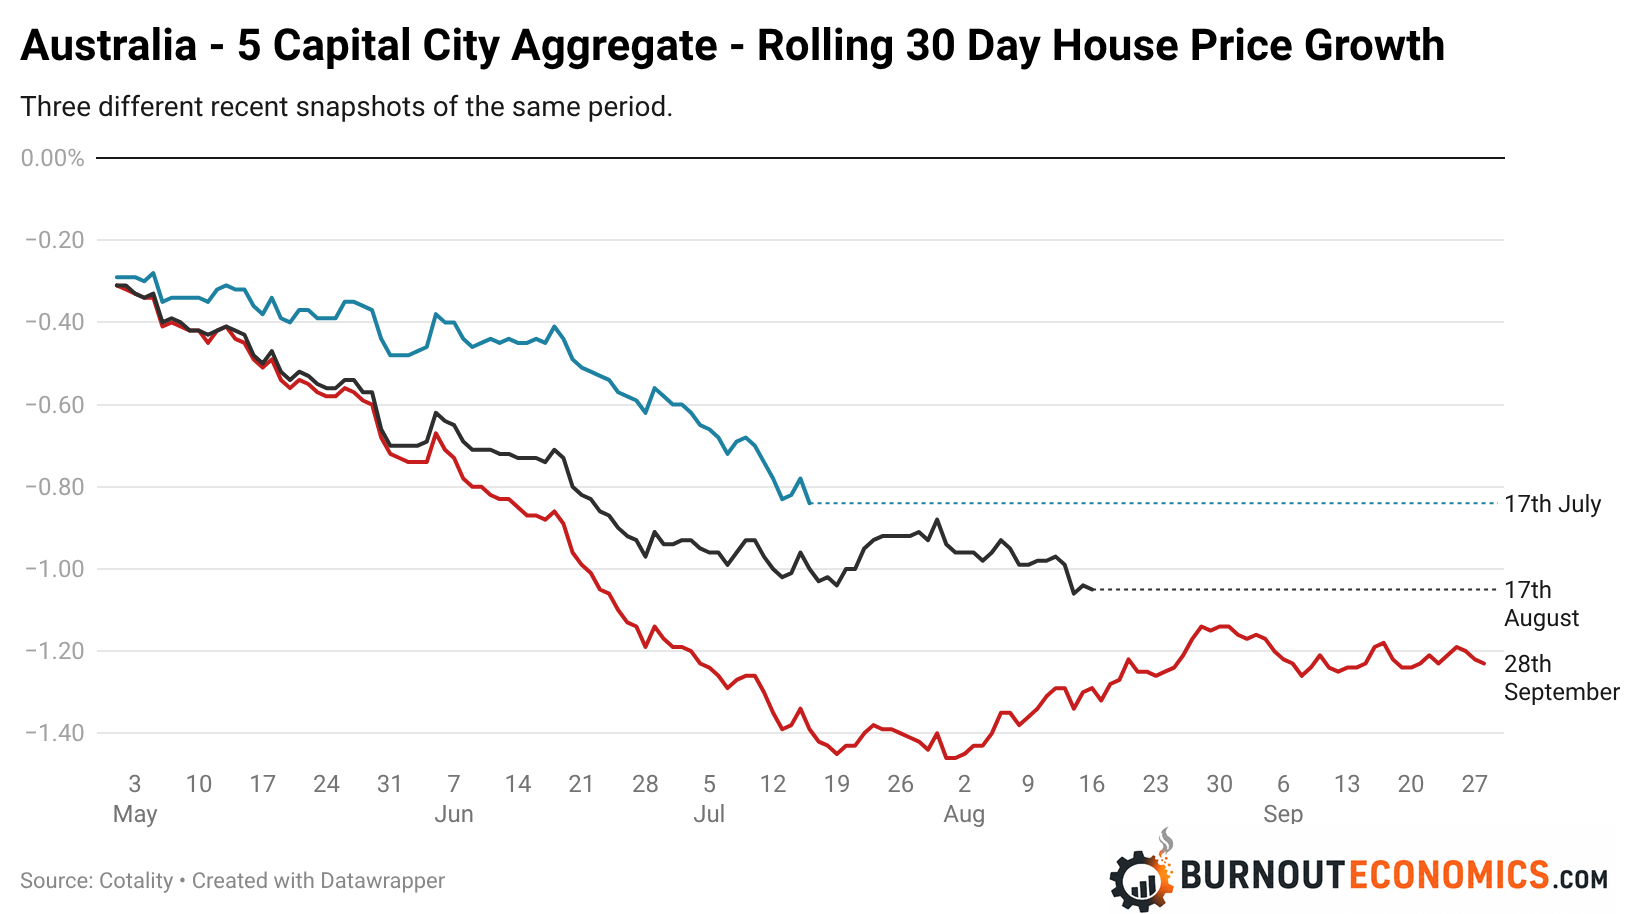
Which raises an interesting question: to what degree is the recent improvement in the rate of price falls seen from early August real? Or will revisions reveal it as a false dawn as early as Cotality’s monthly update on Thursday?
The Takeaway
To be clear, this is not a shot at Cotality or any other housing price data provider; they are doing the best they can with the tools they have.
But the data does show that in a falling market, things may be worse than they appear.
That being said, if things were to somehow improve due to a powerful catalyst, it’s possible that it could also mask an improving market.
Ultimately, if the recent trend of significant revisions with the completed monthly data continues, the deterioration in housing prices may be more significant than it currently appears.
