
As price falls spread to a larger and larger share of Australia’s housing markets, commentary continues that the nation could see the largest housing price falls on record.
Perhaps one of the most notable sources of housing price data comes from Cotality, which has analysed housing price data going back well over 40 years.
And it wouldn’t take too much further downside for the current price correction to become the largest since those records began.
The largest price correction on their books at the capital-city level is a little over 8%.
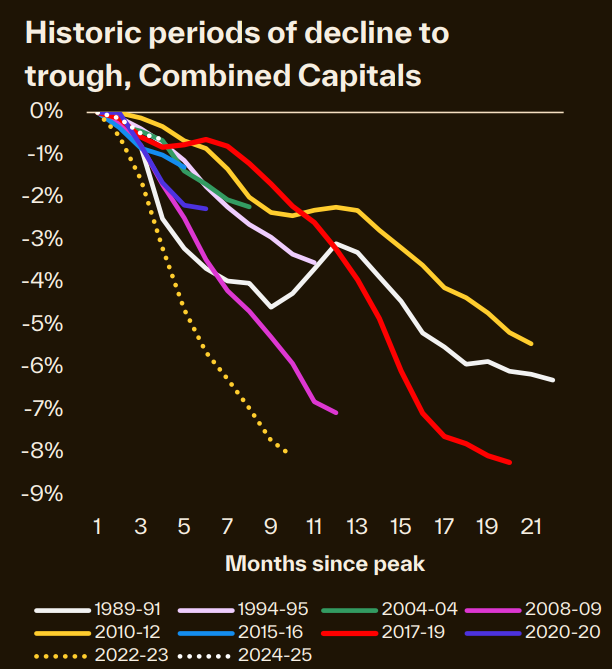
Source: Cotality
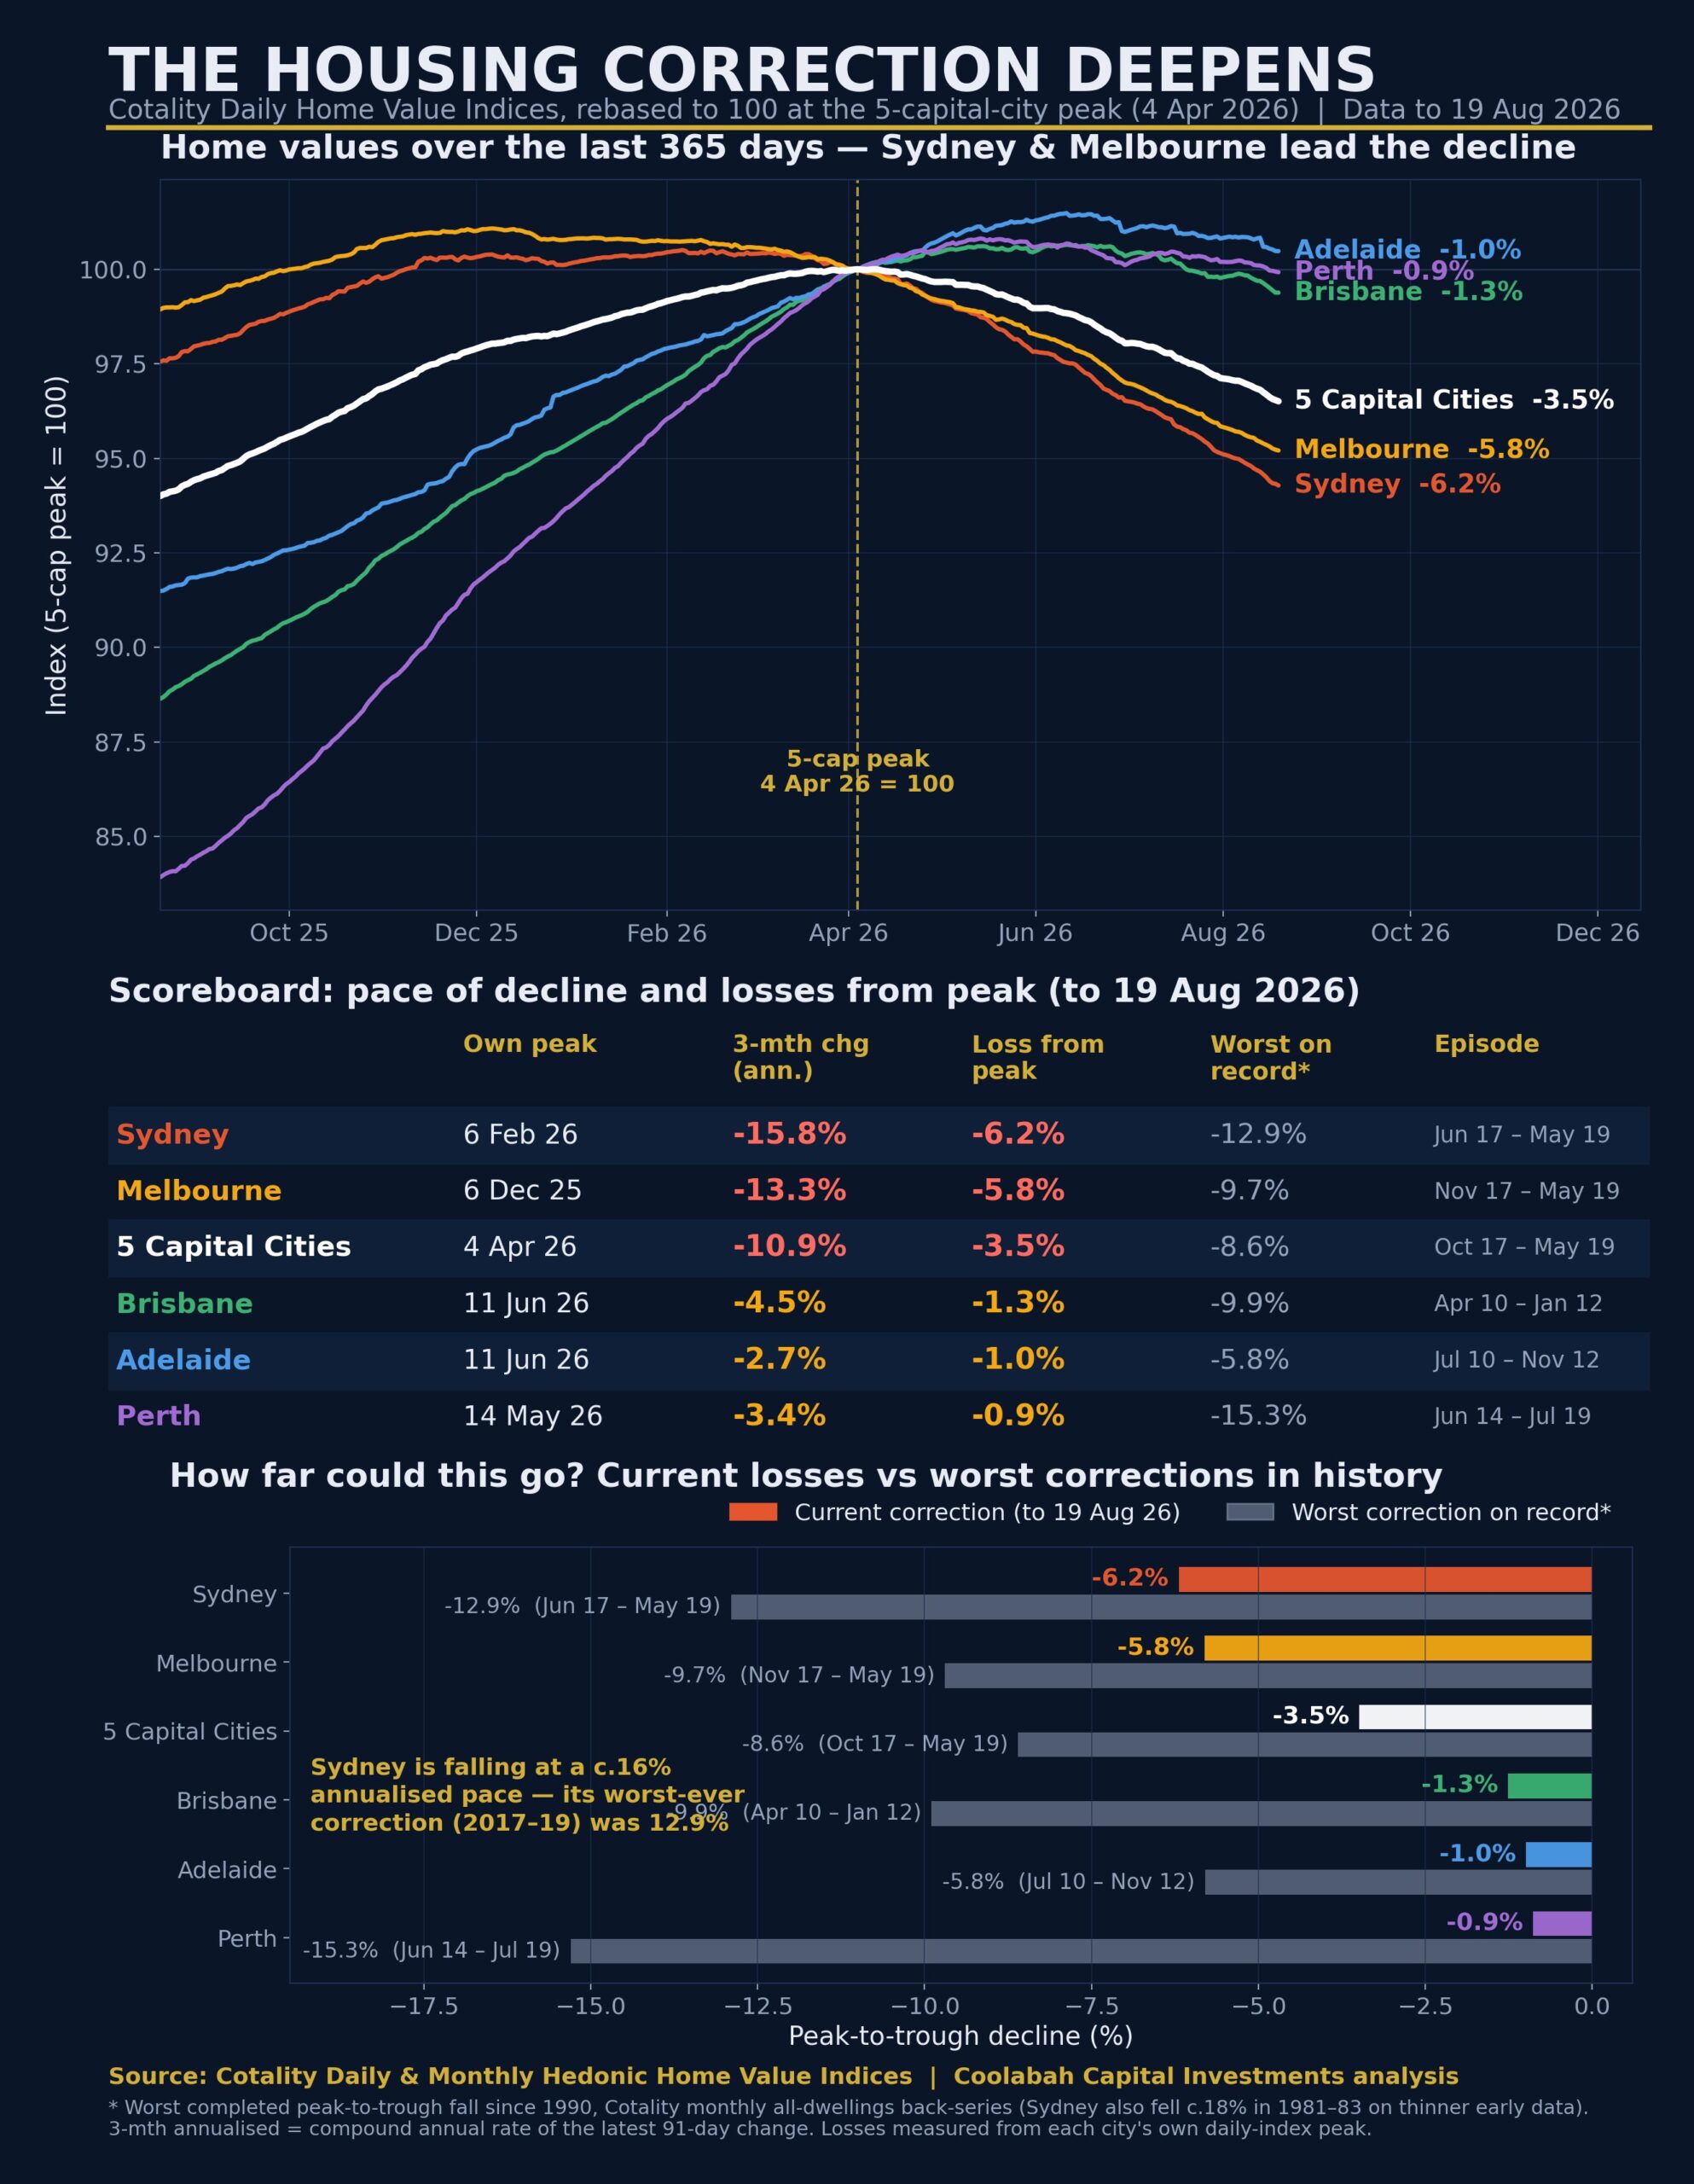
According to the Cotality Daily Housing Price Index, the five-capital-city average dwelling price index has fallen by 3.5% since its recent peak.
The worst-performing market is Sydney, where prices are down 6.2%, while Perth is the standout performer at the other end of the spectrum, down just 0.9%.
A recent analysis by Coolabah Capital Portfolio Manager Christopher Joye suggests that 4 out of 5 of the nation’s largest capital cities have experienced larger price falls than the capital city average, with the difference being timing.
According to Joye’s analysis, Sydney’s worst price correction occurred between June 2017 and May 2019, where dwelling prices fell by 12.9%.
For Melbourne, the largest cycle falls occurred between November 2017 and May 2019, with dwelling prices down 9.7%.
Brisbane’s worst-performing period came between April 2010 and June 2012, with prices down 9.9%.
Adelaide has seen by far the smallest historic price falls on record, likely due to the fact that prior to the current cycle it held some of the lowest-priced capital city real estate in the country, with its largest price falls just 5.8% between July 2010 and November 2012.
The largest price falls on this record are held by Perth, where prices fell by 15.3% between June 2014 and July 2019.
Graphic: Christopher Joye
The Takeaway
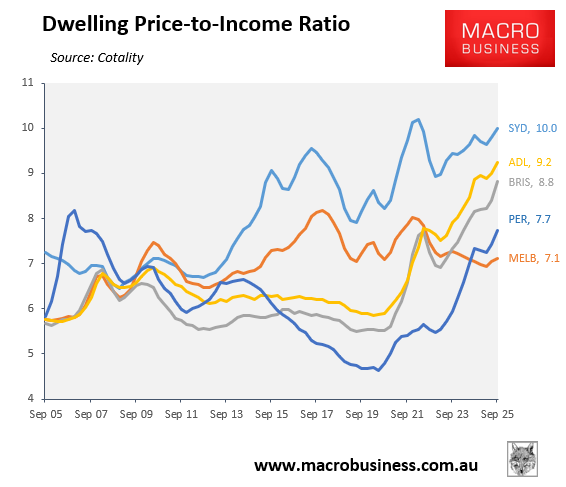
Amidst the most expensive and least affordable housing market in Australian history, it’s not hard to imagine new downside records being hit in the months and years ahead.
But like every other cycle on record, policymakers will play a major role; after all, look at the dates on Christopher Joye’s graphic.
Sydney and Melbourne both bottomed out in the month of the 2019 election after it became clear that a Coalition government much more friendly to retaining property investor tax concessions would remain in power, and interest rates were cut by the RBA the very next month.
It’s a similar story for Perth, with prices bottoming just two months after the 2019 election and one month after the RBA began a rate-cut cycle.
Meanwhile, Brisbane and Adelaide both saw the bottom in their respective largest price corrections during the RBA’s November 2011 to August 2013 rate-cut cycle, which slashed the cash rate by almost half (4.75% to 2.5%), the lowest cash rate in Australian history at the time.
In 2026, things are arguably different, at least for a time.
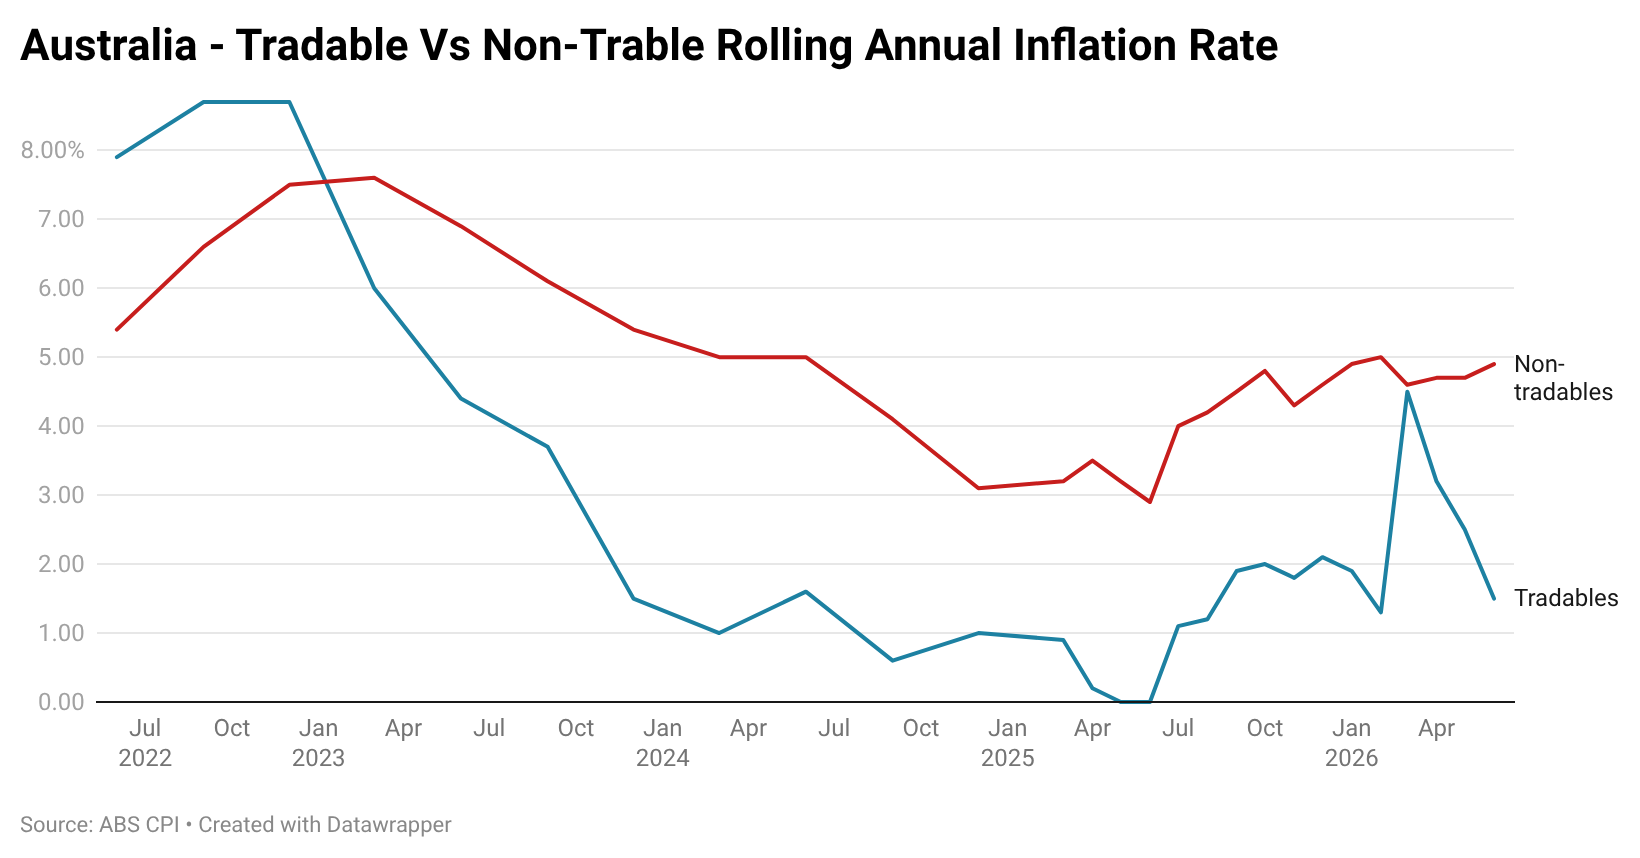
The RBA’s hands are at least temporarily tied by domestically driven (non-tradable, aka goods and services not imported to Australia) inflation pushing towards 5% and the expectation that the midpoint of their target range will not be hit until 2028.
Meanwhile, the Albanese government faces a deteriorating fiscal path amidst cost blowouts in major projects and policies.
In my discussions with property experts, there remains the expectation that intervention will still come if prices fall far enough, but what “far enough” is remains an open question.
