
In the years since the pandemic first arrived on Australia’s shores, there has been an often forgotten factor boosting the fortunes of the housing market: far less stock on the market for sale.
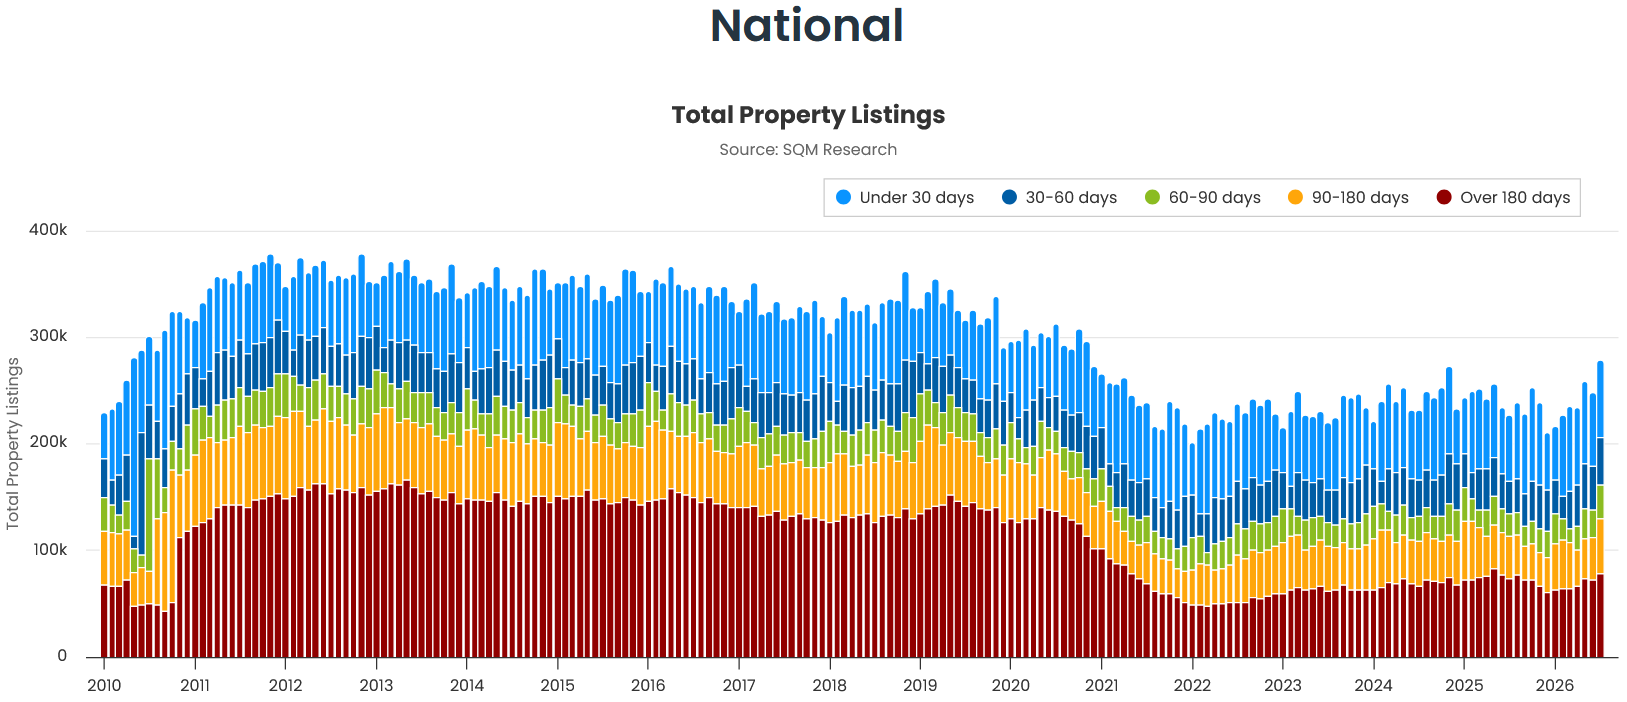
According to figures from SQM Research, total housing stock on the market at a national level remains well below normal levels for this time of year compared with pre-pandemic norms.
Adjust the figure for growth in the population and housing stock in the more than 6 years that have gone by since the start of the pandemic, the picture becomes even less favourable.
Source: SQM Research
But in recent months the winds within the housing market have begun to change.
In the words of Westpac Chief Economist Luci Ellis in a recent note:
“Turnover has declined sharply in most jurisdictions, and while new listings are also starting to move lower, they are falling more slowly than sales. As a result, stock on market is rising relative to the flow of sales and turning established housing into more of a “buyer’s market”.”
This fall off in turnover has had the side effect of overall listing volumes rising even amidst seasonality that would not ordinarily be favourable to that outcome.
In the words of SQM Research Managing Director Louis Christopher:
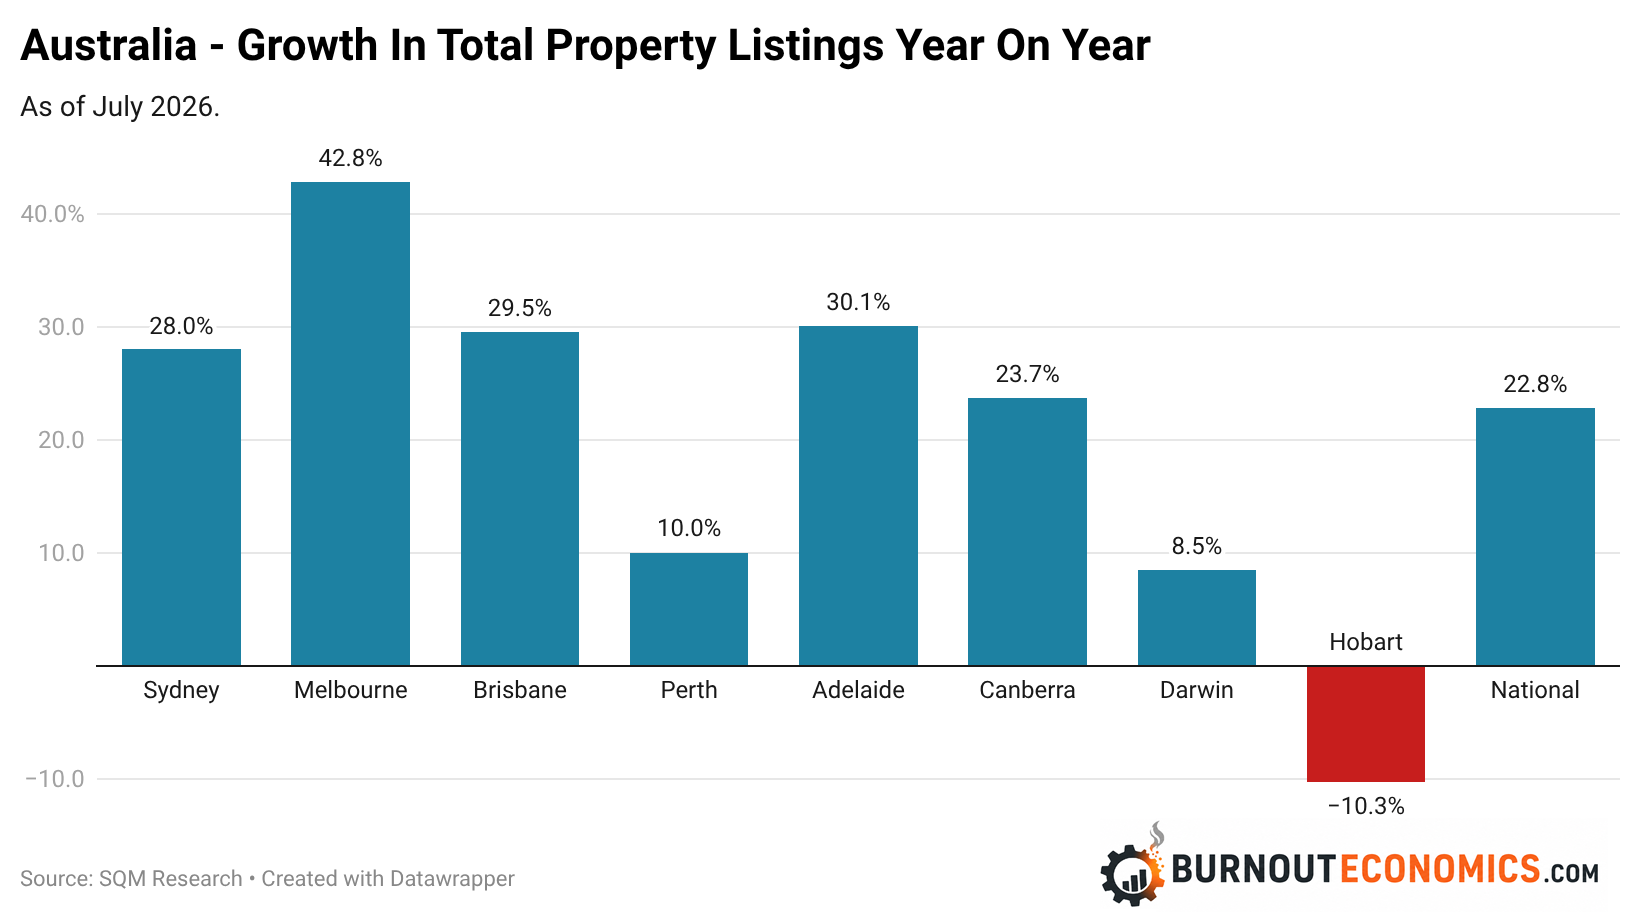
“July’s figures mark a significant shift in market conditions. National listing levels are now almost 23 per cent higher than they were a year ago, giving buyers considerably more choice than they have had for some time.
This rise is rather abnormal as July tends to record a lull in listings due to the winter period.
But not this year. No, Listings are firmly up across the board.
What’s particularly noteworthy is that we’re seeing increases in both new listings and older listings. More properties are coming onto the market, but they’re also taking longer to sell. This is the typical read you see in housing market downturns – listings start piling up upon each other.”
By capital city the largest increases in listings occurred in Melbourne up by 42.8% year on year, followed by Adelaide up by 30.1% and Brisbane up 29.5%.
The current state of listing volumes varies dramatically across the different state capitals and regional areas.
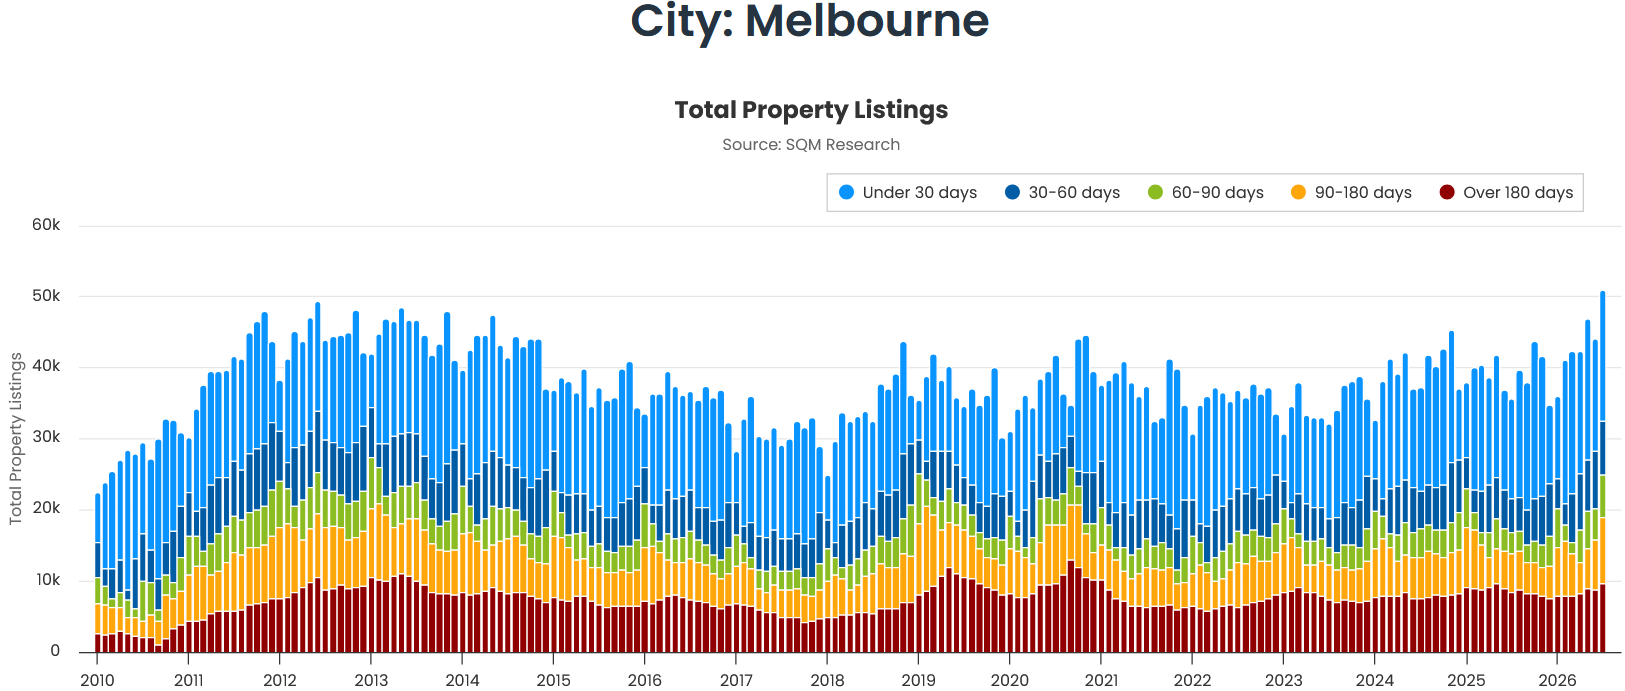
For example, in Melbourne total property listings have hit the highest level since SQM’s records began in 2010.
Source: SQM Research
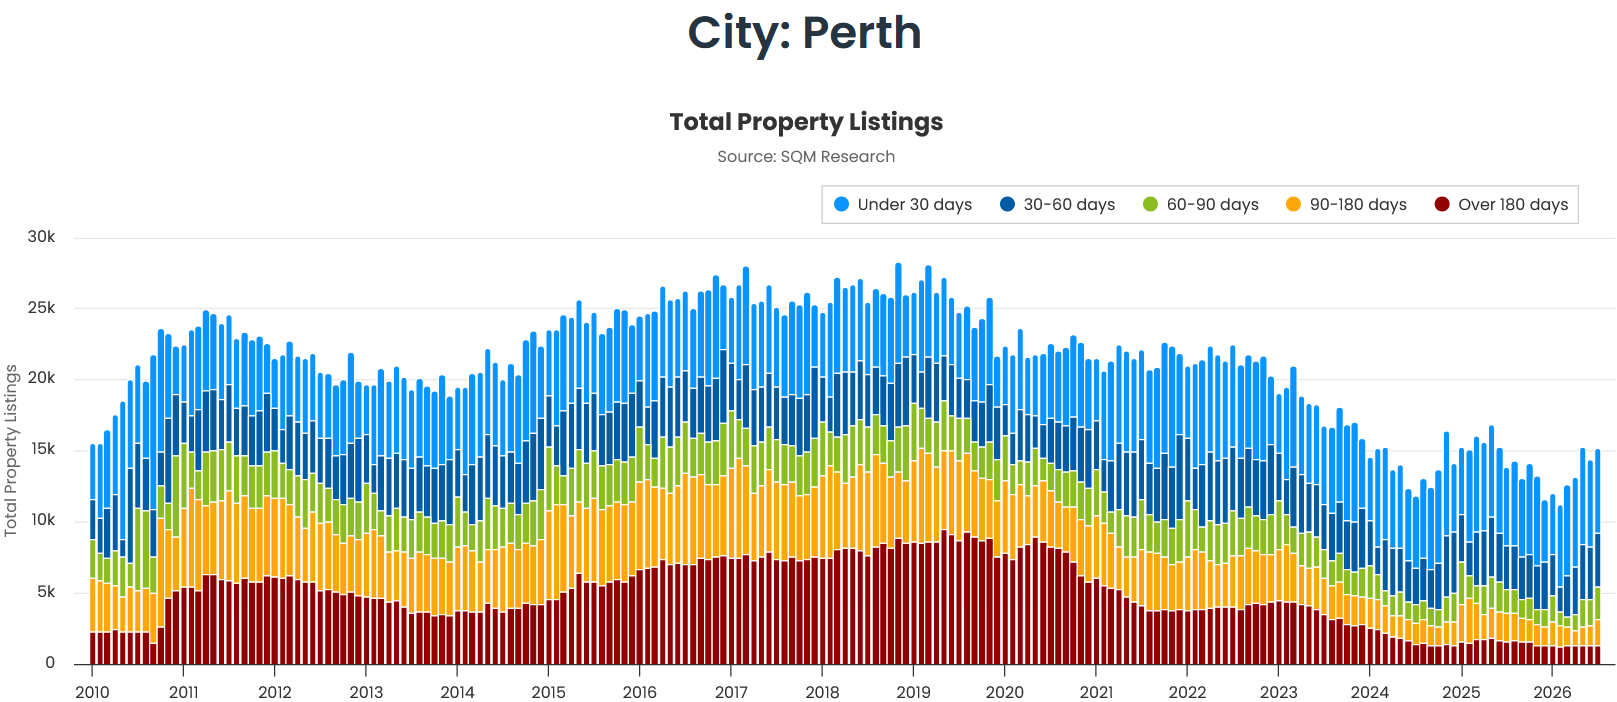
On the other hand total listing volumes in Perth are still below where they were during much of 2025.
The Takeaway
For more than 6 years, falling and then depressed levels of stock on the market have been a largely silent driver of housing price growth, pouring additional fuel on what was an already roaring fire.
But that boost is now drawing to a close in some locales and flat out reversing in others.
The longer listings continue to rise and the more stock piles up on the market, the more challenging a swift bounce back in prices without some sort of external catalyst becomes.
Ultimately, times are swiftly changing for the Australian property market. Where that will truly end, no one knows.
