
In trading, comprehending price action patterns on the silver charts is essential. Silver has gained a bit of a bad reputation among the commodity traders for being unpredictable. Prices may change dramatically and rapidly, reacting to wide-ranging factors such as changes in industrial demand, currency fluctuations, and overall macroeconomic market sentiment. Among the more direct ways to interpret what a chart is saying is price action analysis.
Instead of adding on more indicators, price action trading is simply about looking at the movement of the price itself: the shape of the individual candles, the market’s response to a specific price level, and the patterns that form as a result of the price action over time. For novice and intermediate traders, learning to identify patterns can help traders better understand chart structure. Admittedly, it’s a bit of a cop-out since trading it is different to just spotting it, but it is a fair start.
What Makes Silver Charts Worth Studying
In order to be able to analyse the silver price action to any degree, it is beneficial to first understand what is causing the price action to occur in the first place. In 2023, silver demand from the industry was at an all-time high, with the PV industry being a significant and rising demand segment. That demand structure also affects how and why the silver price consolidates, breaks out and retraces, often in a way that can be seen on a chart without any indicator overlay.
If you’re one of those traders who are active on the market, you can also see the silver rate today in several time frames to see how a pattern is building. Silver is very fast-moving, and what may appear to be a clean breakout at one moment may reverse in a few minutes, so time frame selection and real-time awareness are extremely important.
Two Sides of Silver Demand
Silver is a metal that is used in industry and a financial asset, so it is a bit of a different trading playground than other commodities. Silver can also see a decline during times of caution when risk appetite declines. As inflation fears grow, it can soar alongside gold. This combination of two sensitivities also contributes to the fact that the price action of silver can change in character as these two factors are either in play or not at any given moment, making the analysis of its movements a bit more complicated than that of a commodity that has only a single demand driver.
Volatility and Its Effect on Patterns
The percentage change in the value of silver is always greater than that of gold. That attribute makes chart patterns more noticeable but also more prone to breaking down. Tidy formation in a less volatile market can complicate things in any unpredictable way in silver. This does not mean that pattern analysis is useless – it simply means that it is important to understand that patterns in isolation should not be seen as sure trades.
Core Price Action Patterns in Silver Charts
Silver price action analysis is based on a series of patterns that are repeated over various time frames and market conditions. Since each pattern corresponds to a specific logical statement, it is more helpful and useful to understand what each pattern means and how far the interpretation goes than to memorise its visual appearance.
It also merits a reminder upfront that patterns will be more significant when they form at significant price levels or when they fit into the overall market structure than when they form in the middle of a featureless price range.
Candlestick Formations
Price action analysis is based on candlestick patterns. Each candle represents a defined time period and displays four important data points: the open, high, low and close. There are a number of formations that can be identified in silver charts often enough to be worthy of attention:
- Doji candles: The open and close prices are very close together, forming a cross-like shape, which indicates that the market may be in a state of indecision. These frequently occur just prior to a directional move or in consolidation periods.
- Pin bars: They are a long wick with a small body, which means that the price moved towards a level before being rejected. Pin bars in key support or resistance levels are the most significant pin bars to analyse.
- Engulfing patterns: When the body of one candle engulfs the previous candle’s body. Engulfing formations, interpreted as bullish or bearish, are considered as potential reversals, especially when they appear at price extremes and not in the middle of a trend.
Candlestick patterns are typically used as a starting point for the analysis and not as an individual signal. It is important to consider where they fit into the overall price framework.
Support and Resistance Levels
Support and resistance are price levels at which significant buying or selling has occurred in the past that have hindered or reversed a trend. These zones are more often seen around previous highs and lows, round-number support and resistance points, and areas that have undergone several reversals over a longer time frame in silver.
One of the difficulties with silver is that these spikes can occur temporarily, driven by news and the price can then come back down to the previous range. It is important to note that relying solely on the arrival of a break of support or resistance is not enough to conclude a move; one must wait to see if prices continue to test the level and move in the anticipated direction.
Trend Lines and Channel Patterns
Trend lines are a visual representation of the direction of the momentum. In an uptrend, they would be connected by a line of higher lows, or in a downtrend, by a line of lower highs. A channel is a trading pattern that forms between two parallel trend lines when the price action is moving between them.
The silver channels are well defined on the daily and weekly charts, and with the tendency of silver to see price spikes, the trend lines are broken and redrawn more often than it is in less active markets. It is important to be aware that a single powerful session can negate a trend line that has been in place for several weeks.
Reversal Patterns
Reversal patterns indicate that an existing trend may be weakening. The most frequently reported in the silver analysis are:
- Head and shoulders: Three peaks with the middle peak higher than the other two peaks. It is usually interpreted as a bearish reversal pattern when the price falls below the neckline, after an uptrend. The inverse formation is used after a downtrend.
- Double tops and double bottoms: two tries to close above/below the same price level, which means that momentum in that direction has stalled. D.B.’s often manifest themselves during corrective phases after large drops in silver.
The problem with reversals is that they appear a lot neater on the charts than when they are actually happening. On an incomplete pattern, there’s more uncertainty than it would seem when looking at the charts.
Continuation Patterns
Continuation patterns indicate that the trend is taking a short break before it continues, not reverses. These are especially important in silver, as this metal tends to move in big and strong directional moves with brief consolidation periods.
- Flags and Pennants: Sharp move in the direction and tight, neat consolidation. Flags are set up in a slight counter-trend channel and pennants in a symmetrical taper. Both usually are patterns sometimes interpreted as continuation formations, although not every one of them is when it is in the direction of the trend.
- Triangles: Price moves into a smaller range, indicating that the buying and selling forces are even. Rising lows and a flat top are considered an ascending triangle, which is generally interpreted to be a bull run, and falling highs and a flat bottom are considered a descending triangle, which is generally interpreted to be a bear run, while a symmetrical triangle is taken as a neutral movement until it breaks out.
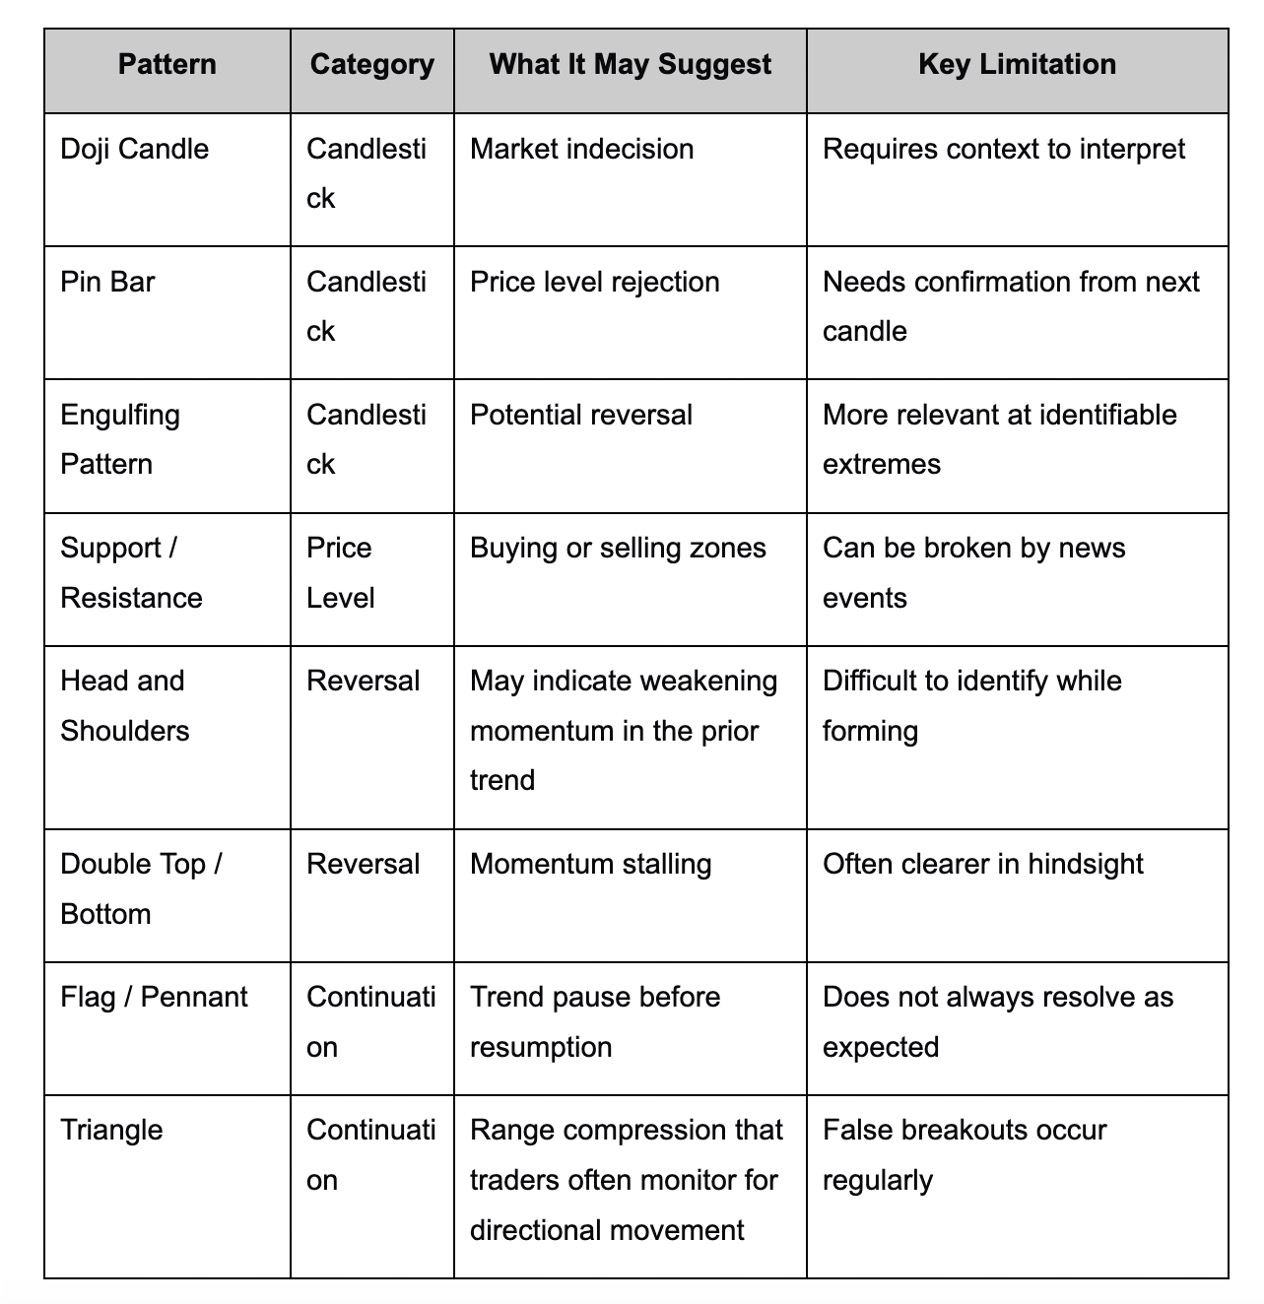
The characteristics of the patterns mentioned in this article are summarised in the table below.
Time Frames and Pattern Reliability
The time frame on which a pattern forms significantly affects how it should be interpreted. Technical analysis principles confirm that chart patterns become more reliable over longer timeframes. Large time frames remove the “noise” of the shorter time frames, revealing trend signals from the net activity of the markets.
The overall trend for silver goes like this:
- Daily and weekly charts capture the actions of a larger group of traders and are generally employed to pinpoint the general trend and key price levels.
- 4-hour and 1-hour time frames are commonly used to observe the real-time price action with respect to those levels.
- For intraday analysis, the 15-minute and lower time frames will work well but will give more false signals in the volatile silver trading market.
This is not a hierarchy; shorter time frames are not worthless, but often they are used to help determine a longer time frame context. But the smaller the interval, the less consistent the information of the patterns, and the effect is enhanced by the volatility of silver.
Limitations of Price Action Analysis in Silver
While price action analysis is a legitimate technique, it is vital to comprehend its limitations. Academic tests of technical trading reveal that chart patterns work in trending markets in an out-of-sample fashion but often produce false signals and have problems in range-bound markets. Silver is constantly in a state of flux between these two positions, and oftentimes, there’s no map of the change upfront.
There are a few other caveats to consider:
- Subjectivity: Two experienced traders looking at the same chart of silver may find different patterns, or they may draw the trend lines in a different place. There’s no right answer.
- Hindsight bias: When patterns occur, it is easy to see them in retrospect. A lot of what accomplishes the most in hindsight didn’t at the time.
- Exogenous events: Silver can be rattled around by geopolitical events, unexpected industrial data or comments by the central bank, none of which chart patterns can predict.
- Data variation: The price of silver is quoted in different venues, and the slight differences in the price between the platforms can create slightly different pattern formations on charts that span the same time frame.
These points are not arguments for not learning price action analysis. They’re just factors that should be considered when determining the level of interpretation confidence to be accorded to any given pattern.
Closing Perspective
Price action patterns provide traders with a framework to interpret silver charts and gain better insight into trader behavior during various phases of price action. Candlestick patterns, support and resistance levels, reversal patterns, and continuation patterns all provide additional context beyond just the price data.
Meanwhile, knowing the patterns does not mean that you have a strong technique to predict how the silver price moves. Price action is not a sole methodology to use when analysing the market, as the volatility of the metal and sensitivity to outside events, as well as the inherent subjectivity of chart analysis, mean that all it is useful for is one lens to use among several.
Disclaimer
The information provided in this article is for educational and informational purposes only. It is not financial advice, investment guidance, or a buy, sell, or hold recommendation for any financial instrument, including silver or silver-related products. Commodity trading, whether in spot markets, futures, or contracts for difference (CFD), carries significant risk of loss. CFD products are also particularly risky because of the leverage involved and may not be suitable for everyone. History does not necessarily repeat itself in the future. There is no analytics-based method or tool, even price action analysis, that can remove the risk of loss or ensure a market outcome. If you are considering any type of commodity trading activity, you should first take into consideration your financial condition, your level of experience, and your risk tolerance. Where you are not sure if trading is right for you, you should consult with an independent financial advisor in your jurisdiction who is qualified and regulated.