With the release of the most recent Newspoll revealing that support for the Coalition on primary vote has fallen behind One Nation and to its lowest level on record (i.e., 22% for One Nation vs 21% for the LNP), it’s worth exploring what demographics are shifting their vote behind Pauline Hanson.
Using granular data from the latest DemosAU polling, which produced a similar result (i.e., 23% for One Nation vs 23% for the LNP), we will be looking at the breakdown of the primary vote by gender, age, education, housing status (i.e., owner, mortgage holder, renter), income, and location (i.e., inner metro, outer metro, or regional).
To put the following numbers into perspective, One Nation secured 6.4% of the primary vote at the last election.
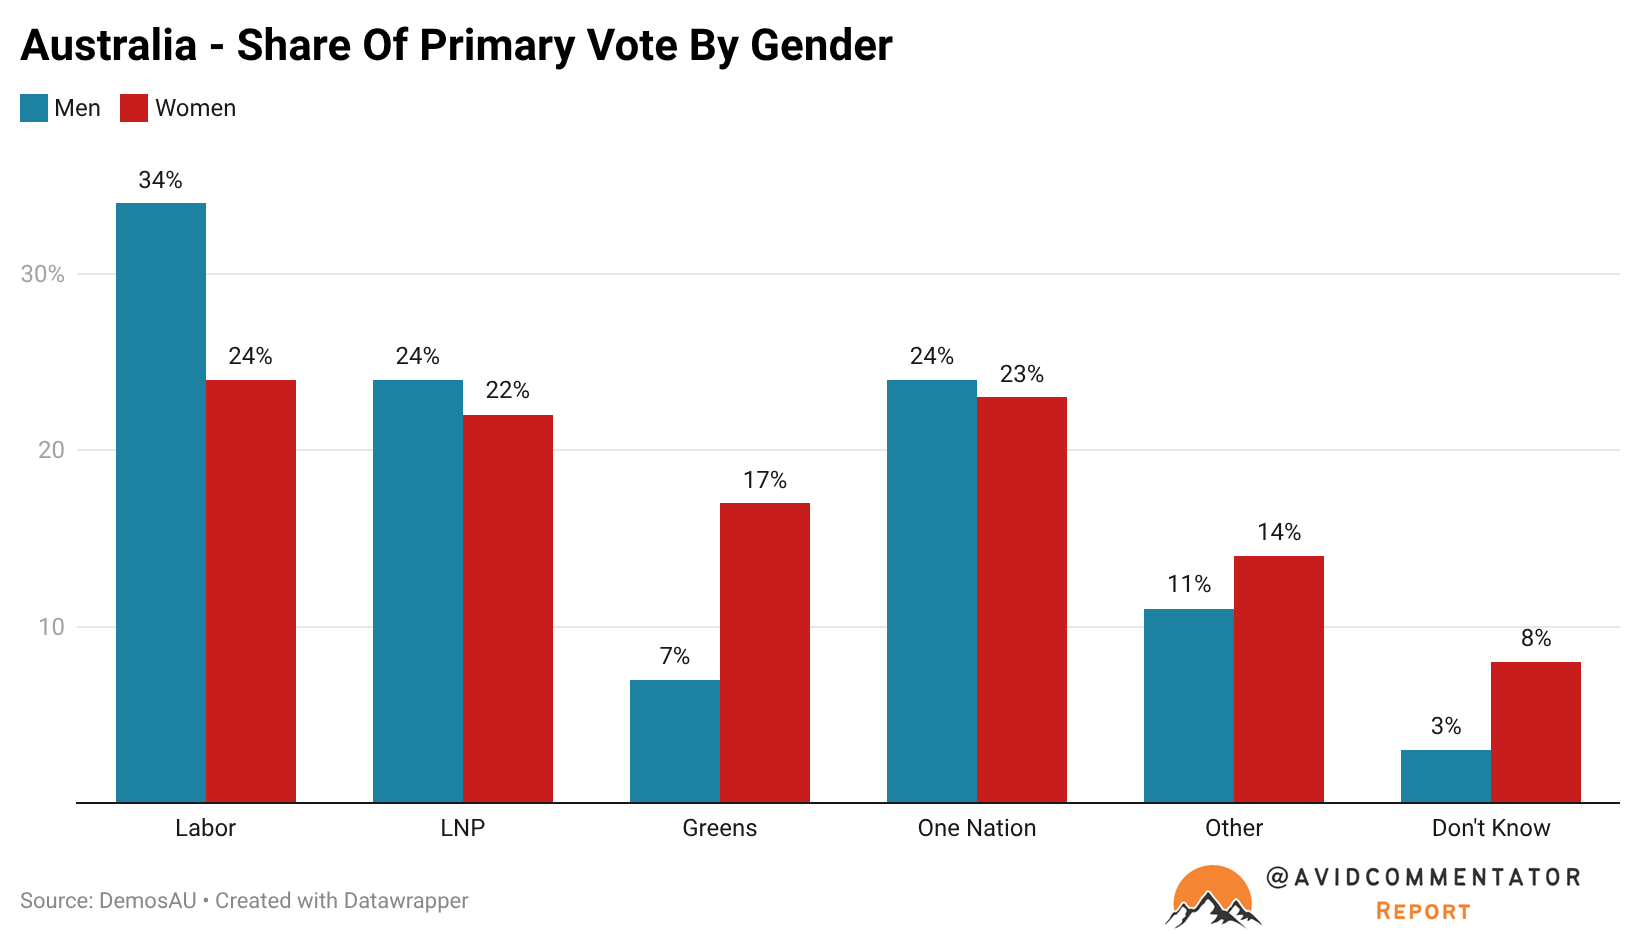
Gender
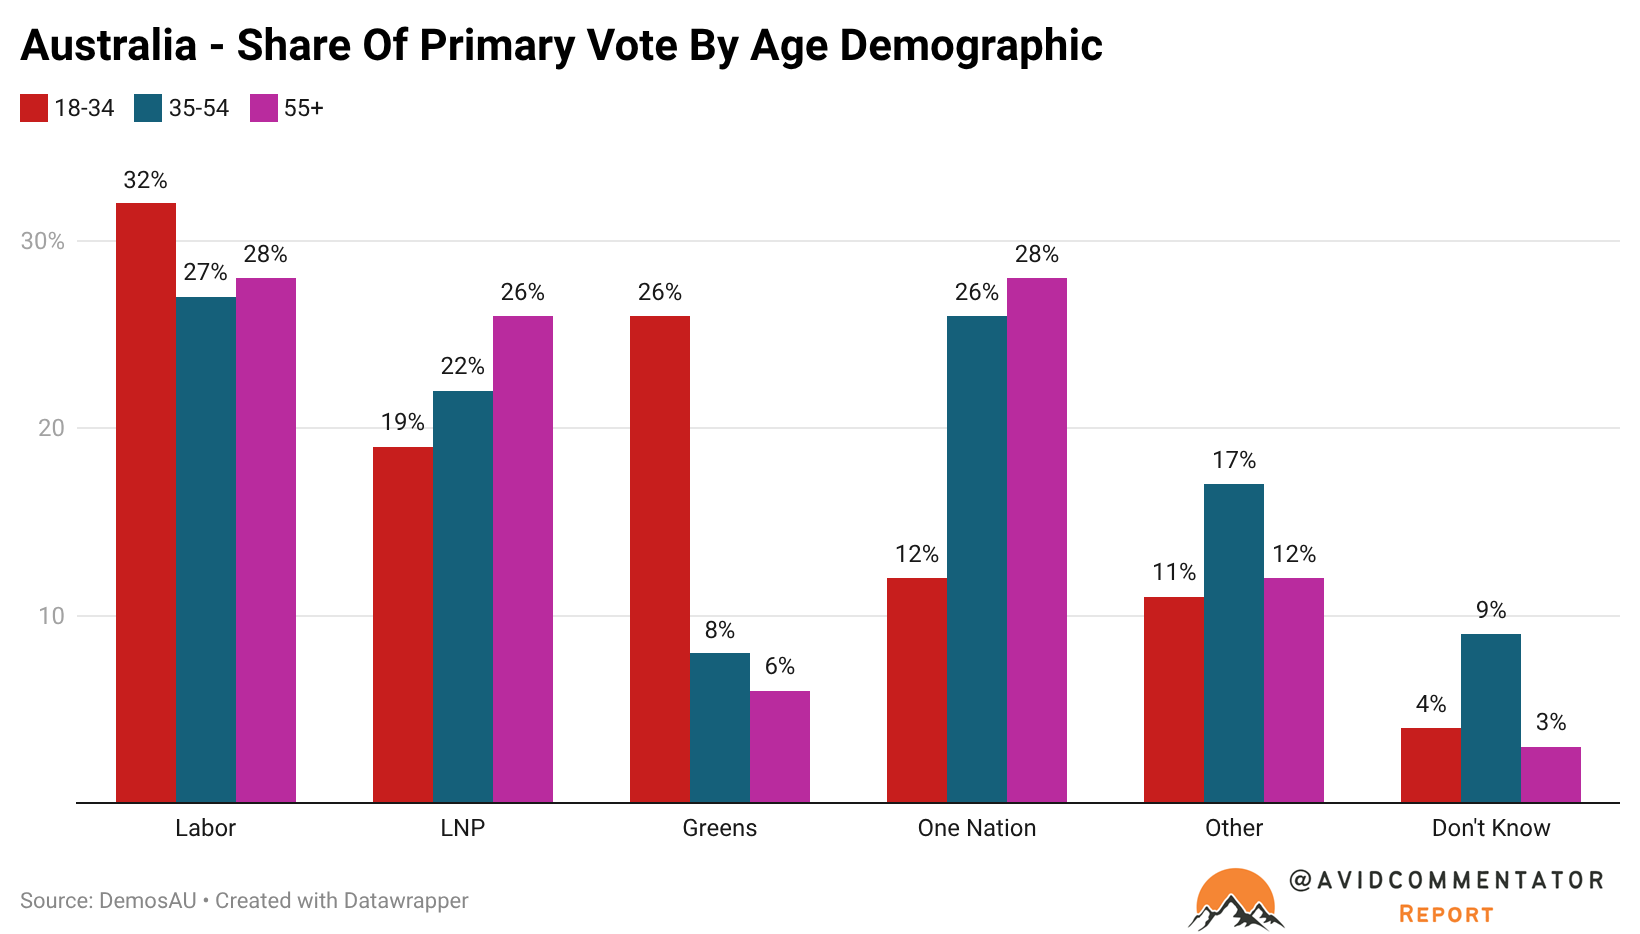
Age
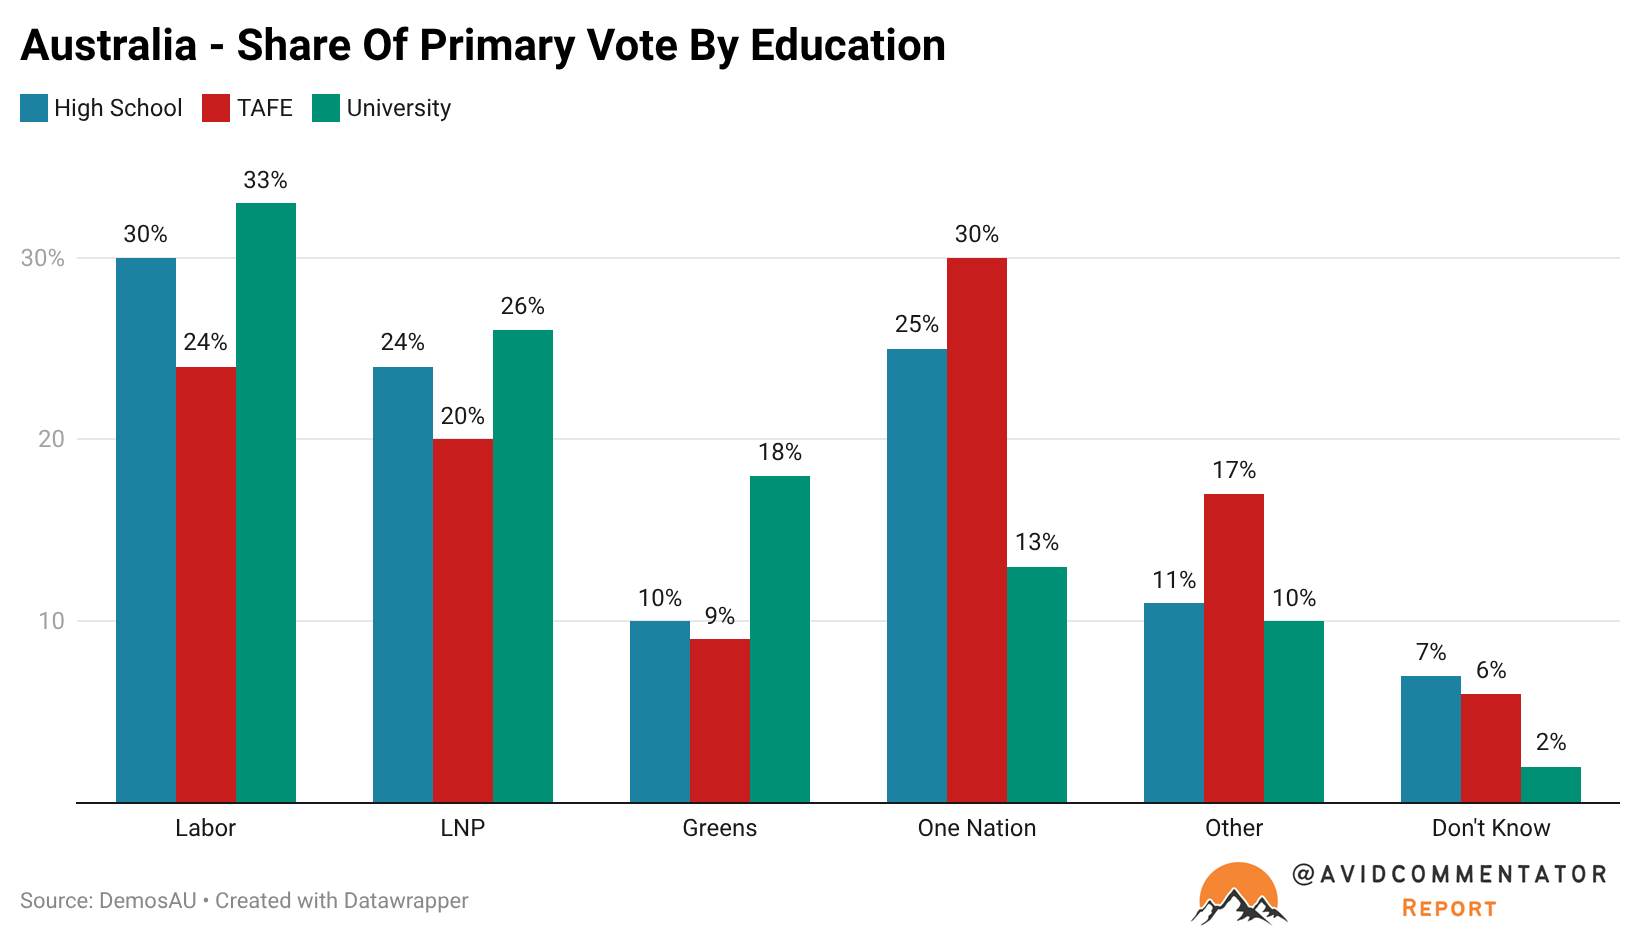
Education
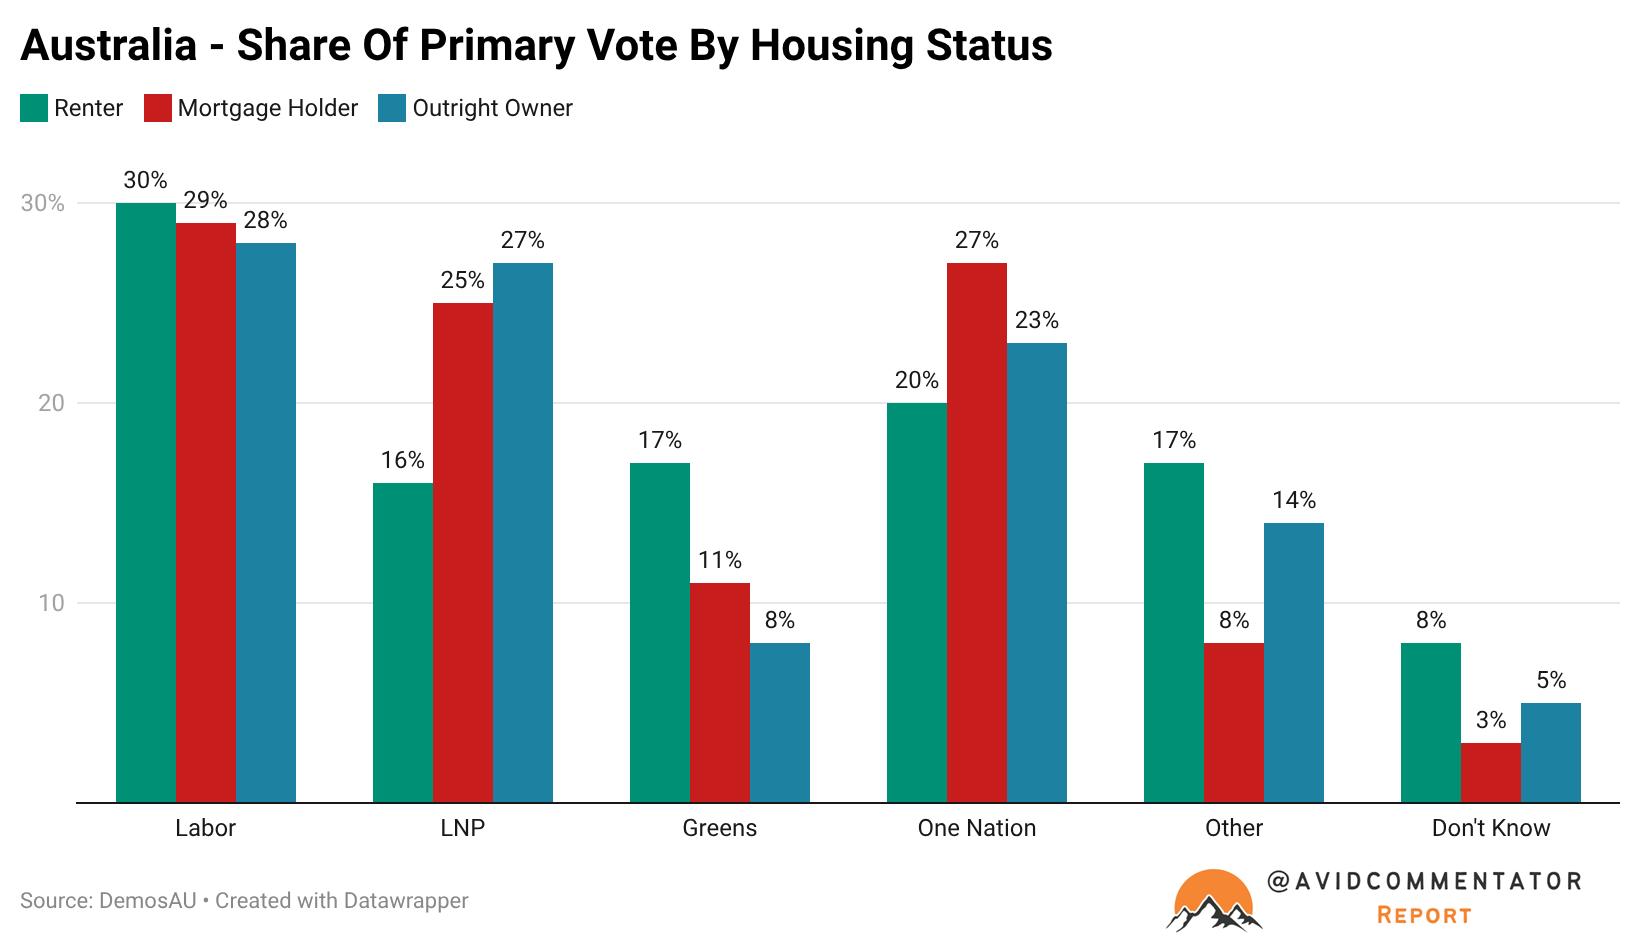
Housing Status
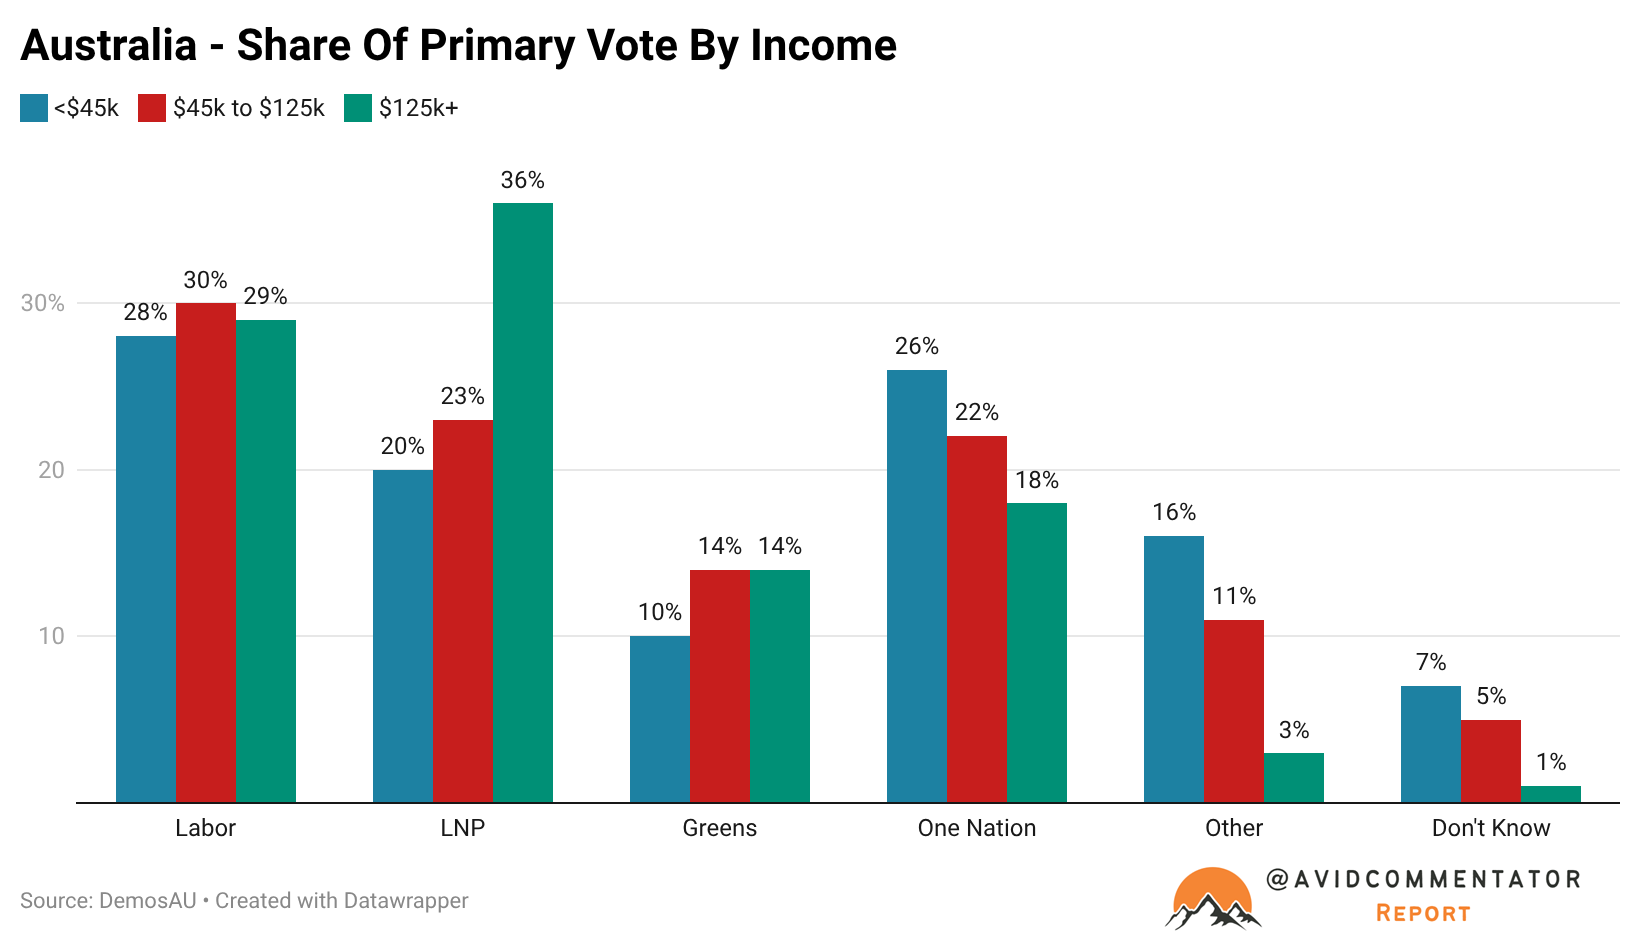
Income
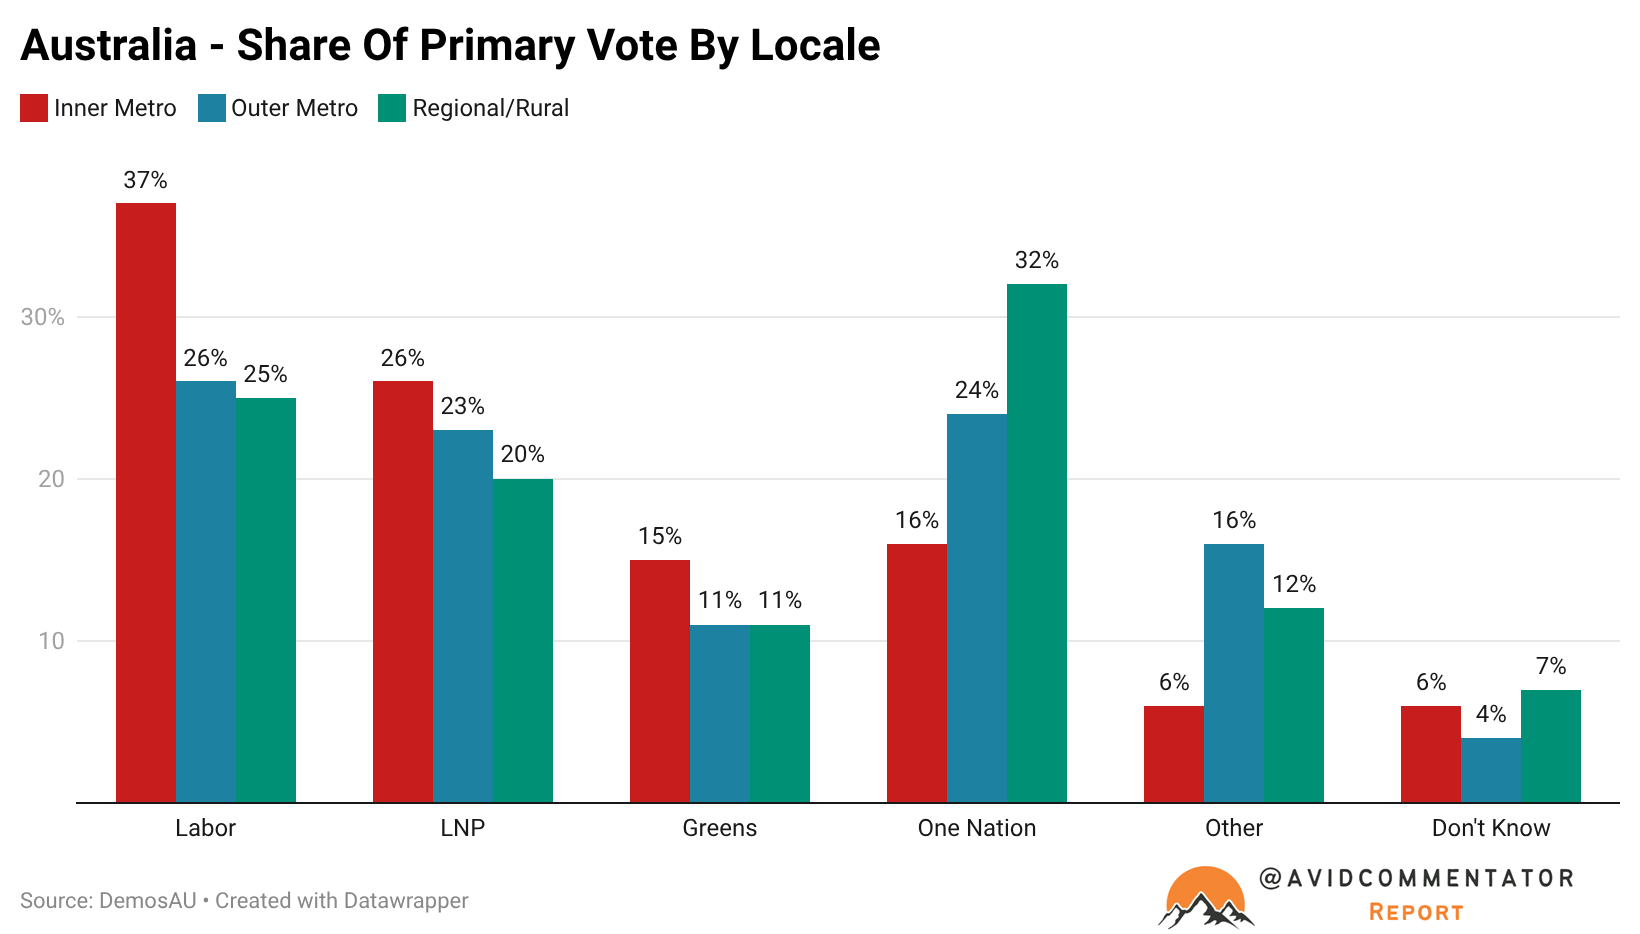
Location
The Takeaway
Overall, the granular polling reveals an increasingly broad base for One Nation across multiple demographics.
Perhaps the most notable development is that One Nation is securing just 12% of the vote of Australians aged 18 to 34.
This is a demographic where right-wing anti-high immigration parties, such as the Canadian Conservatives, have done quite well, now securing 50% of the primary vote of Canadians aged 18 to 29.
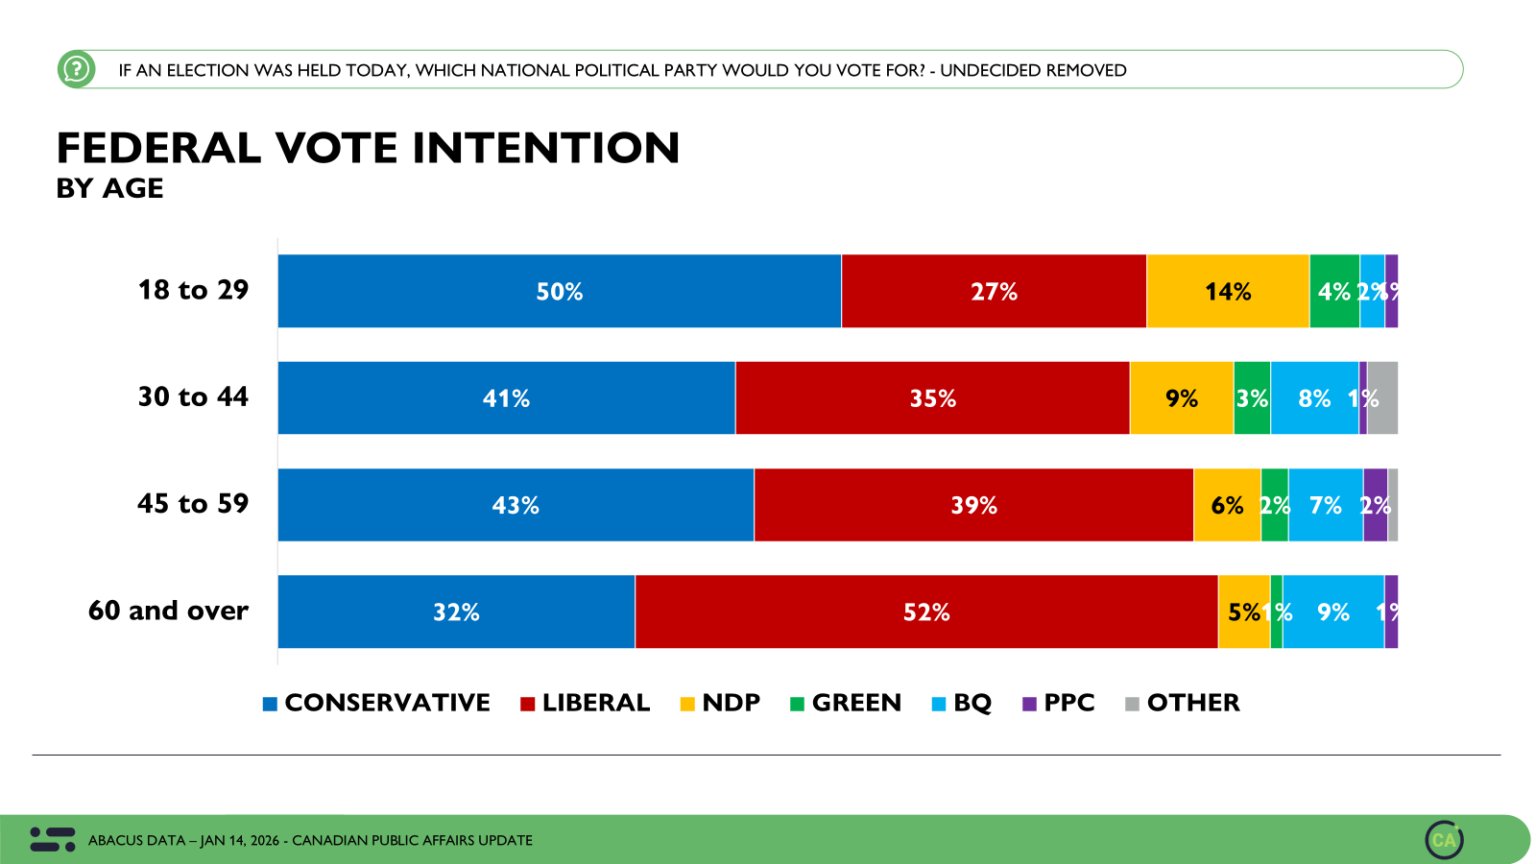
This suggests that there is theoretical potential for One Nation to make further inroads in this demographic if they make the right policy choices.
That being said, Pierre Poilievre is arguably a more appealing leader for young people to connect with than Pauline Hanson or Barnaby Joyce.
Poilievre also put in the hard yards to win the votes of young Canadians, travelling the country talking to people at their community centres and places of employment about how things must change for their generation.
Pauline Hanson, Barnaby Joyce, and One Nation are yet to put in that kind of legwork.
Ultimately, the nation’s political landscape is very much in flux and we are likely to see continued volatility in the polls for quite some time to come.
