
Economists have regularly debated the role of government as a driver of the economy since the Covid-19 pandemic.
The most common data point is the contribution of the government to overall economic activity.
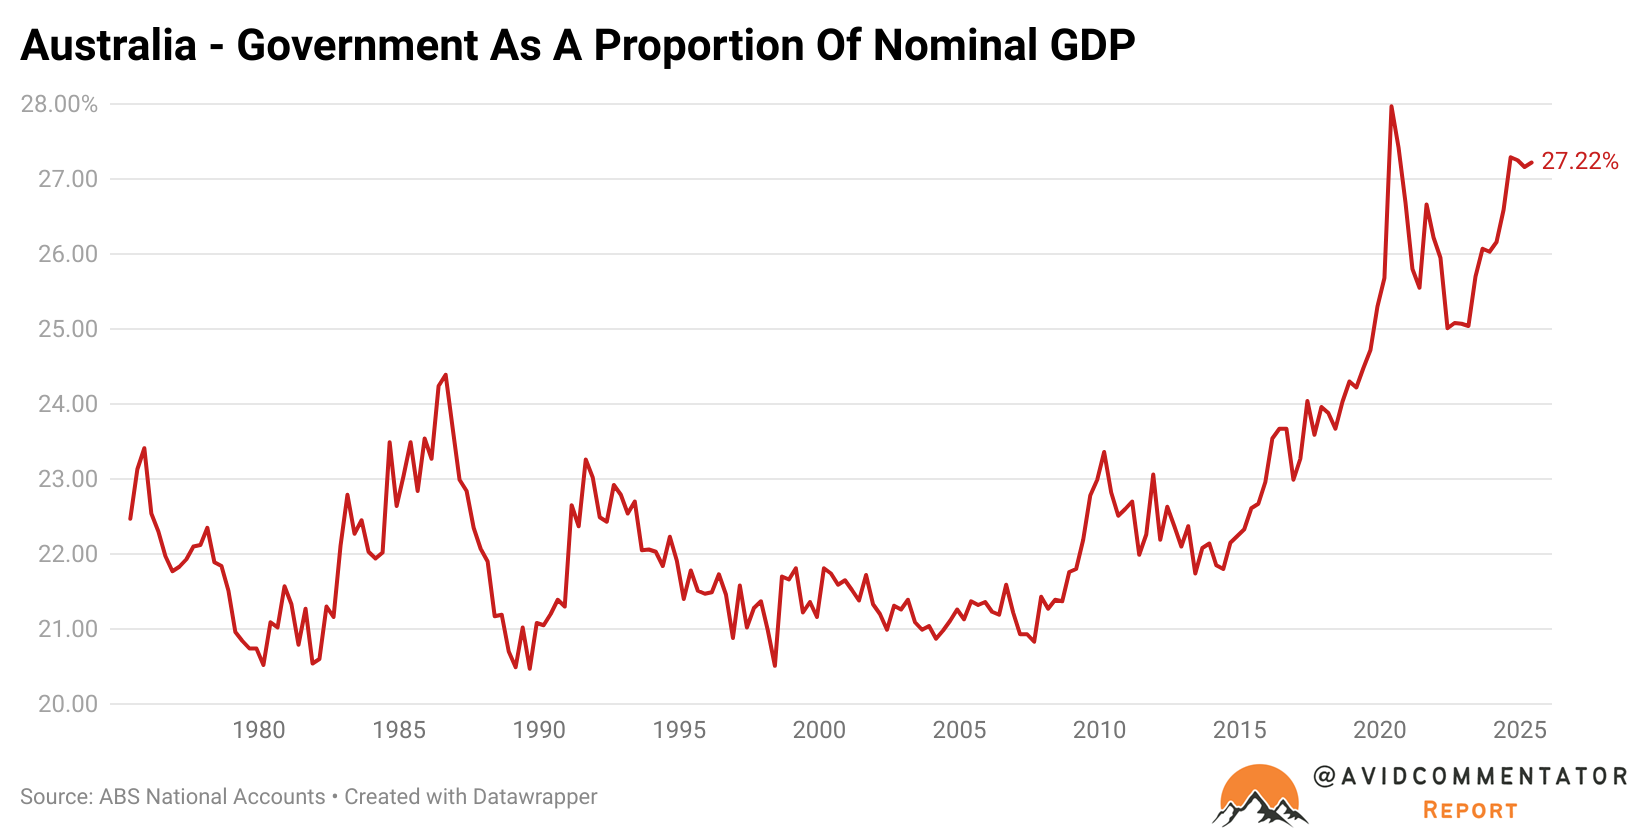
As the chart below illustrates, over most of the last 40 years, the proportion of GDP derived directly from government generally moved in a relatively contained range, reflecting the trends of government investment and economic cycles over time.
The mining boom shrank the relative impact of government on the economy. Then it began its meteoric rise.
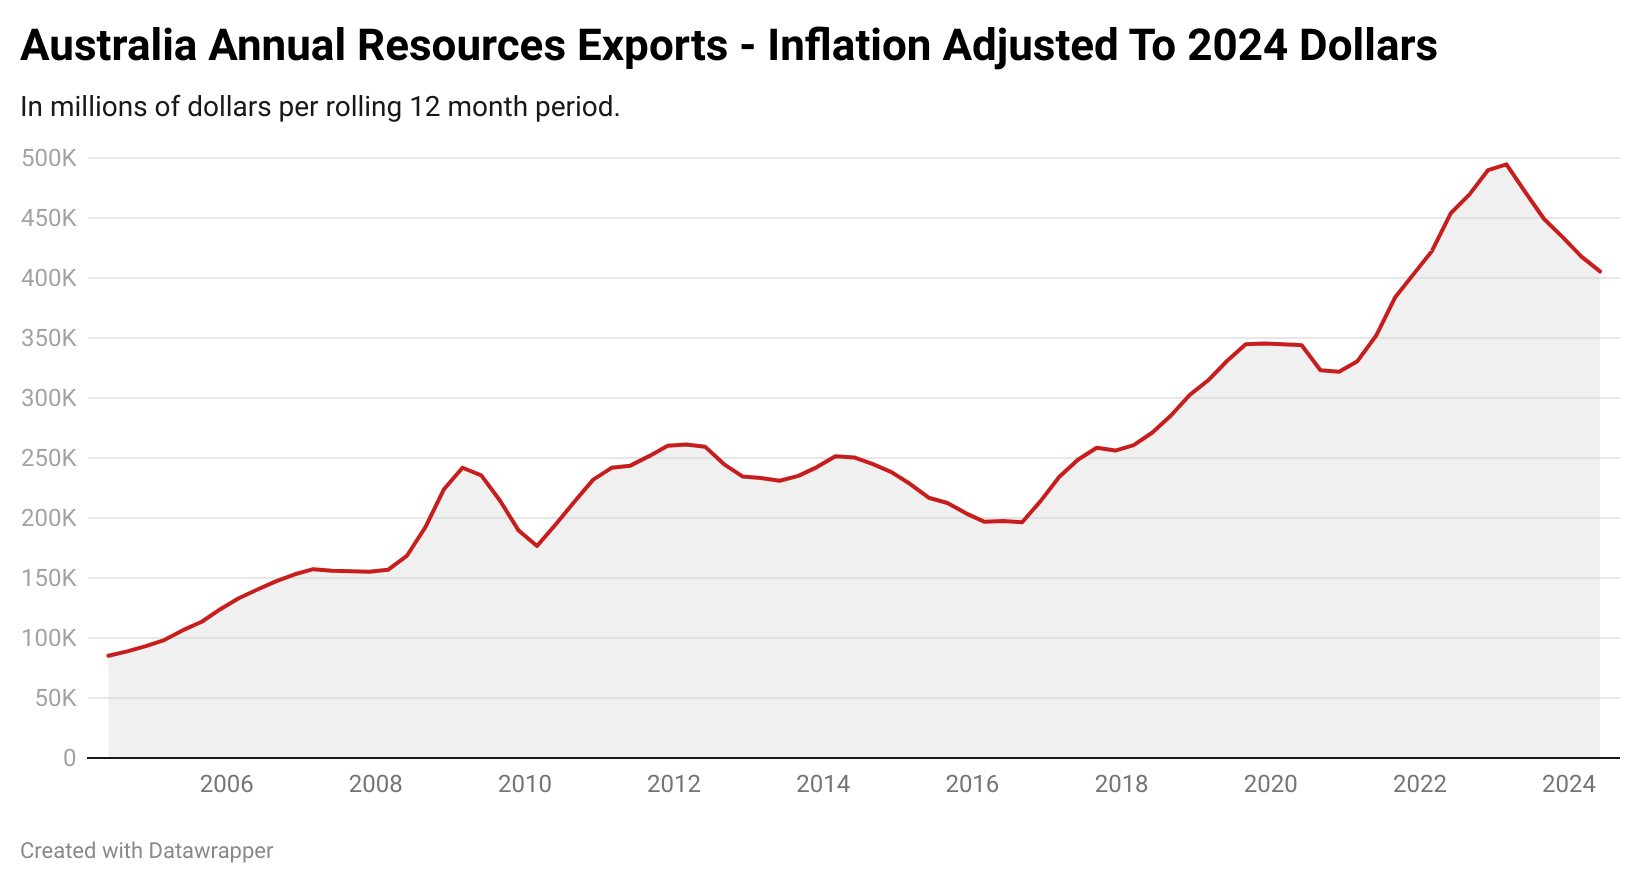
While the mining investment boom had drawn to a close, ceasing to directly boost the broader economy in the way it once did, the windfall for the federal government and the various states with sizable reserves of resources was only just beginning.
In inflation-adjusted terms, the level of resource exports on an annual basis has more than doubled since 2016.
However, while the perspective of the broad overview provides a fairly solid first-glance look at the role of government within the Australian economy, the changing nature of government investment in infrastructure and other public amenities can somewhat distort the picture.
This brings us to the chart below, which illustrates the course of day-to-day government spending across all levels of government as a proportion of GDP over the last 40 years.
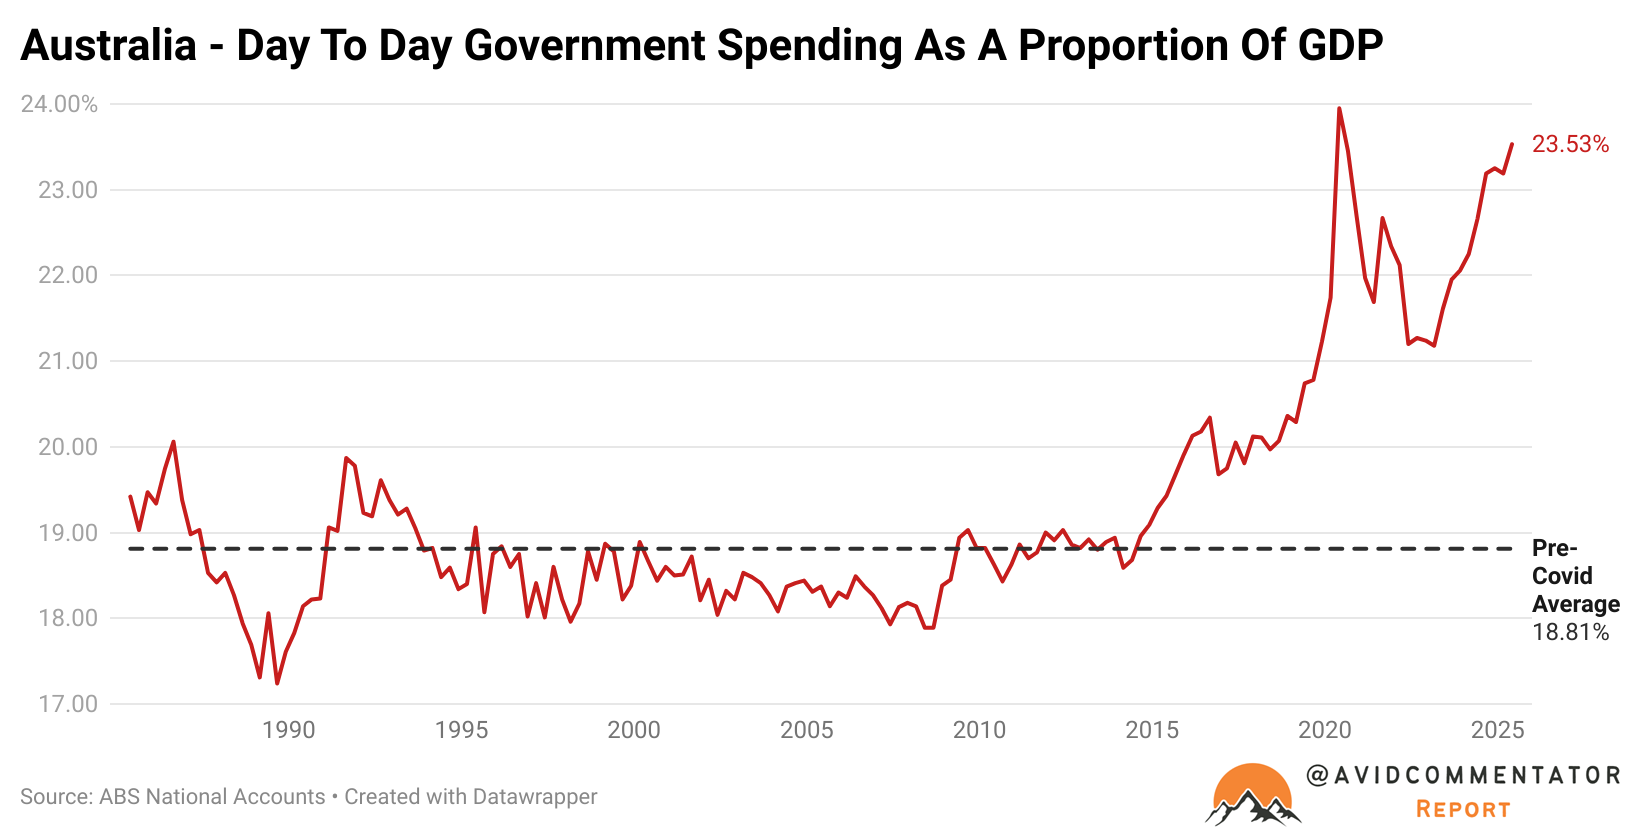
Despite recent headlines suggesting that government spending may be starting to pull back as an economic driver, this is not due to a reduction in day-to-day government spending.
Day-to-day government spending is currently at its second-highest level on record as a proportion of GDP.
Since records began in 1959, day-to-day government spending has only been a greater driver of economic activity once before, at the height of the Covid panic in the June quarter of 2020.
Meanwhile, government investment has notably decreased relative to overall GDP.
In the June quarter of 2025, overall government investment as a proportion of GDP fell to its lowest level since the June quarter of 2018.
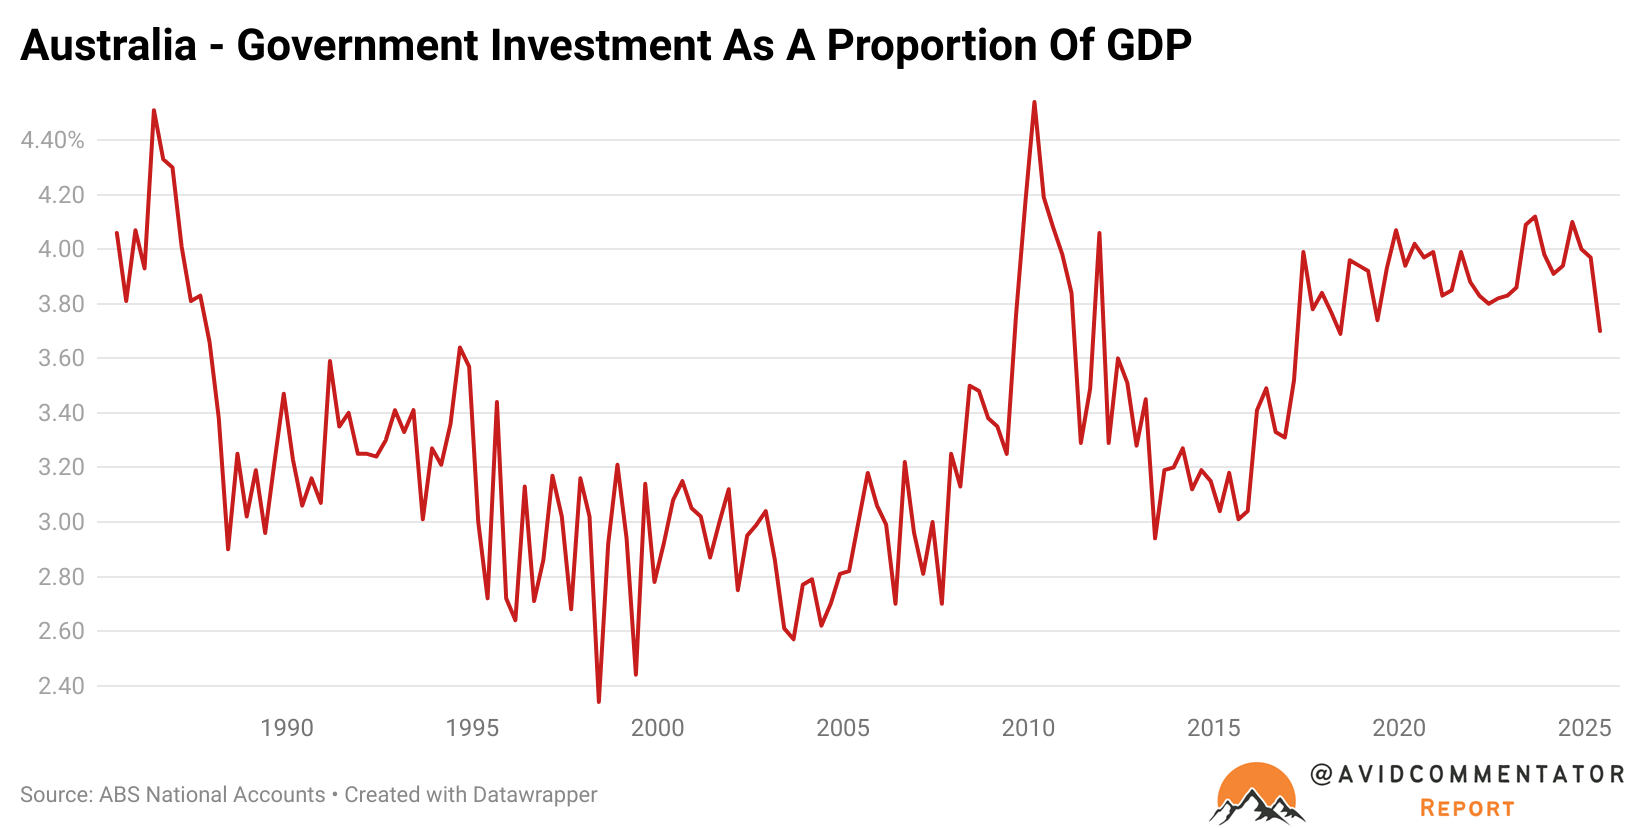
It’s perhaps notable that despite the sizable pressure the unexpectedly large population growth has put on the nation’s infrastructure, the level of government investment in fixed assets such as infrastructure does not reflect the additional demand growth in anything approaching a linear way.
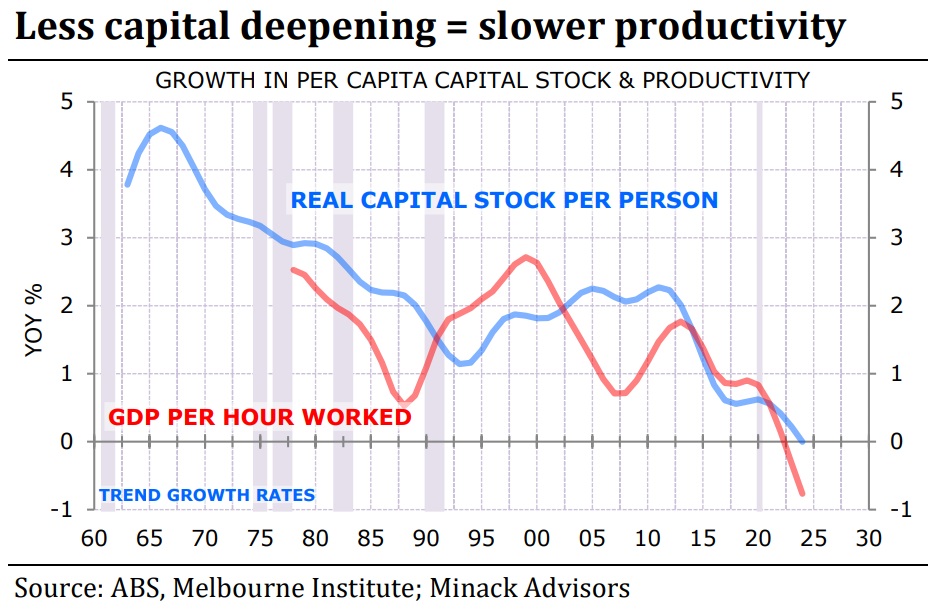
This relative lack of public investment and still anaemic levels of business investment have contributed to what economists refer to as capital shallowing.
The chart below from Gerard Minack illustrates quite well how this negatively impacts productivity over time, with this point recently echoed in the latest Reserve Bank Statement on Monetary Policy.
In the years following the end of the mining boom, the nation’s economy has become increasingly reliant on government to drive growth, with a sizable element of the underlying means to pursue that strategy stemming from revenue derived from the resources sector.
Ultimately, there is a growing acknowledgement of the challenge of transitioning from a government-driven economic strategy to a private sector-driven one.
Whether the Australian economy can pull it off or not will help define the remainder of this decade.
