
If you are curious about the differences in methodology between myself and the usual auction data providers, there is an explanation down the page.
After last week’s strong performance from the Sydney auction results, it’s strongest since June 2023, it appeared increasingly likely that the Sydney market was set for a boom.
This week however, has shifted the needle well back toward greater uncertainty.
The headline sold to listed clearance rate for the Harbourside City was 45.9% (vs 51.6% last week), it’s lowest since late June and roughly in the ballpark of results this year prior to the recent surge.
But there is a bit more to it than that. This weekend’s results also held the second lowest level of auction volumes for Sydney so far this year, excluding the early weeks of the year when the auction market emerges somewhat slowly from its holiday season hibernation.
The issue of lower volumes is something that property industry veteran Edwin Almeida of Ribbon Property Consultants has noted on Twitter and in his recent interviews with the Digital Finance Analytics YouTube Channel.
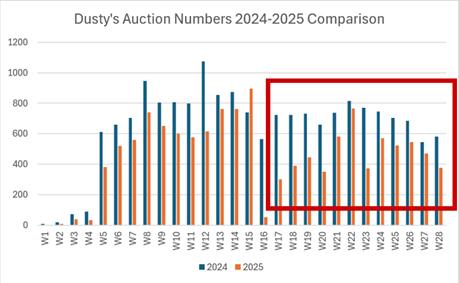
Source: Edwin Almeida
Meanwhile, in the nation’s other large auction market, Melbourne, the second highest result since the high’s of mid-2023 was recorded with 55.5% of properties listed for auctions being successfully sold, further cementing Melbourne’s lead over Sydney on a rolling 4 week basis.
On this metric, Melbourne has hit a new cycle high, with Sydney dropping back slightly from its cycle high recorded last week.
While it would be convenient to attribute the surprising weakness of the Sydney market to the RBA’s shock decision to keep rates stable at their recent meeting, Melbourne has seemingly weathered that shift without incident in the limited snapshot we have so far.
A major driver of outcomes in these two markets and across the country more broadly is the shift lower in the total level of stock for sale on the market. As of the latest monthly Cotality data, the number of properties listed for sale nationally is down by 5.8% vs this time last year and down 16.7% vs the 5 year average for this time of year.
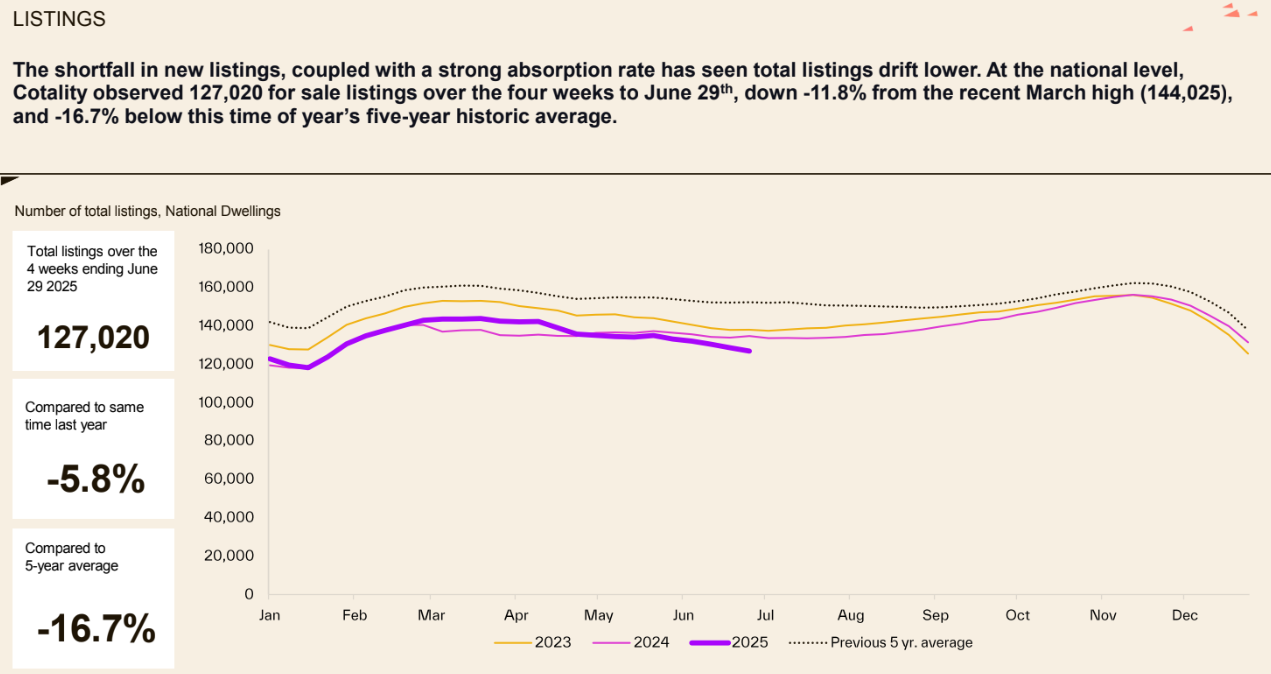
Source: Cotality (formerly known as Corelogic)
Ultimately, the outlook for the nation’s property market is an increasingly uncertain one.
On one hand rates will be cut significantly further, but on the other the labour market is showing signs of a significant slowdown in employment growth and early evidence of government pulling back on taxpayer funded jobs growth.
Methodology Differences
When Domain, Corelogic or any number of other property data sources produce their preliminary auction results on a Saturday evening, it perhaps isn’t based on what one would think at first glance.
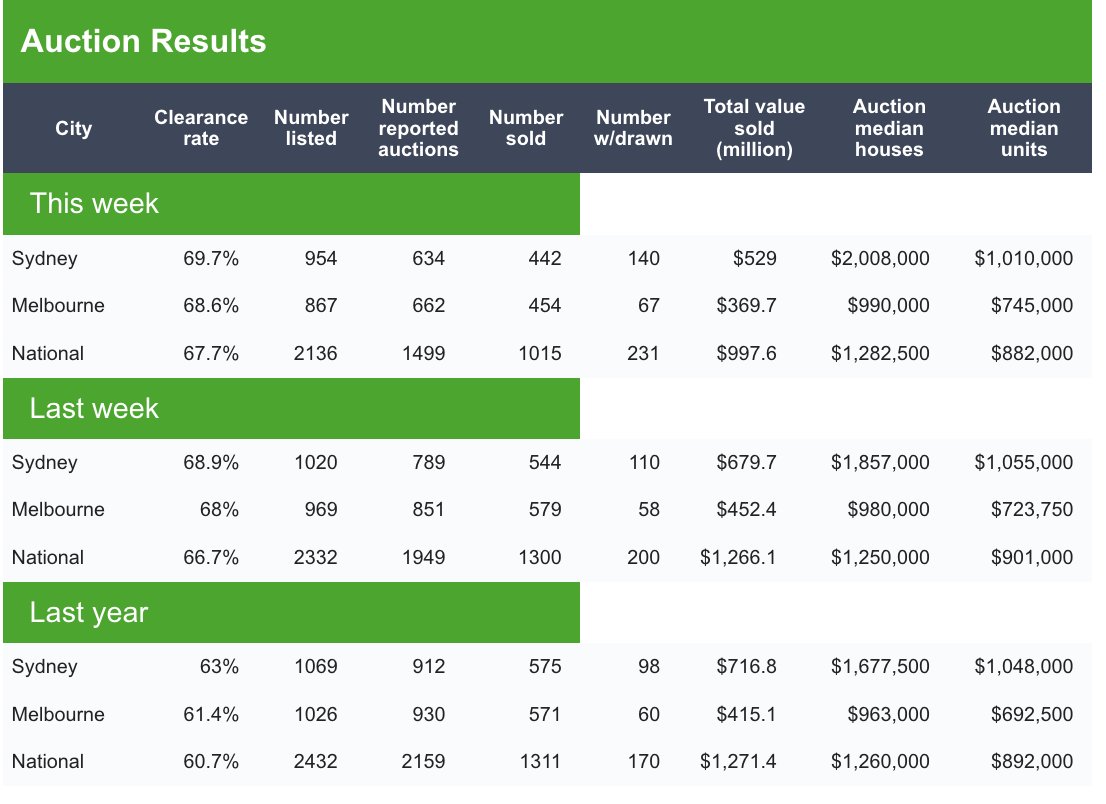
Instead of taking the total number properties sold (by whatever means pre-auction or on the day before 5pm) and then dividing it by the total number of properties up for auction, their approach takes the number reported sold and divides it by the number of properties where the agents or auctioneers have provided a result.
This is illustrated in the graphic below from Domain. In Sydney a few weeks ago, 320 out of 954 (33.5%) auction results were unreported as of the time of the publishing of the preliminary figures. In Melbourne, where the market is performing significantly more strongly than Sydney than the Domain results would suggest 205 out of 867 (23.6%) were missing.
As one might imagine some agents are less than thrilled about reporting their failure to sell a property, so the results simply go missing. On some auction weekends where the market isn’t having a great time, well over 1/3 of results simply don’t get reported.
When the market is extremely hot as it was in 2021, then the unreported rate drops well into single digit percentages.
This issue has been well covered by property sector expert and industry veteran, Louis Christopher, the Managing Director of SQM Research.
It’s worth noting that the gold standard for hard data auction results comes from SQM on the Tuesday following the auction weekend. You can find that here.
