Amidst the ongoing debate surrounding the right level of migration for Australia, I thought it would be interesting to look into how population growth is playing out at a state based level. The piece will also look at which state has been doing the heavy lifting relative in terms of its population growth relative to its size.
To gain some additional perspective, we’ll be looking at the figures from two different starting points, the conclusion of 2019 and the mid point of 2022, which roughly coincides with the election of the Albanese government.
Before we kick off into the figures, it’s worth noting that they only cover up to the end of 2024.
Nominal Population Growth
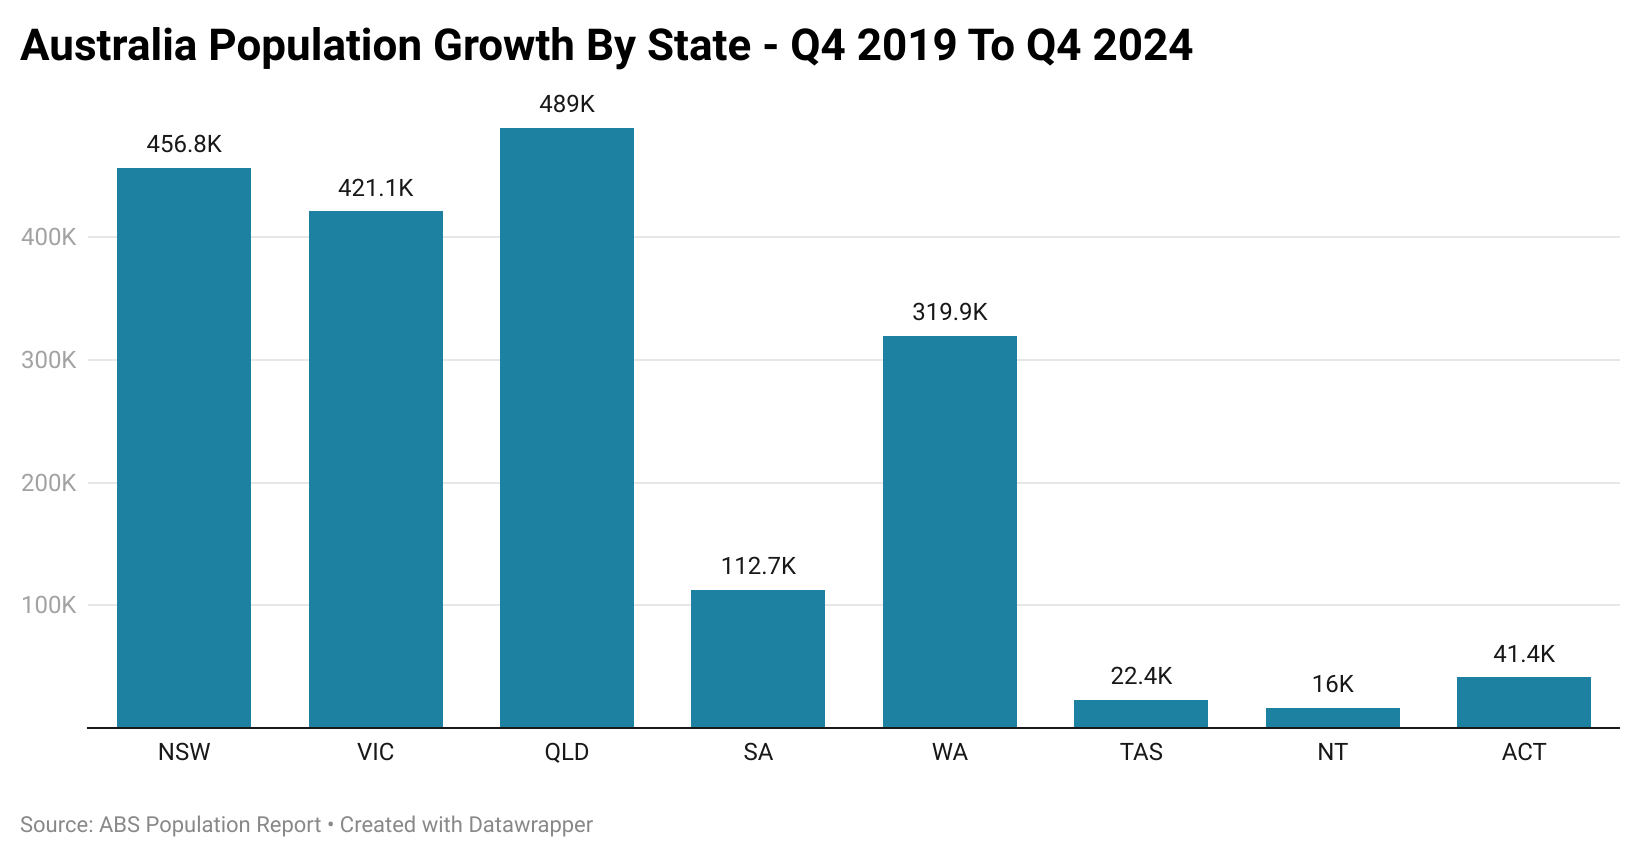
Since the end of the 2019, the overall population has grown by 1.88 million in net terms, with 1.38 million of that coming in the 2.5 years of data from Q2 2022 onwards.
Right from the get go there is an interesting divergence between the two different snapshots. On the metric of pre-Covid to present, Queensland has seen the highest level of population growth, followed by New South Wales and then Victoria.
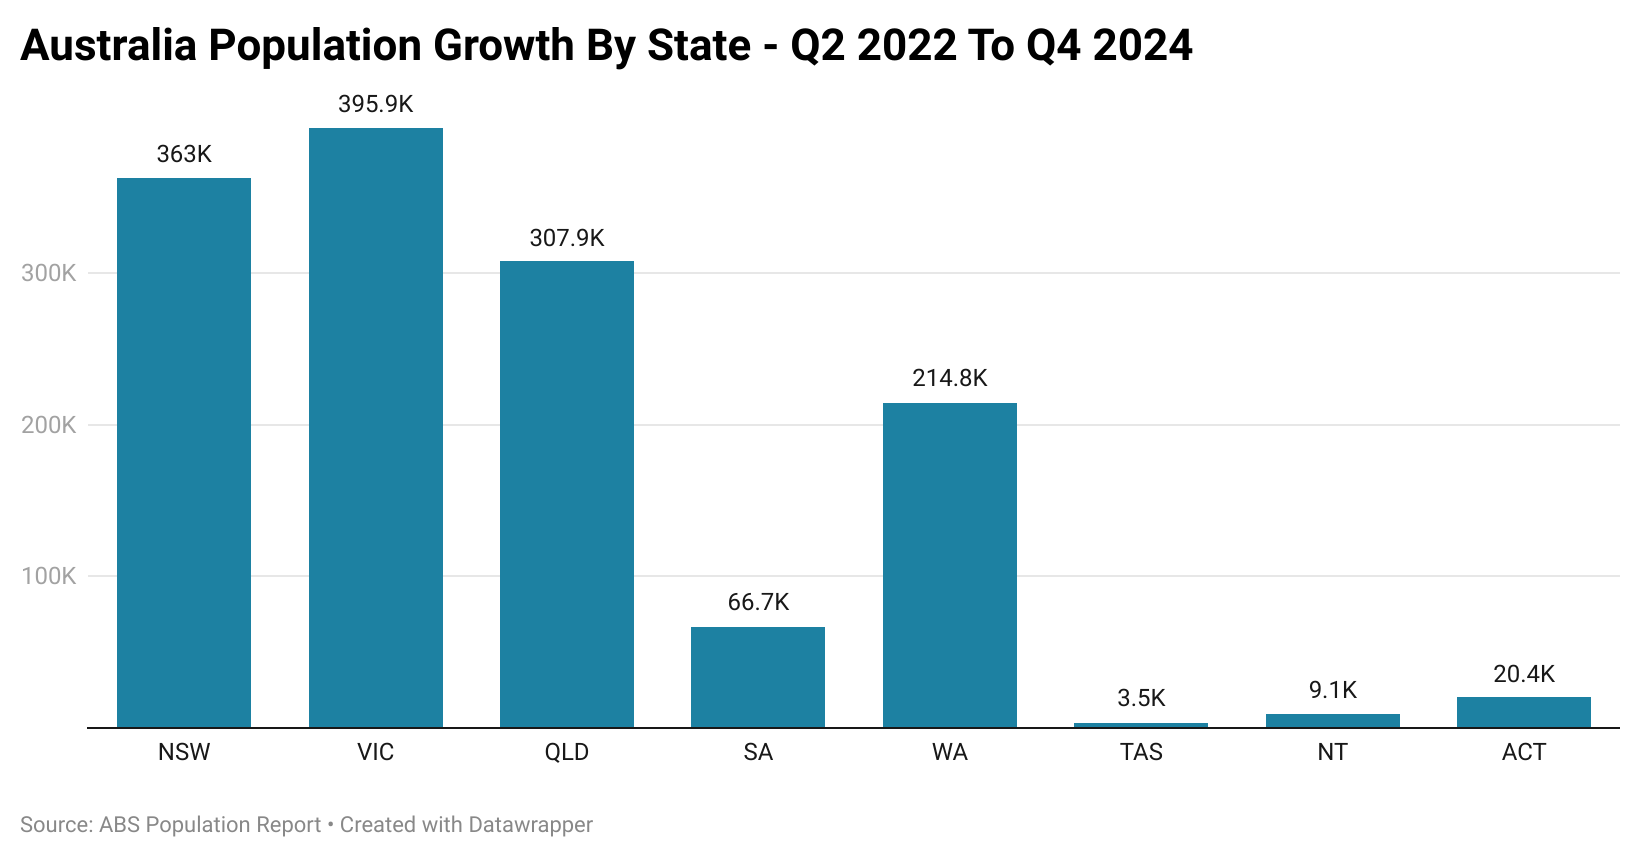
When we shift the focus to the perspective taken from Q2 2022 onwards, Queensland’s relative position falls back dramatically to third place, as Victoria rockets into the lead.
Proportional Population Growth
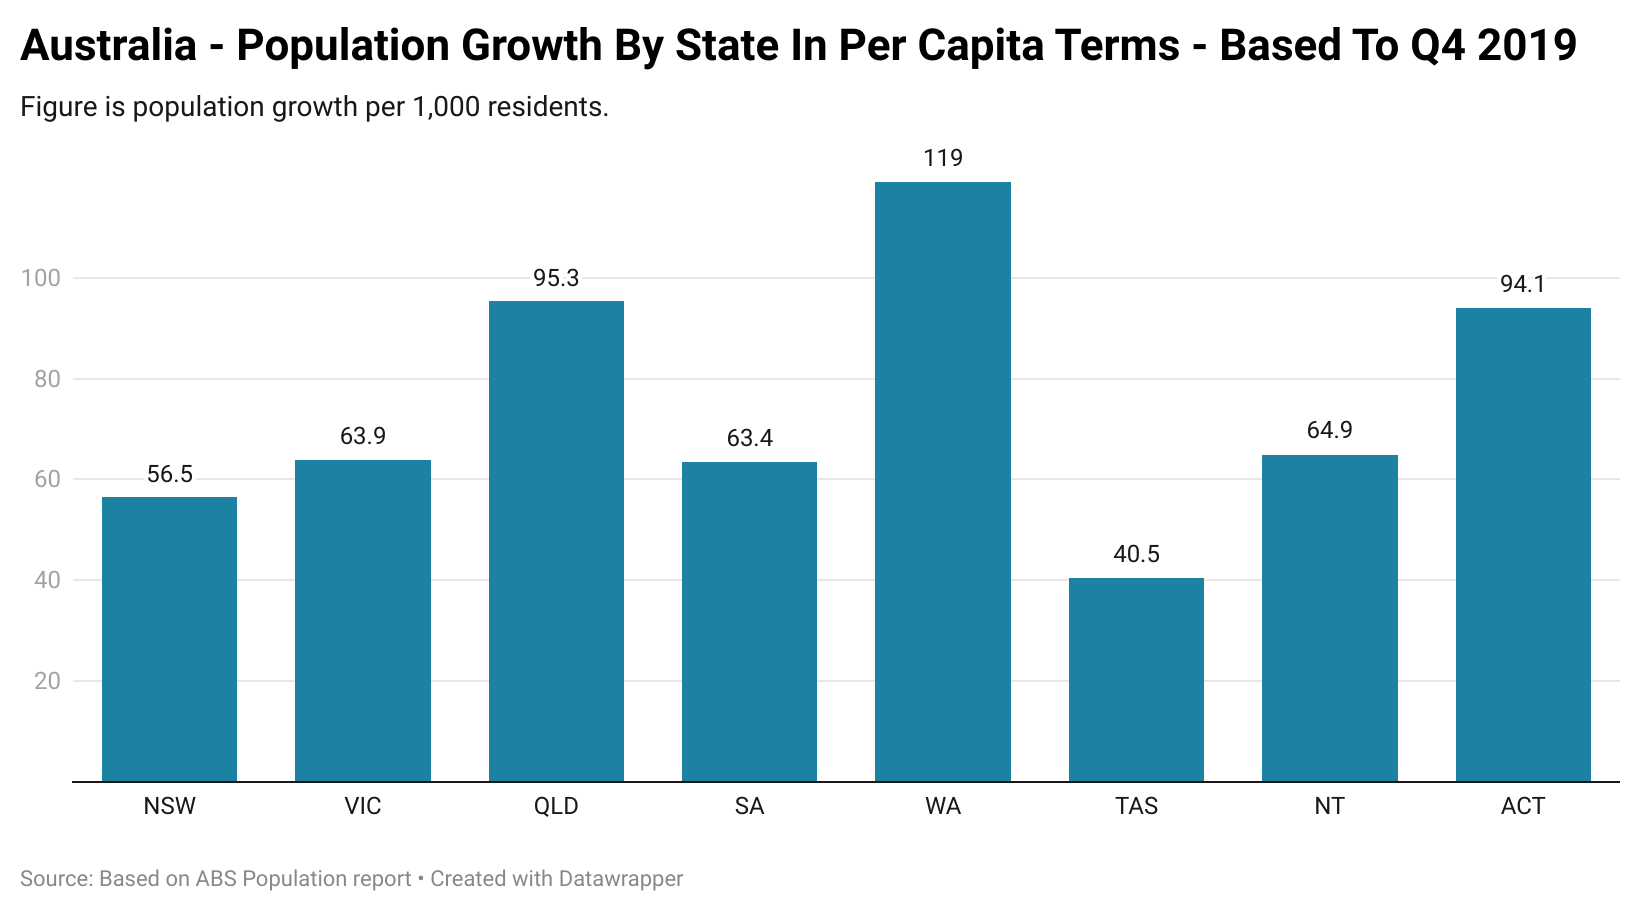
In terms of per capita population growth, the difference in outcomes is vast. Looking at the numbers from Q4 2019 on this perspective, it’s unsurprising that WA and Queensland have faced such major issues with keeping up with the additional demand for housing.
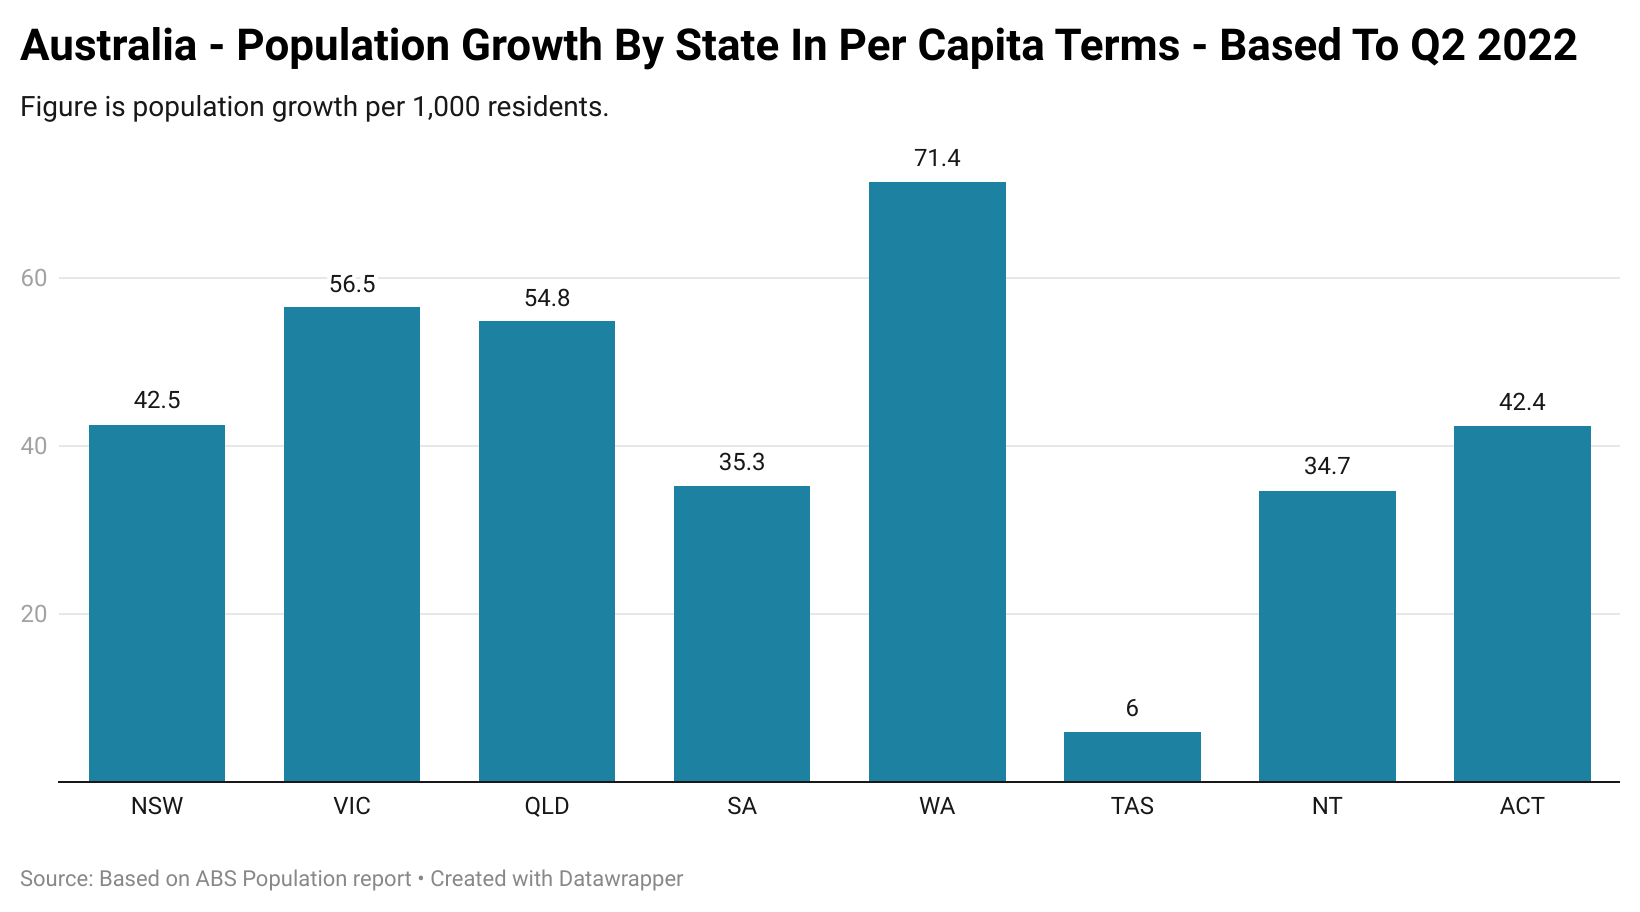
When the point of comparison is shifted to Q2 2022 onwards, WA once again emerges on top, but Queensland falls back in the pack to behind Victoria. Another major move is reflected in Tasmania’s numbers dropping from population growth of 40.5 persons per 1,000 between Q4 2019 and Q4 2024, to just 6 persons per 1,000 between Q2 2022 and Q4 2024. This is likely down to the impact of internal migration flows during the pandemic and a relatively low base to begin with.
The Takeaway
While some states have certainly faced far greater population pressures than others, more broadly the net result has been relatively similar, an ongoing housing and infrastructure deficit which continues to grow with each passing day.
Overall, migration remains the driver of a majority of demand for additional housing in net terms. But amidst changing household demographics, domestic demand for housing is also surging, with estimates as high as 110,000 dwelling completions being required each year before a single new migrant is added to the equation.
