When the pandemic arrived on Australia’s shores in early 2020, housing was already unaffordable for a majority of households, as illustrated by falling homeownership rates and declining rates of household formation.
But like the joke that a Russian family friend used to describe his nation’s history, the events that would unfold for Australia’s housing market can be summed up in five words.
“And then things got worse”.
Today, we’ll be looking at the latest monthly housing price figures from Cotality (formerly known as Corelogic) and contrast them with the last set of numbers unimpacted by the pandemic from January of 2020.
Due to popular demand, this analysis will also include data from regional areas across the country in a separate analysis later in the article.
The Capitals
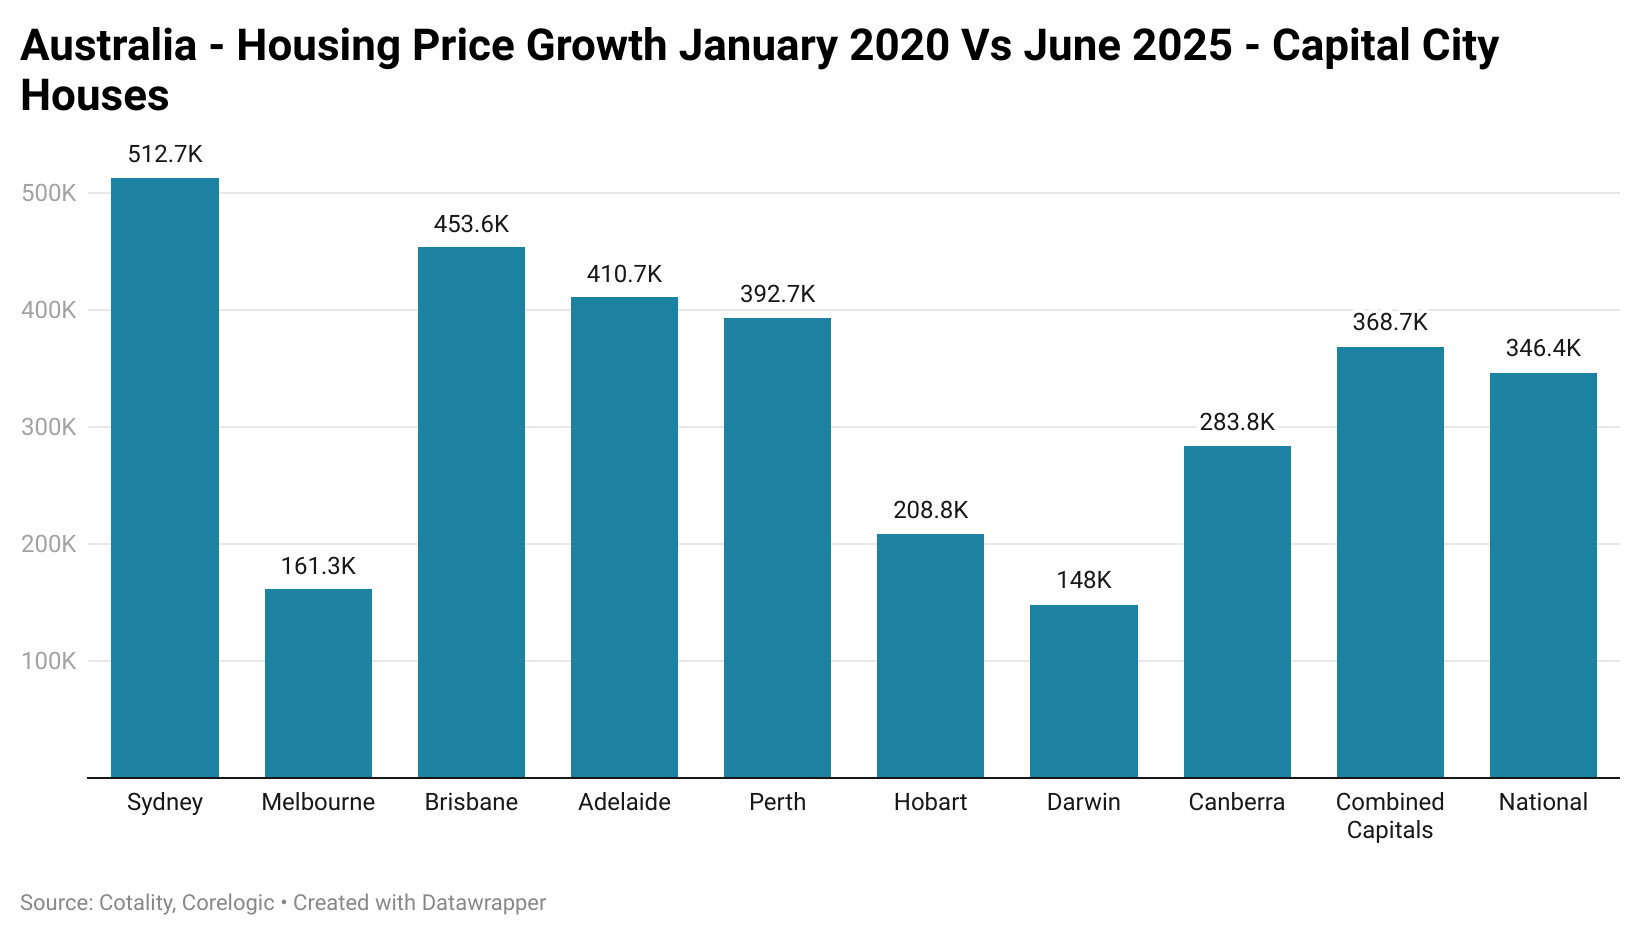
In the nation’s capital cities, the largest nominal house price rise was in Sydney, with prices up $512,700, followed by Brisbane, with prices up by $453,600. At the other end of the spectrum, the lowest price rises were seen in Darwin, with prices up $148,000 and Melbourne, with prices up by $161,300.
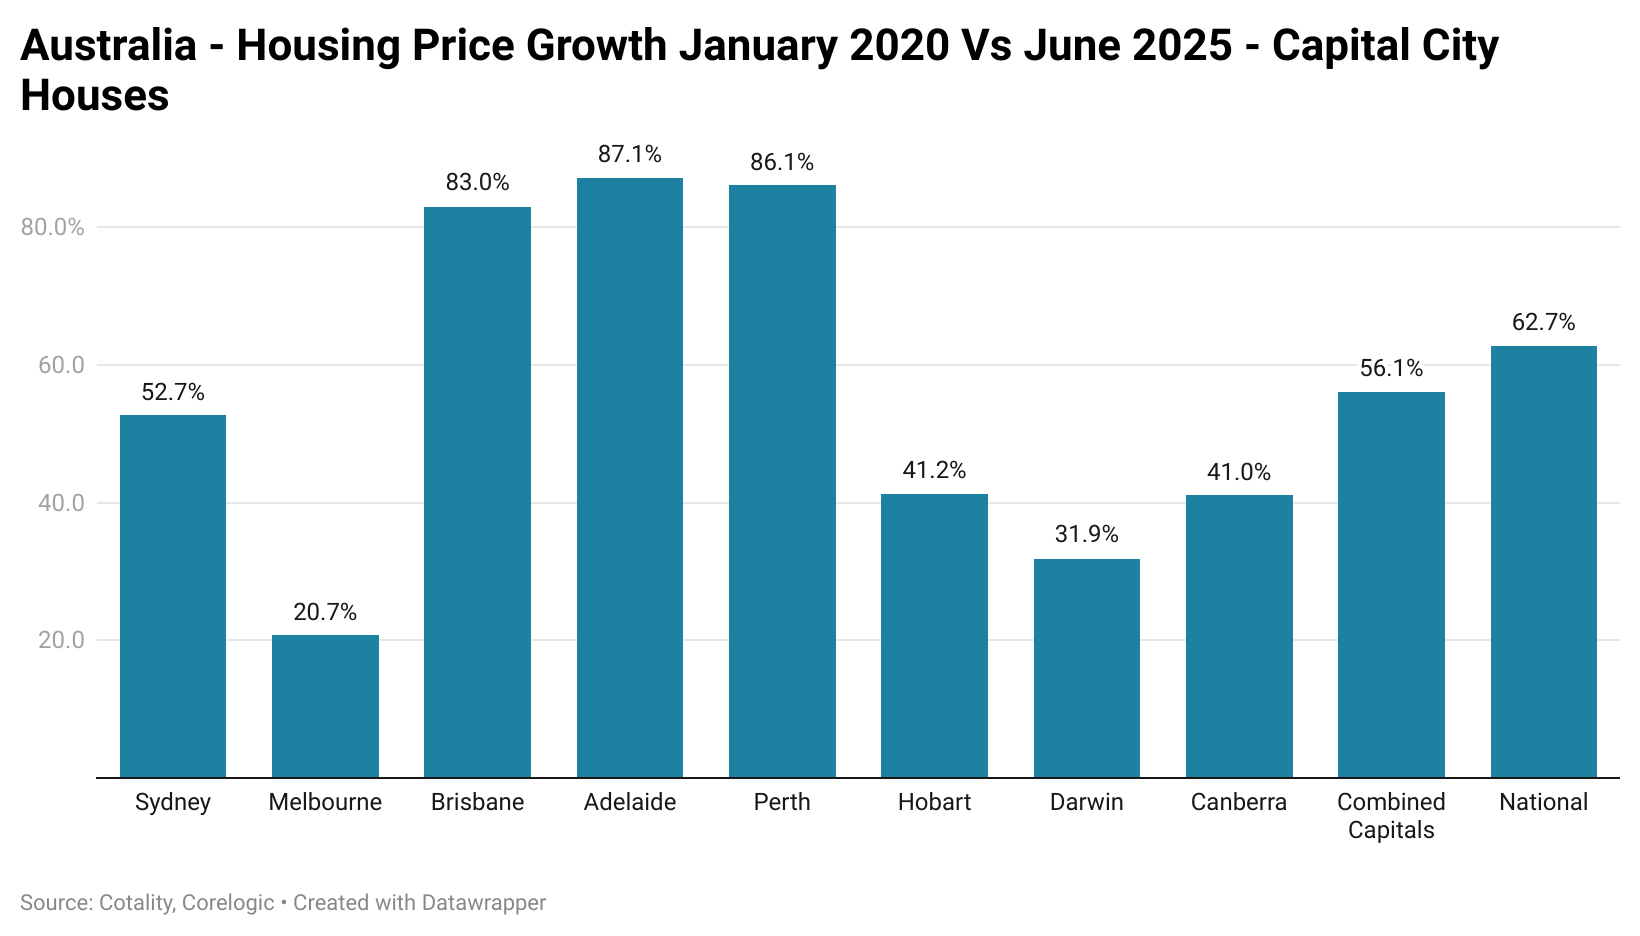
If we shift the focus to the relative price increase based on January 2020 housing prices, Brisbane, Adelaide, and Perth are in a class of their own. Adelaide housing prices are up 87.1%, Perth by 86.1% and Brisbane by 83.0%.
The weakest performer in relative terms is Melbourne, with prices up by 20.7%.
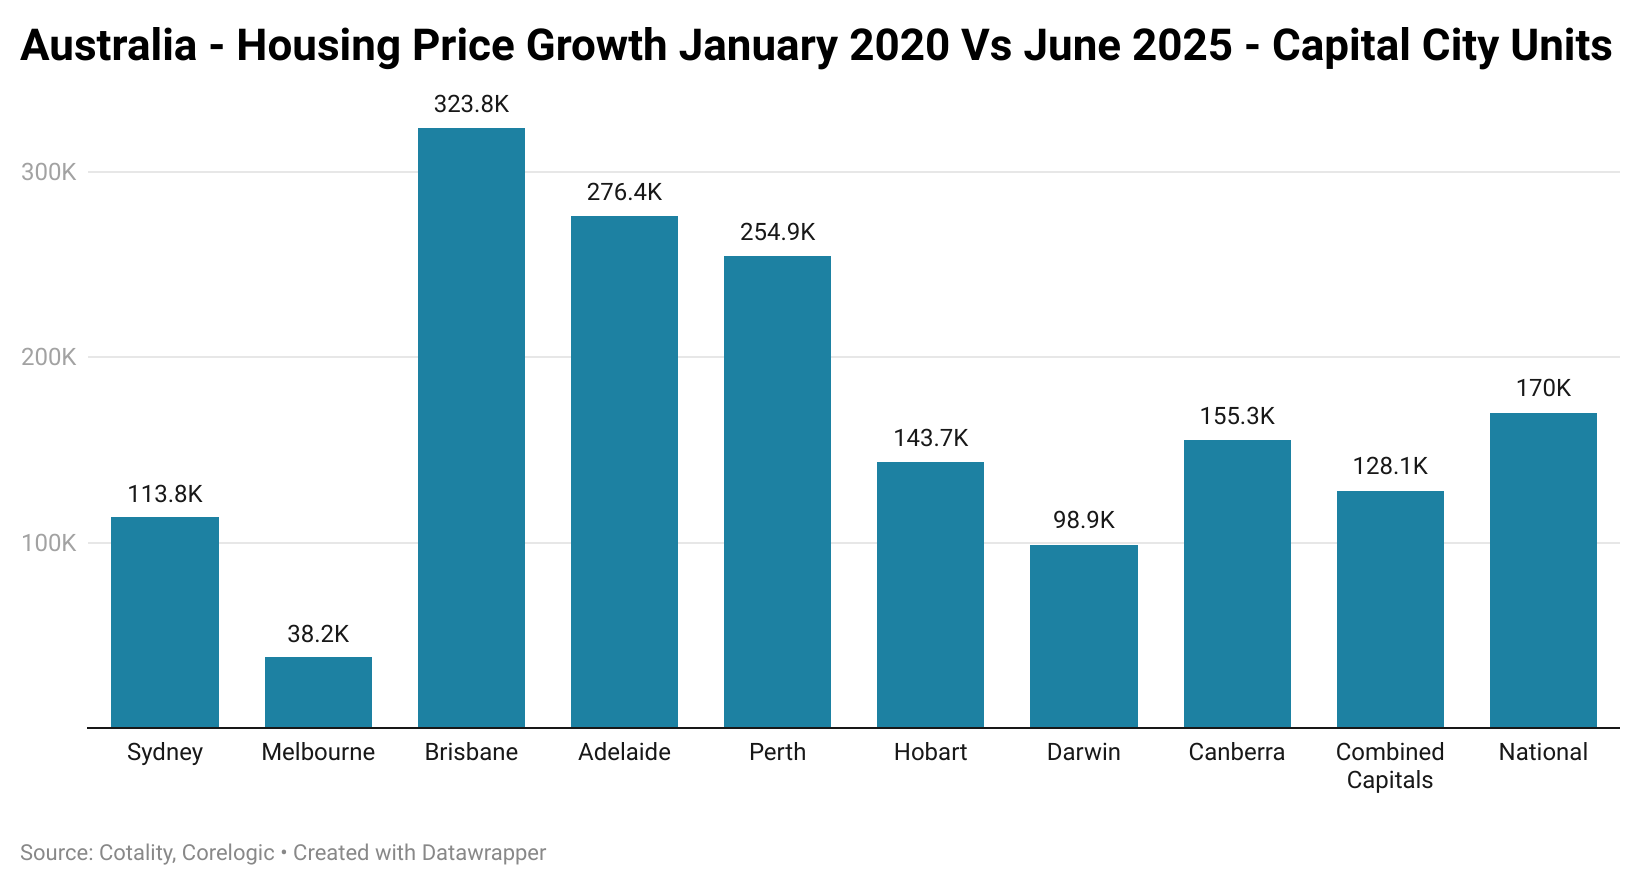
In terms of units, Brisbane, Adelaide, and Perth have seen by far the largest growth, with the median Brisbane unit up over $323,000 in the last five and a half years.
At the opposite end of the spectrum, the median Melbourne unit is up by $38,200, with Sydney up by $113,800.
This leaves the narrative that one can always simply use a unit to build equity and then trade up to a freestanding house in tatters, particularly once strata fees are taken into account.
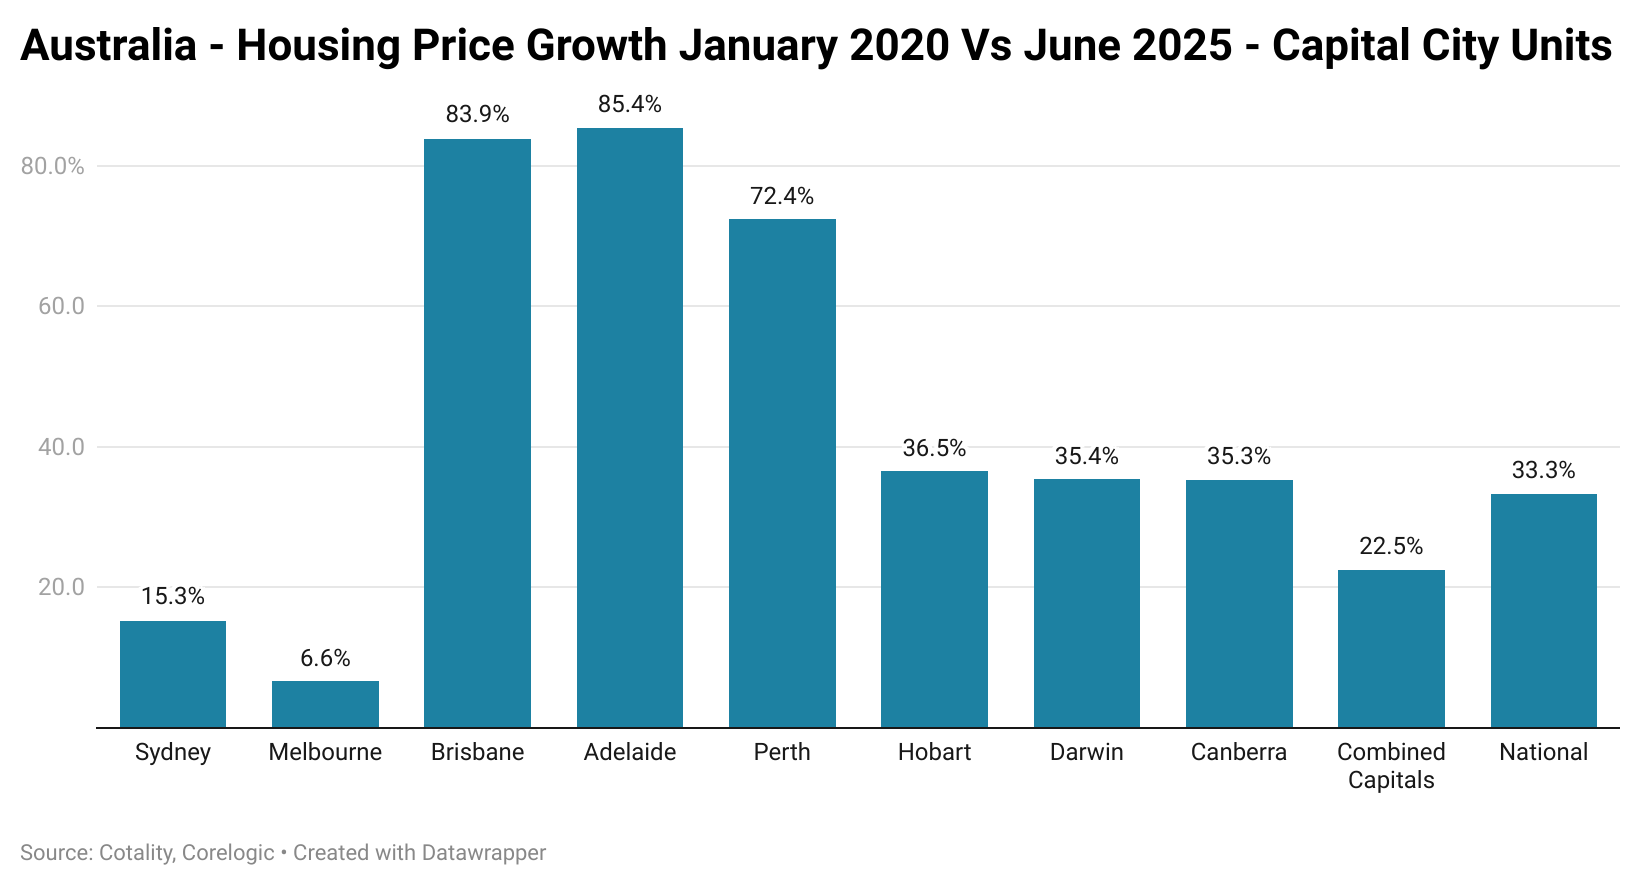
When it comes to relative growth for units since the pandemic, an absolutely huge divergence becomes immediately clear.
In Sydney and Melbourne unit price growth is below the cumulative impact of inflation, which is at least one positive to take away from today’s analysis. But once again, Brisbane, Adelaide, and Perth see their growth on its way to the moon.
The Regions
The story when it comes to regional house prices is a bit different to the capitals, with significantly less variation in nominal price growth when broken down by state. 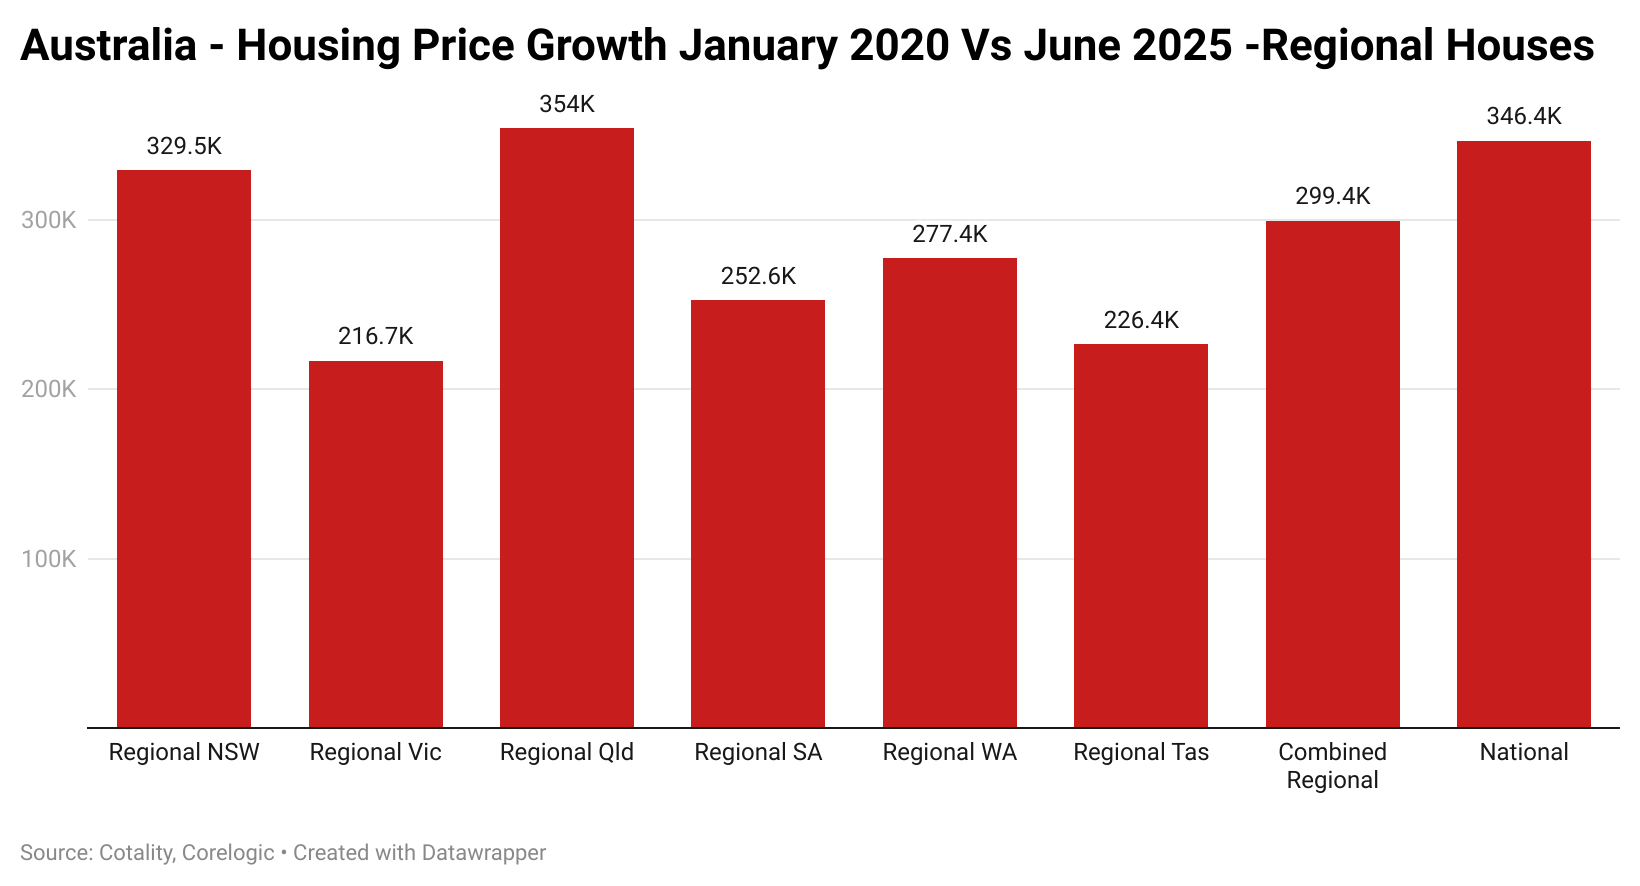
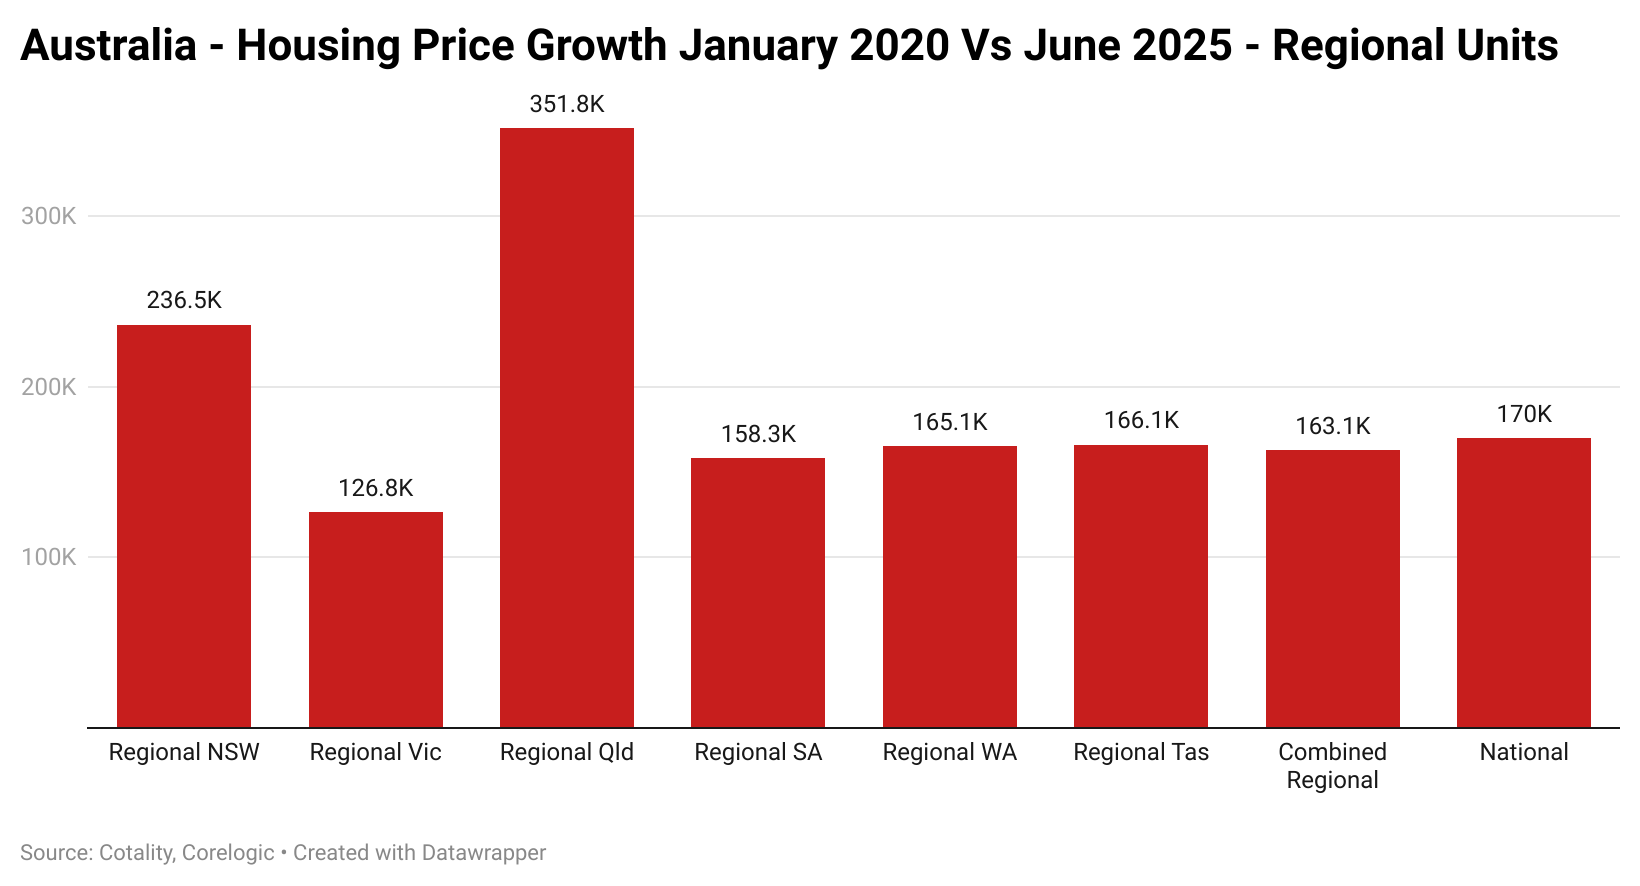
When it comes regional unit prices, the performance is remarkably similar, with regional Queensland and regional NSW as the relative outperformers. This is likely due to the exodus of Sydneysiders into the NSW regions and sizable populous areas in Queensland, such as the Sunshine Coast, being counted as regional areas.
In terms of regional houses, the largest relative price growth was seen in regional South Australia, Queensland, and WA. 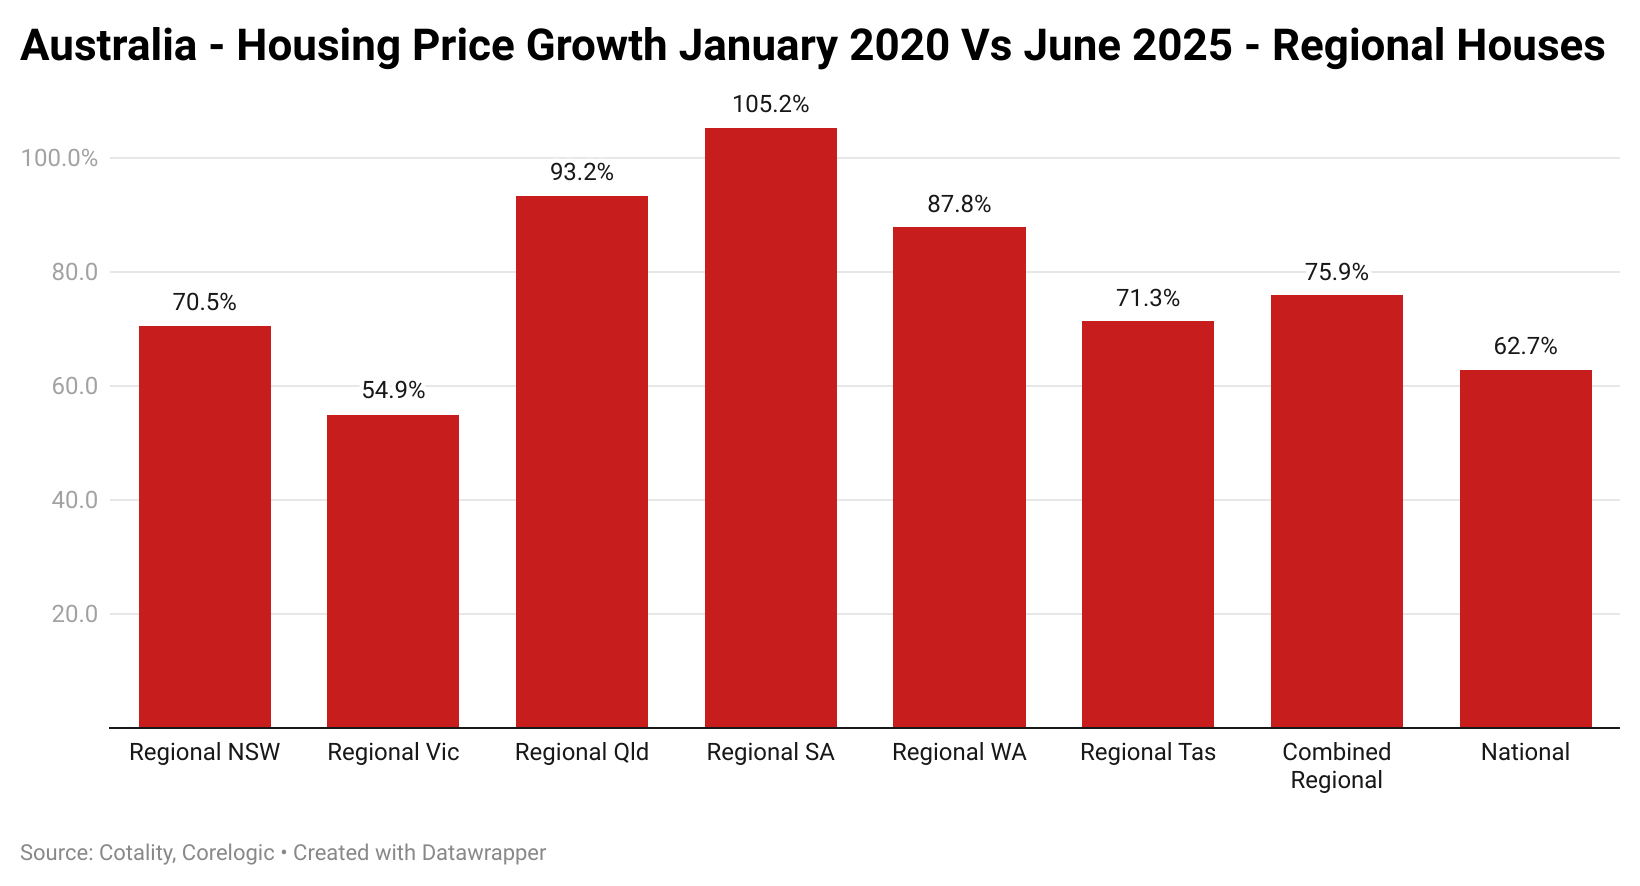
The performance of regional units, on the other hand, was more varied and in some ways reflected the trends seen in the capitals. Queensland, South Australia, and Western Australia once again saw the strongest growth, with NSW and Victoria lagging the broader trend. 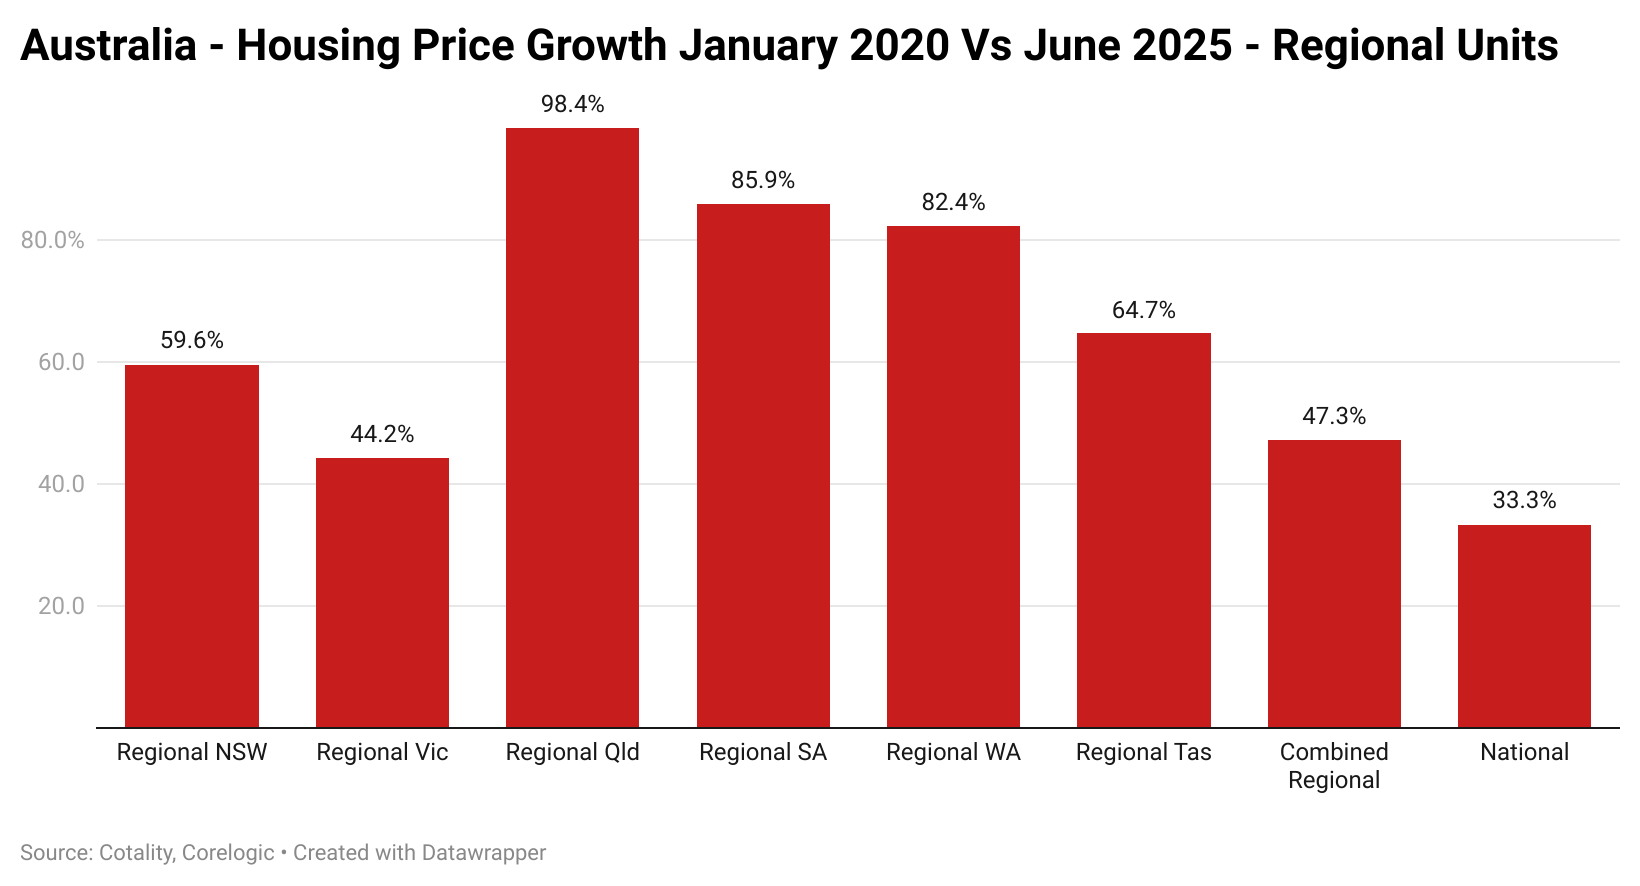
The Takeaway
The nation’s unaffordable housing markets were once largely defined by Sydney, Melbourne, and other pockets throughout the country.
Today, finding a locale where the median house is affordable for the median earner in that area is now an even greater rarity.
During that period, the relative affordability in many rental markets has also diminished, likely resulting in a significant impact on household formation.
Ultimately, the housing cost rises seen in the last year will eventually be seen as the disastrous events they really are, doing long-term damage to the nation’s economy and its social fabric.
