
In an article last Monday for the ABC, Patricia Karvelas made the case that demographic shifts in the nation’s electorate would assist Labor in its efforts to tackle the issue of tax reform.
“Labor’s timidity may finally be evaporating. The demographic shifts among Australia’s voting base also help Labor.
With Gen Y and Z now the biggest voting blocs, the losers are outnumbered. The preconditions are there for change.”
This is a repeat of a narrative seen across much of the media since the start of the year and while it is correct that Gen Y is now a larger generational voting block than the Baby Boomer generation, but there is a bit more to it than that.
Electoral Demographics By Generation
If we measure the size of various voting blocks by the traditional generation monikers based on figures from the Australian Electoral Commission, it reveals a picture that looks like this:
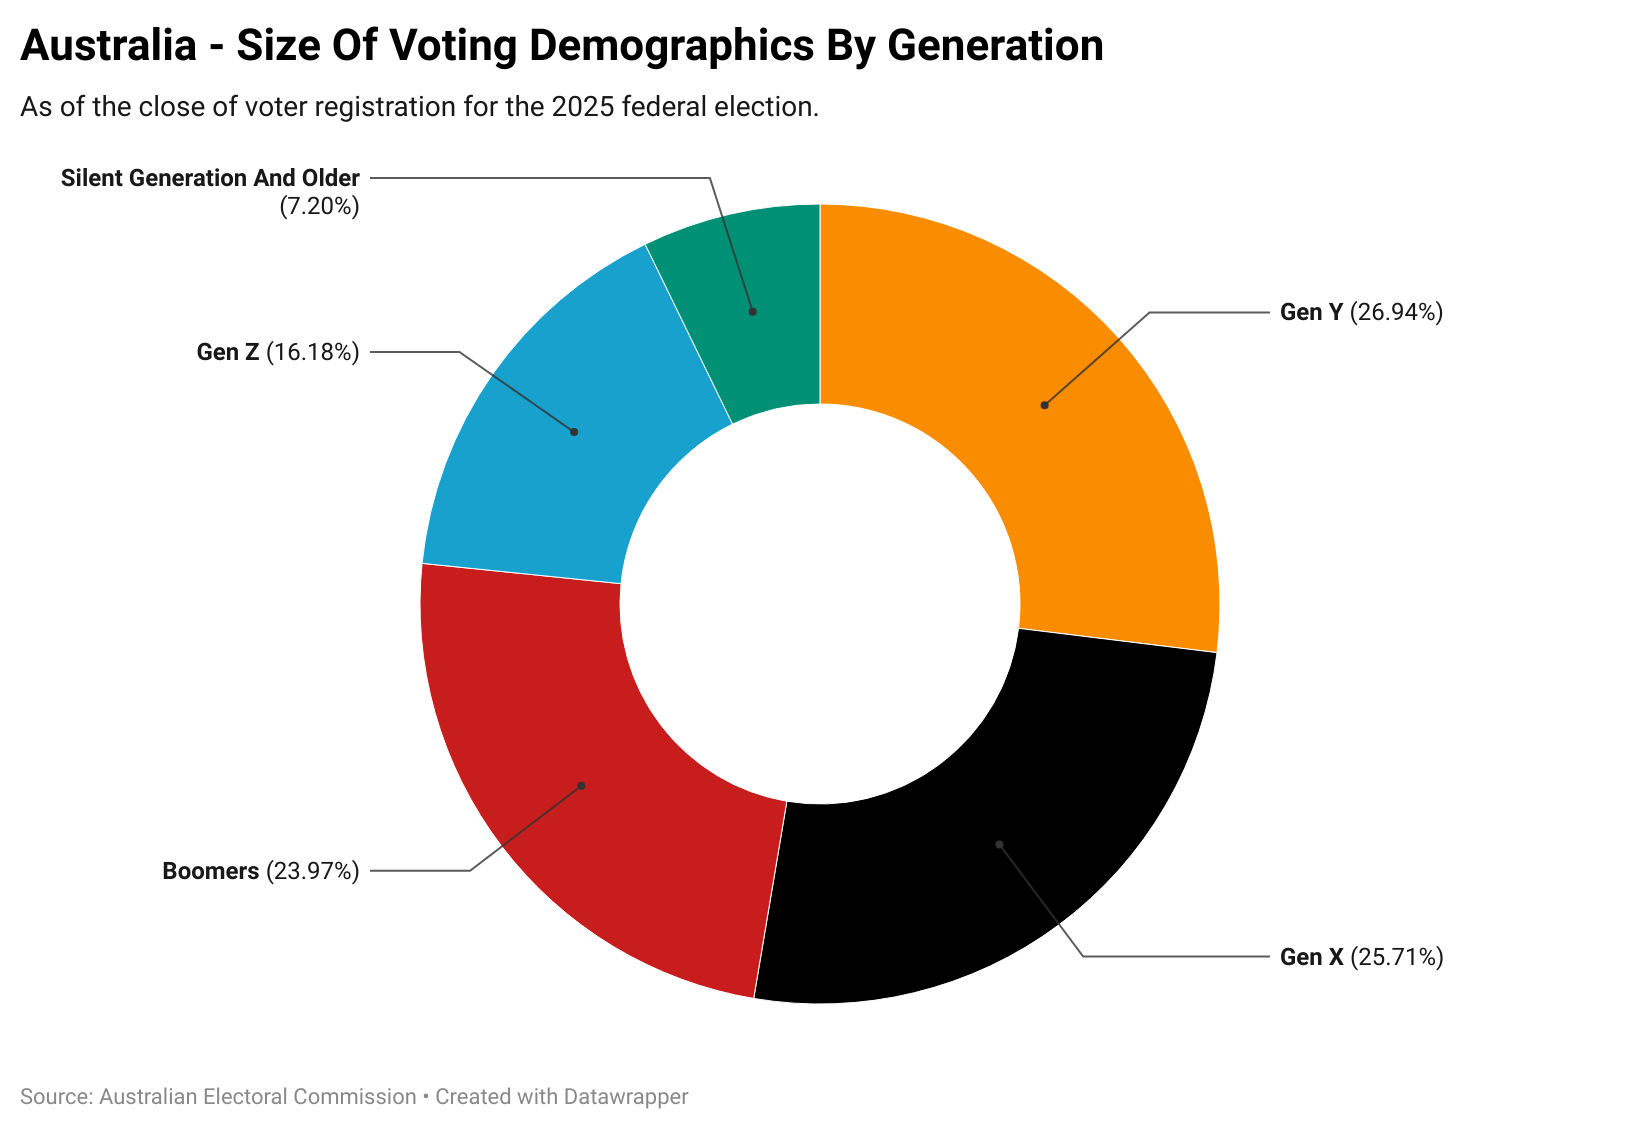
It’s true that over time the share of electoral power held by Baby Boomer voters has waned, making up 34.2% of the electorate in 2007 to 24.0% of the electorate today. If the metric is shifted to Baby Boomers and older, the share of the vote held by these demographic groups has fallen from 57.4% in 2007 to 31.2% today.
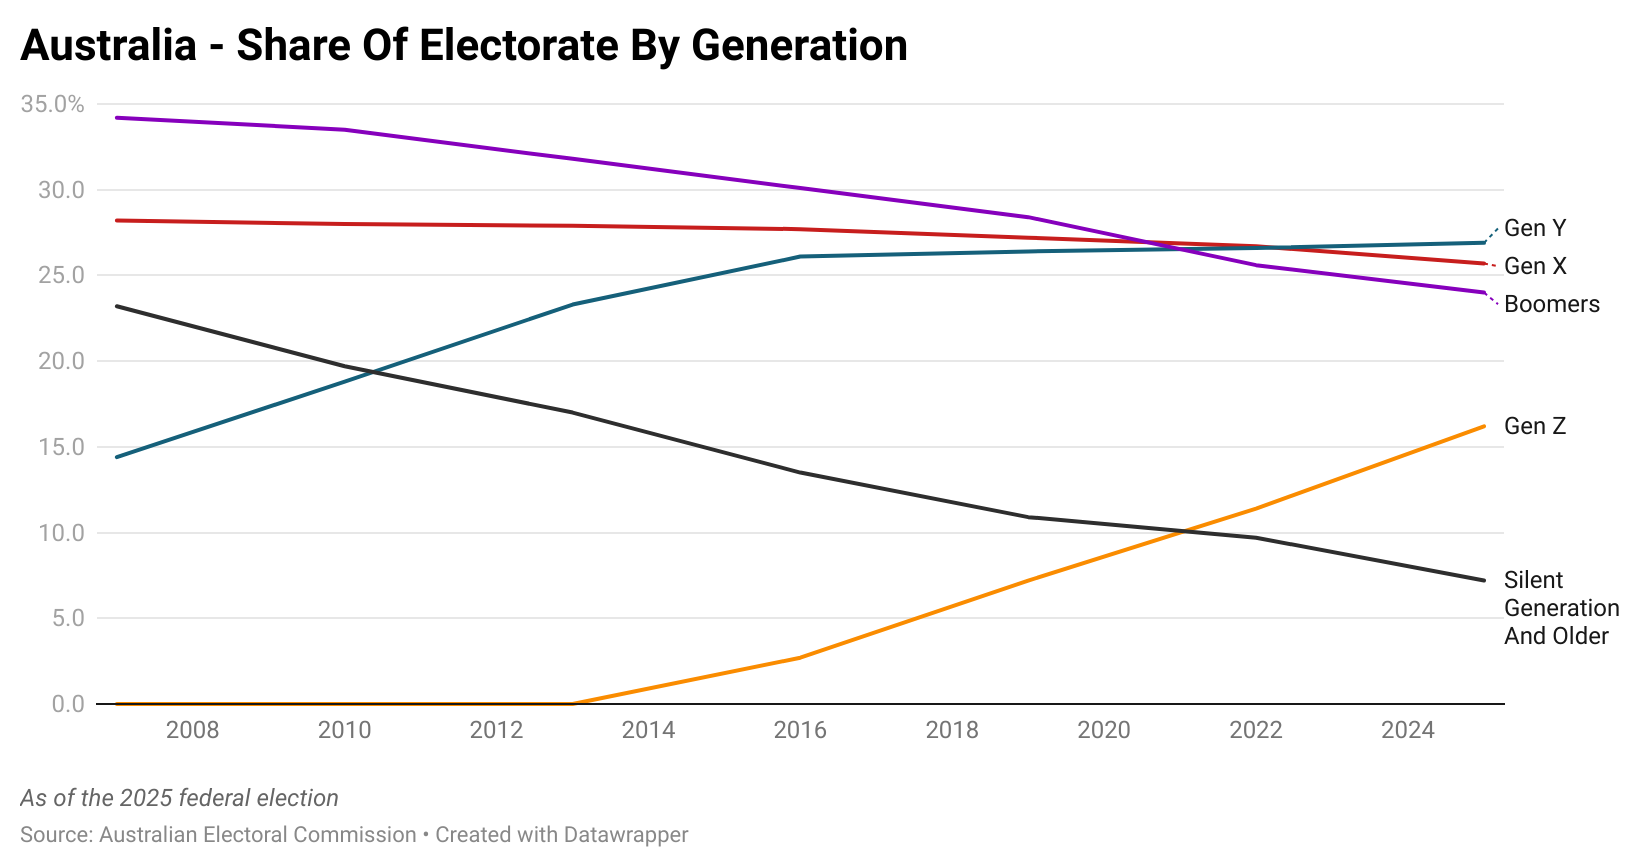
At first glance it may appear that the electoral math is shifting toward the nation’s young people, but the complete opposite is the case. It arguably comes down to perceptions of age when viewed through the lens of generational labels. The eldest member of Gen X turns 60 this year, with the eldest member of Gen Y turning 45. Which is hardly the image that is prompted in the nation’s collective consciousness when asked to imagine people from those generations.
Electoral Demographics By Age
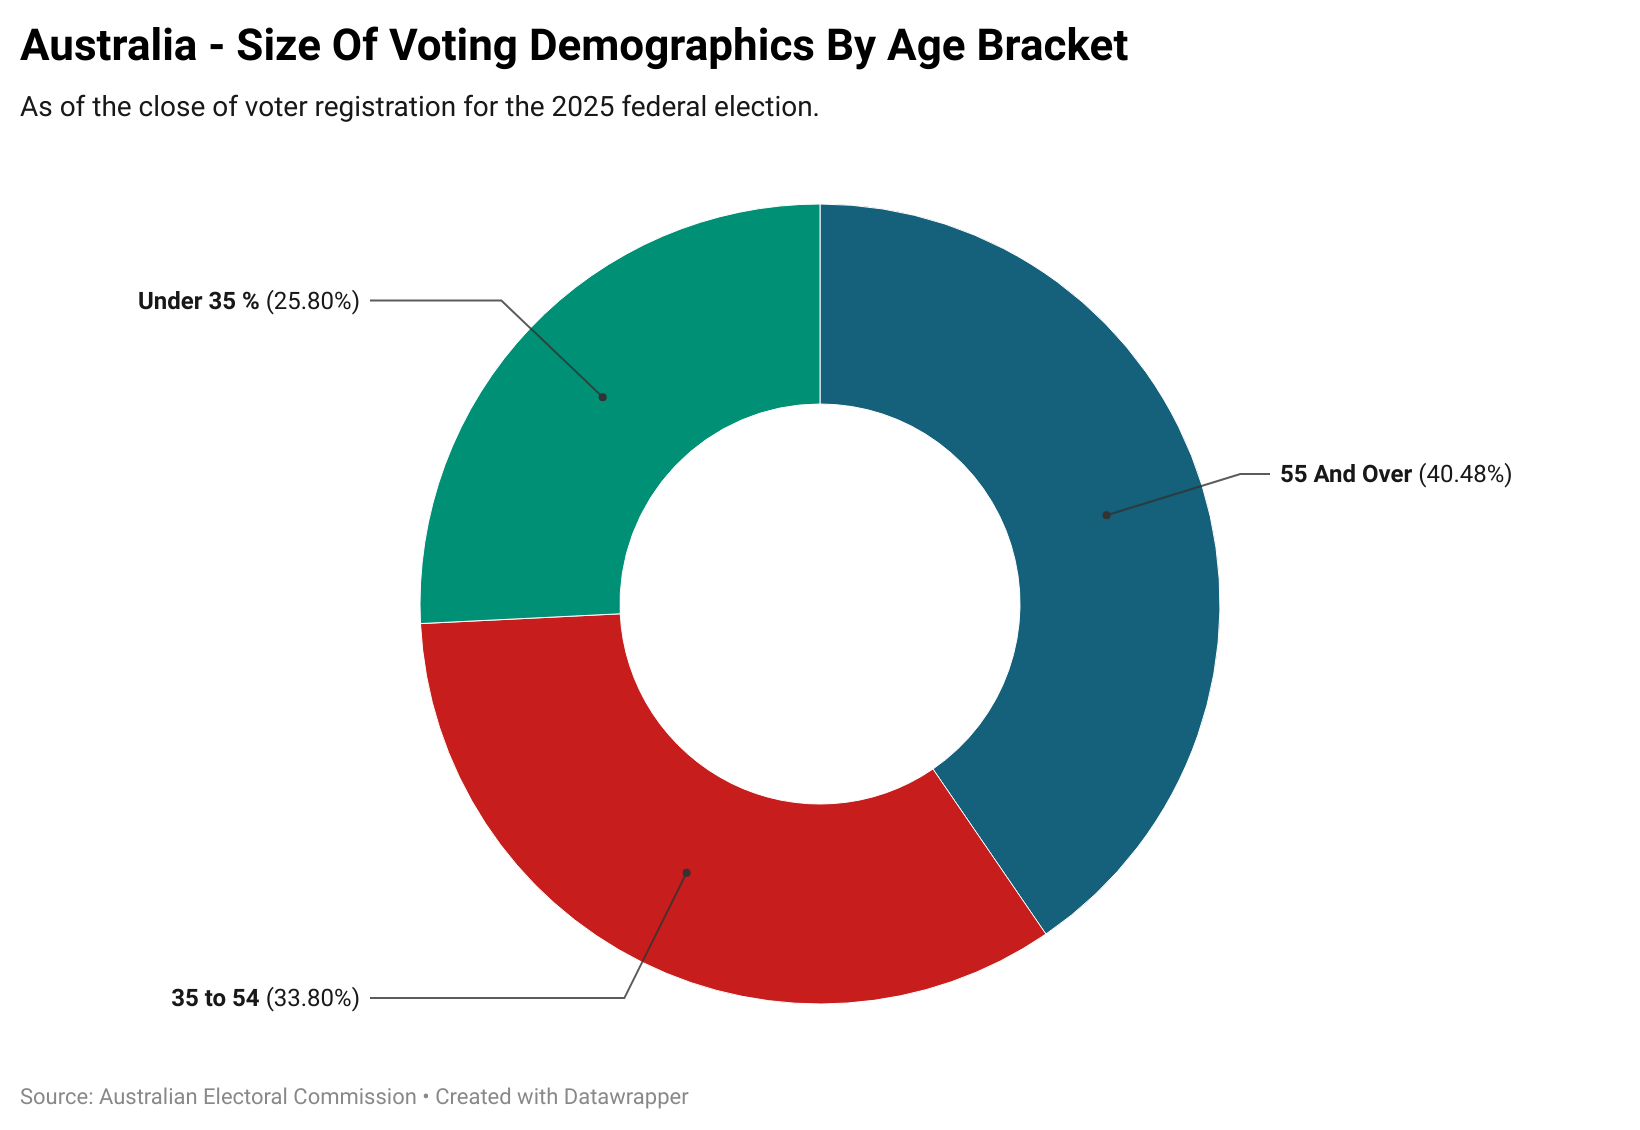
If we shift the focus to age brackets instead, focusing on under 35, 35 to 54 and 55 and over, a very different picture emerges. Rather than young people growing their influence at the ballot box, the share of the vote held by under 35’s has fallen to its lowest level since records began in 2007 and given the shift in the broader age demographics of the nation, it may be at it’s lowest level ever.
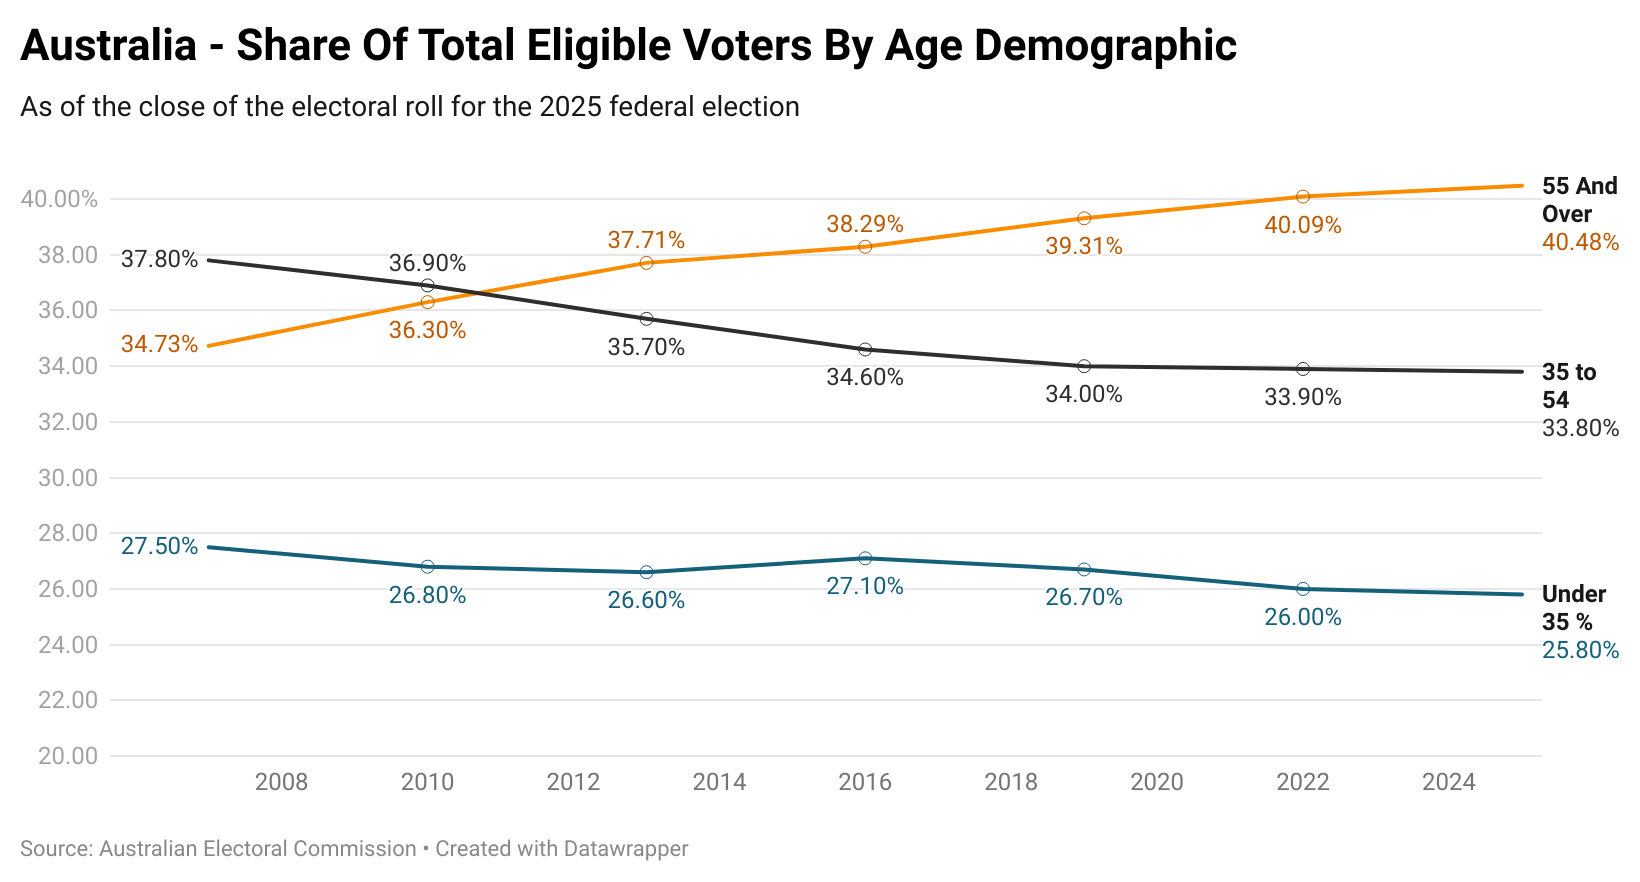
Since 2007, the share of the vote held by under 35’s has fallen by 1.7 percentage points from 27.5% to 25.8%.
Meanwhile, the share of the vote held by Australians 55 and over has risen by 5.7 percentage points from 34.7% of the electorate to 40.5%.
The Takeaway
The landscape of the nation’s electoral age demographics is arguably no more favourable for tax reform today than it has been in recent years, as the leverage held by voters aged 55 and over with an interest in preserving the status quo in aggregate continues to grow.
At the end of the day it will come down to the Albanese government’s willingness to use its majority, the largest since 1996 to press its agenda and expend the political capital it has accrued. And that is very much an open question as a government that took a small target strategy to the election attempts to find a meaningful agenda to pursue.
