
I have a good track record of making “mad” predictions about Australia’s housing market that turn out to be correct.
Here is another prediction. In the next fortnight, all Australian households will complete the census, as they do every five years. When the data comes out, it will show a slight uptick in the homeownership rate compared to the 65.4% from the 2016 census.
Why am I predicting this?
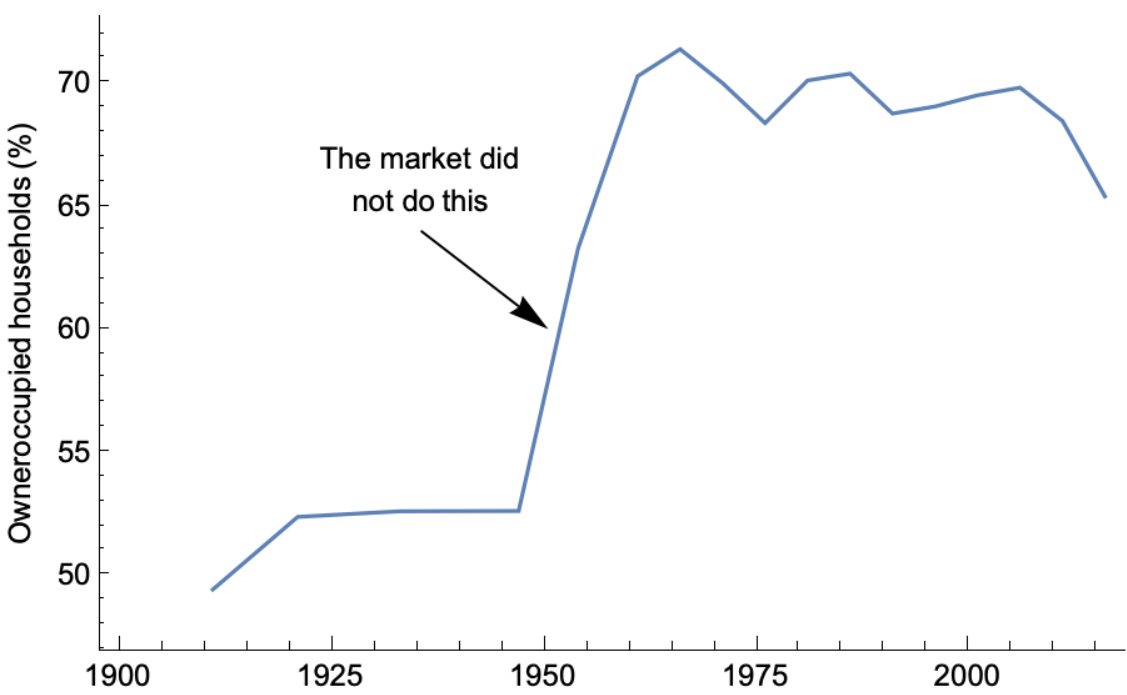
First, I want to look at the long term trends. Australia’s homeownership rate (share of households who own the home they live in, including if they have a mortgage) peaked in 1966 at 71.3%, have risen from 52.6% just two decades prior.
Heavy market intervention.
That boom in homeownership was brought about by heavy-handed government intervention in the housing market, including
rent controls that persisted post-war and incentivised landlords to sell, public finance for first home buyers building new homes, large scale public housing with tenant purchase programs, along with many other interventions.
The market era from the 1980s onwards has seen homeownership rates fall from 70.4 % in 1986 to 65.4% in 2016.
However, there are ups and downs within the slight downwards trend over the last 30 years.
In a housing market, an imbalance of home buying between landlords and first home buyers leads to changes in overall homeownership. More landlords selling and more first home buyers buying is the only mechanism that changes the overall distribution.
Let’s look at those two elements of the market.
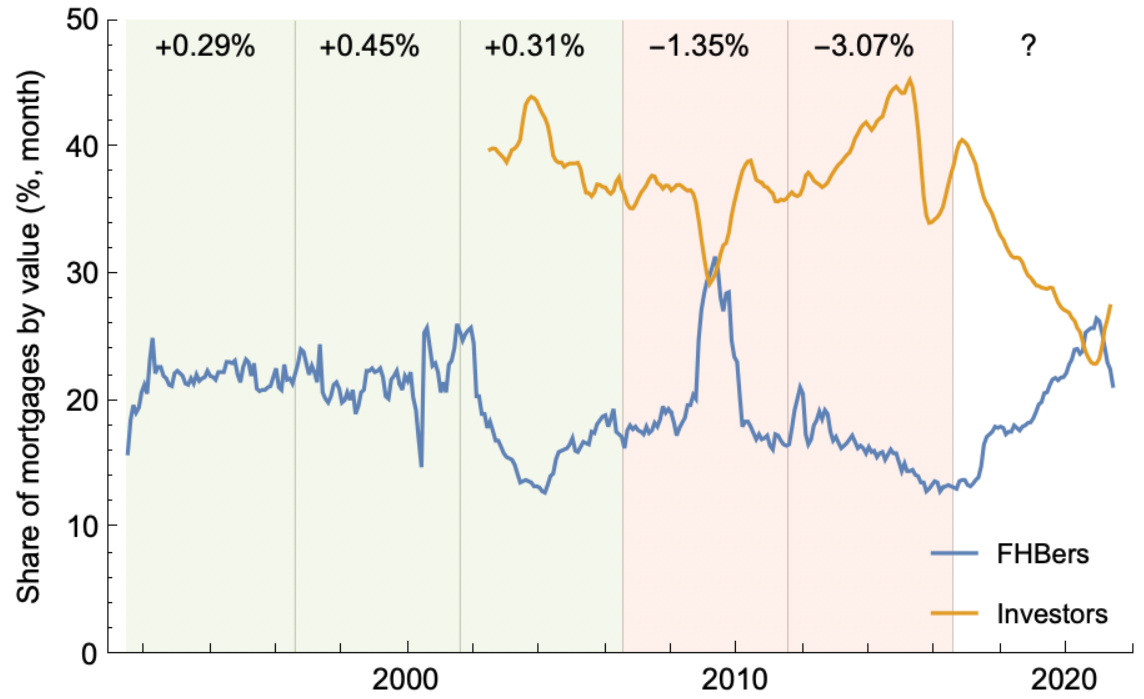
Since there are no available direct records of whether a property buyer is a landlord or first home buyer in any transaction, we can look at the patterns of mortgage finance.
The plot below shows the share of housing finance going to first home buyers and investors (sorry for no pre-2002 investor data).
The green shading shows the census periods with rising homeownership, and the red shading is falling homeownership, with the percentage point change in homeownership marked.
Big jump in FHB mortgages.
Since the last census in 2016, first home buyers have been large a proportion of all new mortgage lending, consistent with the 1991-2006 period of slightly rising homeownership (up from 68.8% to 69.8%).
But the stark change recently is the decline in investor lending in the market since 2016. In the 2011-16 period, investor lending was 39.4%, but since 2016 it has been 30.8% on average. Not buying and selling are somewhat equivalent asset investment options for investors. They both reduce the allocation to housing (just like not selling and buying keep more of an investment portfolio in property). We can then infer that the decline in investor buying is likely related to more investors selling.
This might not be the case. A confounding factor is the change in risk-weighting by banks for investor lending due to the fallout of the 2017-18 royal commission. Perhaps this means relatively fewer investors are selling compared to buying, but the overall level of activity fell substantially.
Another factor worth keeping in mind is the make-up of total households. The recent period of declining homeownership coincided with a period of rapid migration. These new households were more likely to be renters, at least for a short period. Most of this sub-set of renting households, including foreign students and temporary workers, have left Australia since COVID.
This combination of factors is why I am predicting a bounce in homeownership in the 2021 census.