Chris Weston, Chief Market Strategist at IG Markets
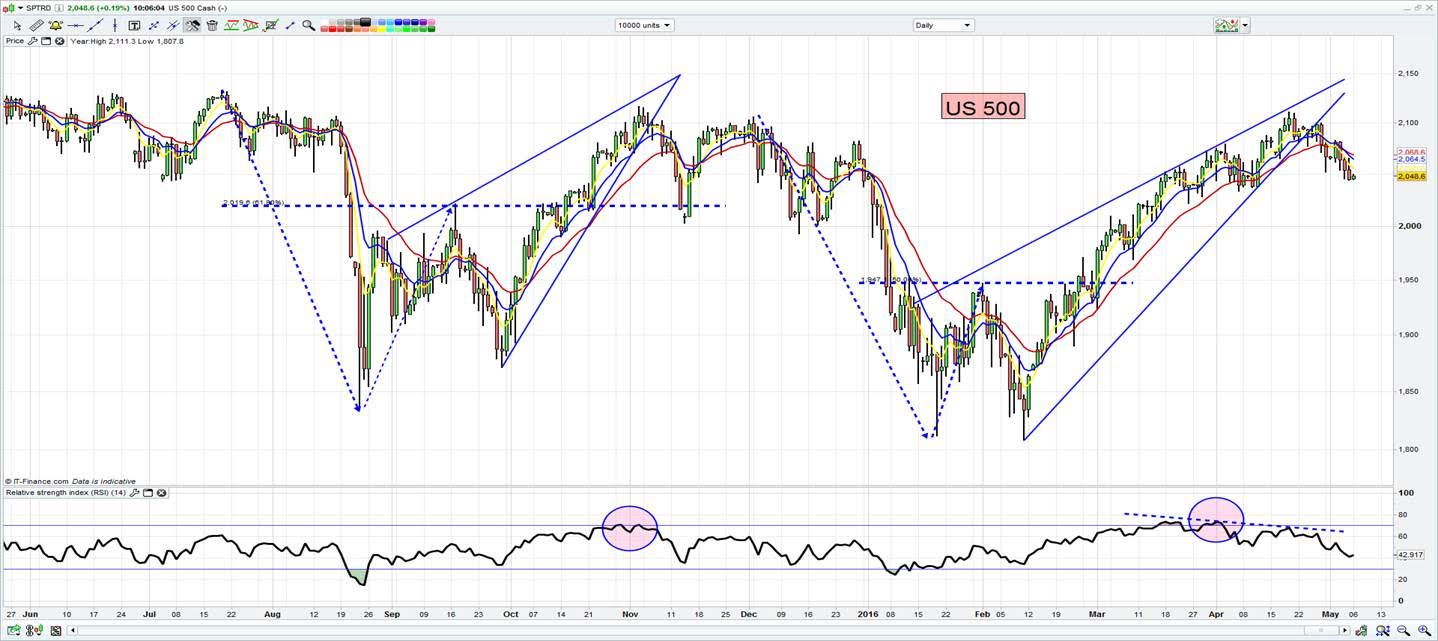
While every trader should have the USD and oil on the radar, I feel this pattern on the S&P 500 is really interesting. There is clear symmetry with the set-up in July to November last year.
Here we can see a 14% decline in the index on both occasions, followed by a counter-rally into a key fibonnachi retracement area. The index then made a strong move higher in a bearish wedge pattern, showing eventual signs of exahustion as the daily ranges contracted. What interesting this time is we have seen price make a higher high in late April, but this was not mirrored in the RSI’s, which made a lower high. This divergence can be one of the most telling signs of an impending reversal and clearly this has played out, with a corresponding move through trend support. The question now is whether we see a 14% lower like we saw in November 2015. My personal view is that the risks of a stronger move lower have picked up and I would be using rallies in the market to look at short positions. It seems highly likely from this set-up that the April high of 2111 is the high point.
Its unclear what would drive a move into 1800 at this stage, but I suspect it comes from a sharp move higher in the USD (see the key trechnical set-up herehttps://www.ig.com/au/forex-news/2016/05/05/usd-technical-idea–it-s-hammer-time—32147) and its destabilisng impact on China and other emerging markets.