
We live in a world of acronyms, and traders are generally aware of commonly used terms such as FOMO (Fear of Missing Out) and FANG (Facebook, Amazon, Netflix and Google). However, we can now throw in TINA (There Is No Alternative h/t HSBC research) and TIME (Tech, Industrials, Materials and Energy). These new terms are thematic of the lack of options that money managers in US are currently facing now and that seems to be the reasoning for further buying in equities and futures today. However, with so many still calling for a pullback, it seems a good idea to really hone in on the US equity market to what is the higher probability move.
The conclusion is that there are a number of catalysts that suggests the S&P 500 is clearly prone to downside risks, but the current backdrop suggests now is not the time to short. That may well change soon though.
Current supportive factors:
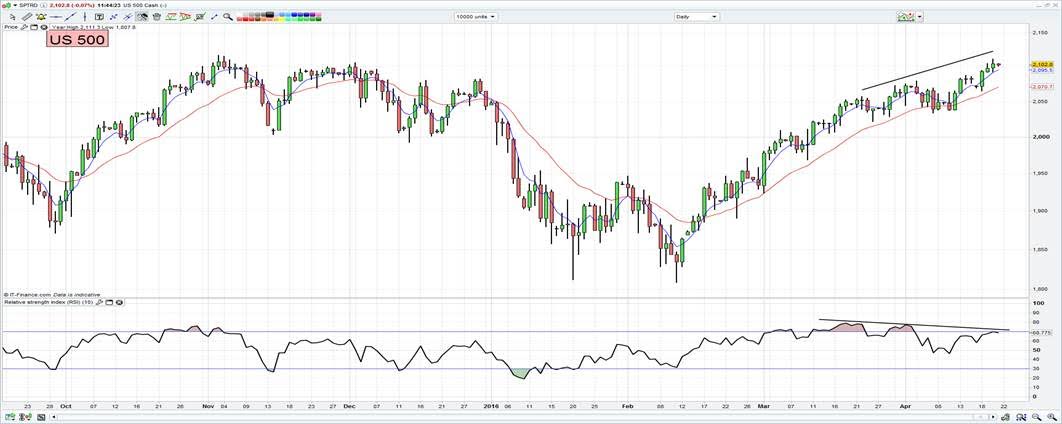
- The trend is still higher and this has to be respected. The S&P 500 being 1.1% from a new all-time high can’t be seen as anything other than bullish.
- On a total return basis (ie. compounding through re-investing dividends) the S&P 500 is at an all-time high.
- Bulk commodities and oil continue are flying. This can’t go on forever, but it’s a freight train and not one I am prepared to get in front of.
- Credit spreads are narrowing.
- Q1 earnings continue to beat a low consensus.
- The VIX (implied volatility in the S&P 500) is at the lowest level since October. Too much complacency?
- US banks are flying. The KBW banking has gained 26% from the February low and 6% from a yearly high.
- Asian markets are breaking out. The bulls are in control at present.
- AUD/JPY (as a proxy of risk) is testing its 200-day moving average. This has been a great level to sell at over the last 12 months. Will this time be different?
Red flags to watch:
- Indecision was clearly in the daily chart yesterday and potential divergence (between price and the RSI) that could play out.
- Market internals are highly suggestive of contrarian positions. Many of the key variables are at levels where the S&P 500 has traditionally topped out.
- US inflation expectations are starting to tick higher and interest rate markets are just not positioned for further moves in inflation expectations.
- As mentioned, the current moves in iron ore and steel prices are unsustainable. Both BHP and RIO officials have talked about this this week.
Looking at these considerations in detail:
The technical picture
No reason to short. The trend is higher and we can see price making higher highs and holding above the five-day EMA (blue line). The red flag I am seeing though is the clear divergence with the RSI (which as you can see is making lower highs) and as you can see from the Bloomberg chart, it has printed a ‘doji’ candle. This divergence and indecision can often mark a turning point in the trend. A move through 2087 would be fuel to a potentially bearish fire.
From a technical perspective, stay long until proven wrong, but I wouldn’t be chasing this rally here.
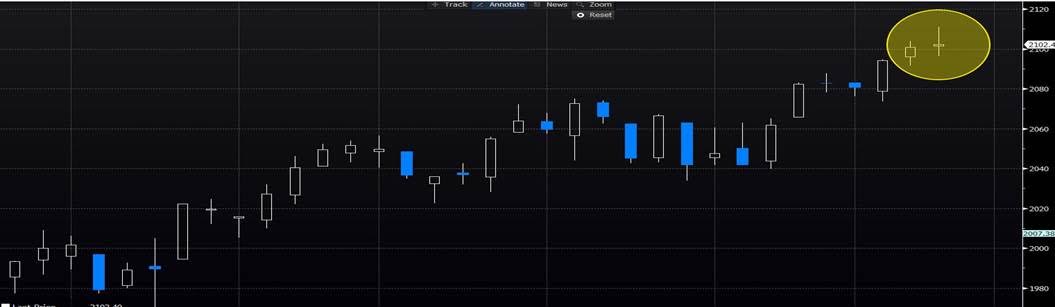
On a more mechanical basis, if I scan the S&P 500 for the stocks exuding the greatest underlying strength (my inputs at stocks above their 5-day average, price closed above the upper Bollinger band and closed at a four-week high), I can see a massive 65 companies. These include BLK, GS, CVX, SLB (reporting tonight), FCX, C, JPM, MS and BAC. Put these on the radar.
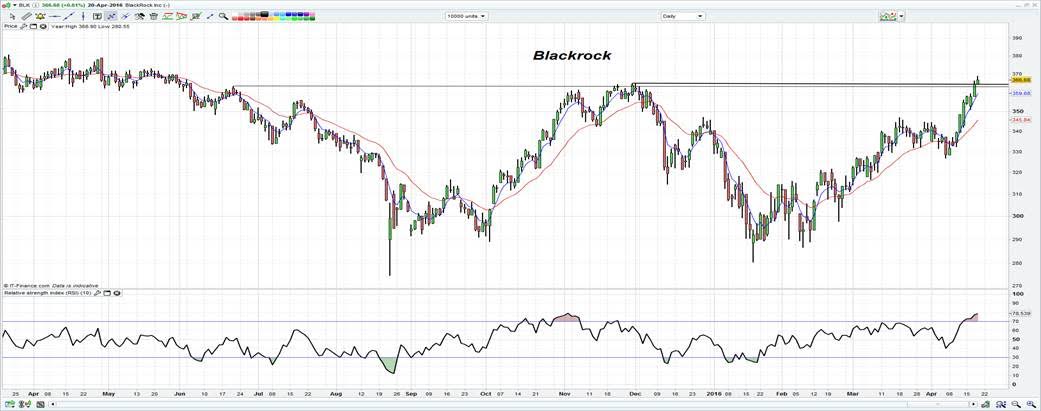
I’ve chosen Blackrock as price has broken out and looks strong. The fact that RSI is so elevated is a red flag though and as seen over the years at these levels we tend to see a strong reversal. Watch price action here as a pullback back through horizontal support could be a shorting signal. I am not one to sell strength myself, so my preference is to be long here, with a stop below $350.
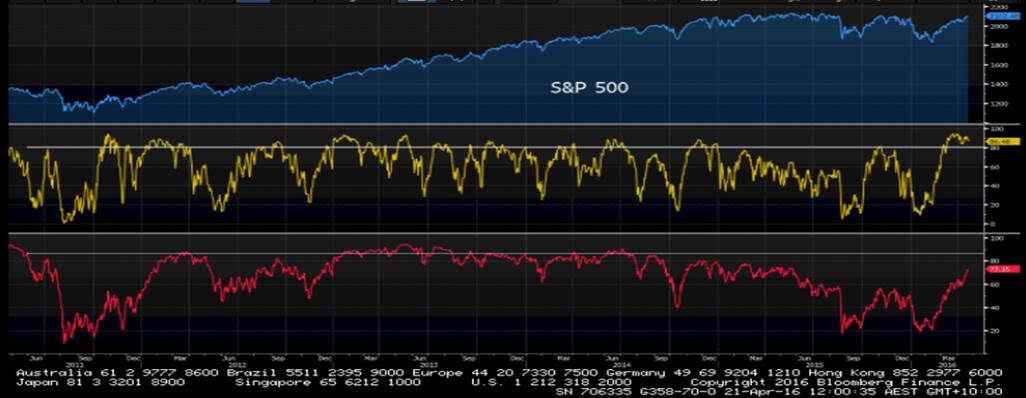
Market internals
The market internals suggest we are close to a turning point and too much optimism is priced in. The percentage of companies above their 50-day moving average (yellow line) sits at 86%, which is one of the highest levels ever. The level of companies above the 200-day average (the red line) is a little more sanguine at 73% (the highest since mid-2015), but this is not at alarming levels.
What is really alarming though is the percentage of companies at a four-week high stands at 55%, which is the highest level since 20141! So in conclusion this throw weight not to chase the rally and that stop on longs could be tightened here.
Brokers are generally bullish (it’s their job to be), but currently a sizeable 19% of S&P 500 companies are now above their consensus 12-month price target. This is one of the highest levels I have seen and dwarfs the 10% of companies above their price target at the prior all-time high on 20 May 2015.
Intermarket analysis
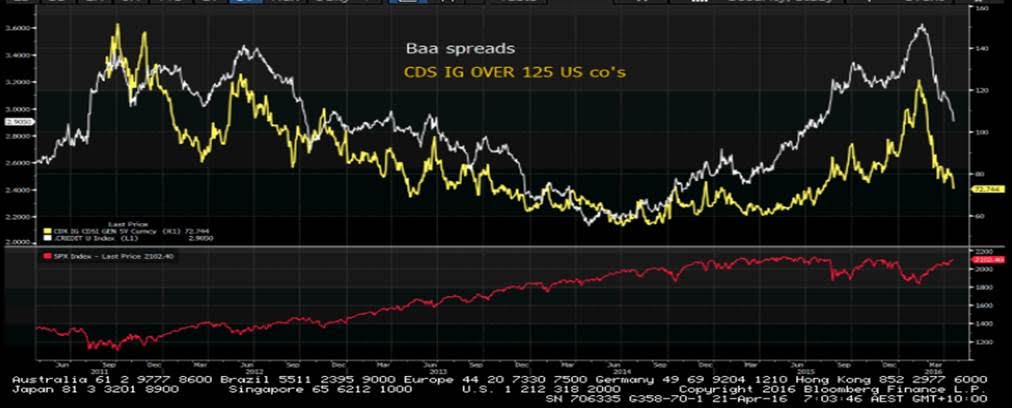
On any given day, credit spreads are one of the best leading indicator for equities. The top pane here suggests the move higher in the S&P 500 has been of a strong quality, with investment grade spreads narrowing relative to US treasures (white line). Looking at the bigger picture, we can see the CDS (credit default swap) over 125 top US corporate is also at the lowest levels since July.
The lower pane (the red line) represents the S&P 500.
To really be convinced to short the S&P 500, one feels we will need to see a sell-off in corporate credit. This would be the trigger for a stronger correction in US equity markets. Credit tends to lead equities.
 x
x
US earnings
Earnings have been another supportive factor and after 17% of companies have reported quarterly earnings, 85.5% have beaten the street’s (remarkably lowered) expectations on EPS, beating the consensus by an average of 4.6%. On the sales line, 60.2% of companies have beaten expectations. The interesting divergence here is that aggregate earnings have fallen 10.8%, which is currently in-line with estimates for the full earnings season.
Ahead of the open IG are calling the FTSE at 6425 +15, DAX 10517 +96 and CAC 4627 +36