
by Chris Weston, IG
We close out Q1 on a generally upbeat note, and what an absolute ride it has been. Clearly a tale of two halves defined by a belief that the capital markets were staring at an all-out collapse, led by a fear that a Chinese CNY devaluation would spark the mother of all currency wars. Meanwhile, central banks were supposed to be out of ammunition and had little to prop up the disinflationary pressure.
Fast forward 32 trading sessions and the S&P 500 is at the year’s high, emerging markets (which were supposed to have collapsed) are greatly outperforming (with Brazil up 30%), the AUD/USD has traded above 77, credit spreads have collapsed and the US yield curve has started to steepen. The Fed has enforced itself as the world central bank and the USD is grinding lower, along former channel support. The PBoC have even strengthened the CNY by 229 pips today and therefore a sizeable 620 pips in the last three days!
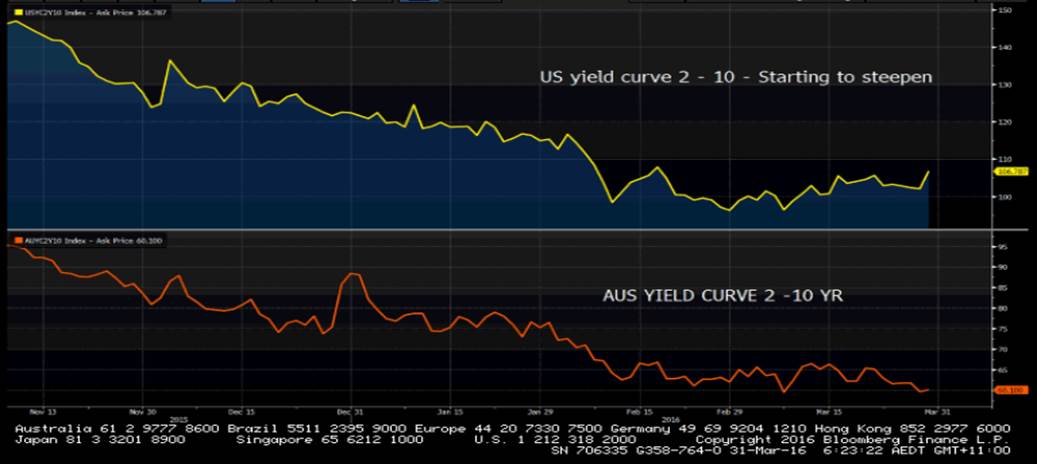
Chart 1 – The US curve is steepening. This is equity positive.
The world is seemingly a perfectly pleasant place to be, led by Janet Yellen who has left traders with a growing view to avoid listening to regional Fed members and totally focus on her comments – and perhaps those of New York Fed President Bill Dudley and Lael Brainard (Board of Governors). The communication has almost become Greenspan in nature and in a world of peak noise, this has to be seen as a positive.
The ASX 200 has clearly lagged of late (as we can see in the ASX/MSCI World ratio), but on the quarter as a whole (and pricing all markets in USD’s) the index is actually up 0.4% on the quarter and outperforming. Compare to the Nikkei -5.2% (in USD’s), FTSE -3.3% and China -14.5%, shows that things aren’t so bad. In AUD terms, the ASX 200 has lost close to 4% and the trend is lower. We can see this best on the weekly chart where the index is printing both lower highs and lows. The industrial and material sectors have gained 4.7% and 4.4% respectively this quarter – there are not many who would have predicted this. When something feels wrong, it’s probably right in this market!
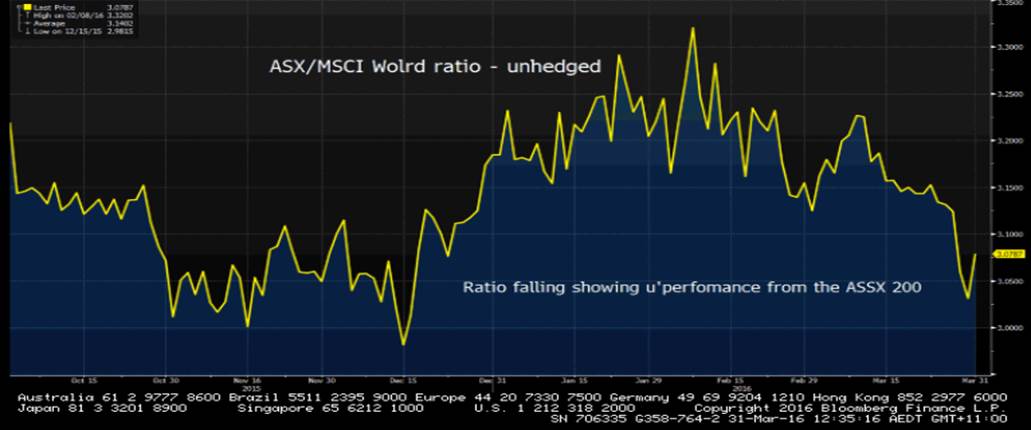
Chart 2 – ASX/MSCI World ratio. A downward move implies underperformance from the ASX 200.
Going into mid-February the financial community were effectively thinking about capital preservation and a return of their capital. Many asset markets were thought of as return free risk. Now, in many ways, portfolio managers are entering Q2 and the need to drive outperformance (or ‘alpha’) is even higher than it has been, because how many would have not fully participated in the risk rally? Clients will be turning to fund managers and seeing some monster underperformances, while many of the passive funds (that track benchmarks) would be seen as the better place to be. This has probably been the quarter to make or break reputations. The term ‘buy fear’ sums up the quarter well.
We now eye the new quarter through reinvigorated eyes. Despite this fairly upbeat tone, there are reasons to feel that bouts of strong volatility will be seen.
The daily chart of US crude is eyeing a break of the recent trading range. A close through $38 would suggest $35.
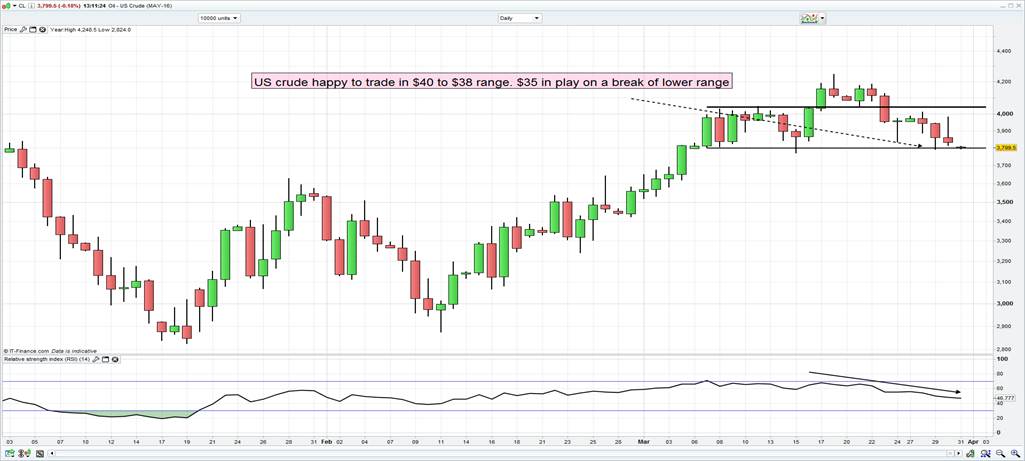
Chart 3 – US crude eyeing a break of the lower trading range.
The daily chart of high grade copper has not only broken the March trading range, but also the 38.2% retracement of the February to March rally. Short positions are preferred.
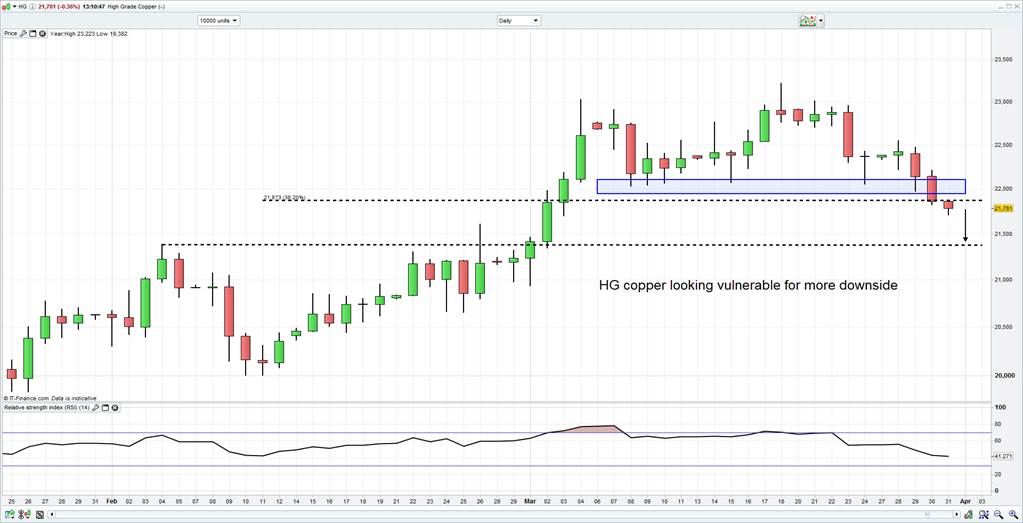
Chart 4 – High grade copper
The iron ore chart looks vulnerable to more downside. How closely will the RBA be looking at this chart with the AUD/USD at $0.7650?
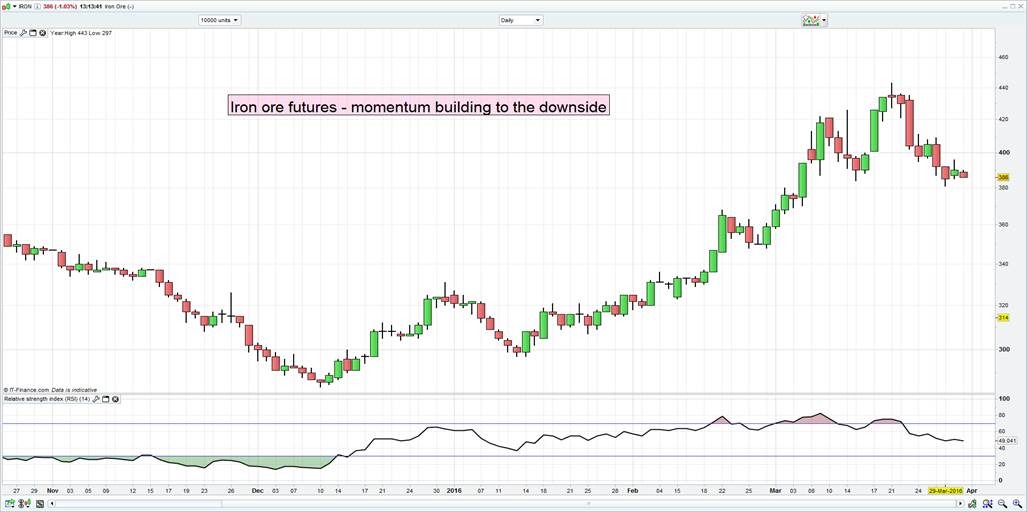
Chart 5 – Daily chart of iron ore futures
Let’s not forget the extremely elevated market internals, the VIX at 13.5%, a number of political issues to navigate, plus US Q1 earnings season starting 11 April. I still think Japan holds the greatest risk though, although the underlying issues will not hit home in Q2. Keep in mind that we saw no trades in the Japan 30 government bond yesterday and Japan has one of the biggest bond markets in the world. At the same time the Bank of Japan own most of the outstanding government debt, while foreigners sold record levels of JGBs last week. I’m still unsure how this will end well, especially when the Bank of Japan refused to buy certain Japanese commercial papers because yields were too low (-0.64bp).