
Australian banks have dragged on the ASX 200 and the note from Goldman Sachs regarding ‘funding dilemmas’ is not helping the space. It must be said though, volumes through the market have been pathetic. The rest of Asia have barely moved today and this seems in-line with the low volatility globally. The term ‘never short a dull market’ is resonating and this is probably true even though the market internals suggest contrarian positions. What we are seeing at present is about as dull as one will see. As detailed yesterday, it could be the shortened week, but it feels like market players have entered the saloon and tumbleweeds are rolling down the street.
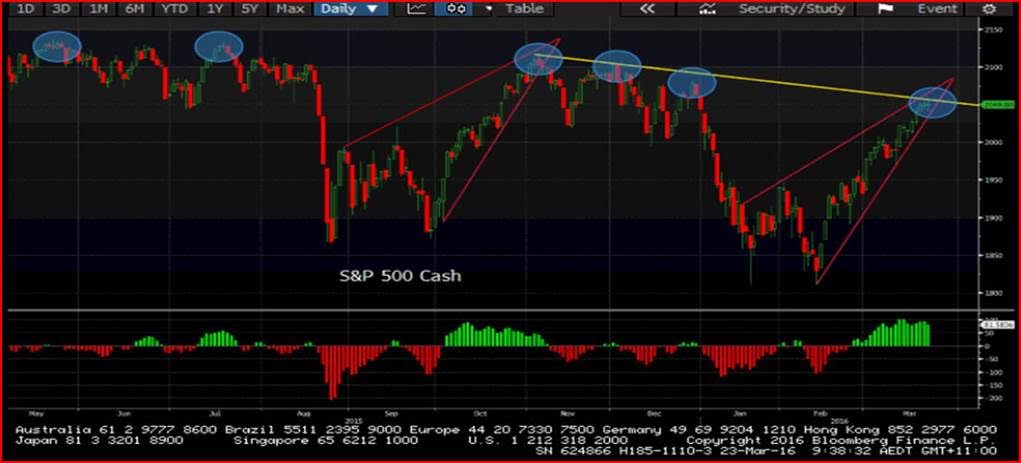
The daily chart of the S&P 500 perfectly shows the key juncture the market is trading at (see chart 1). I suggested yesterday that there were red flags in the market internals, but price is still trending higher and desperately needs to break through the October downtrend. The best mindset is to hold a ‘neutral’ stance on the market, effectively waiting for price to break above the October downtrend (yellow line) or back through trend support. Having patience is essential and I am happy to let the market push me into a position rather than prophesise. Remember, this year has generally had a theme of whatever’s feeling right is probably wrong, and right now nothing really feels right!
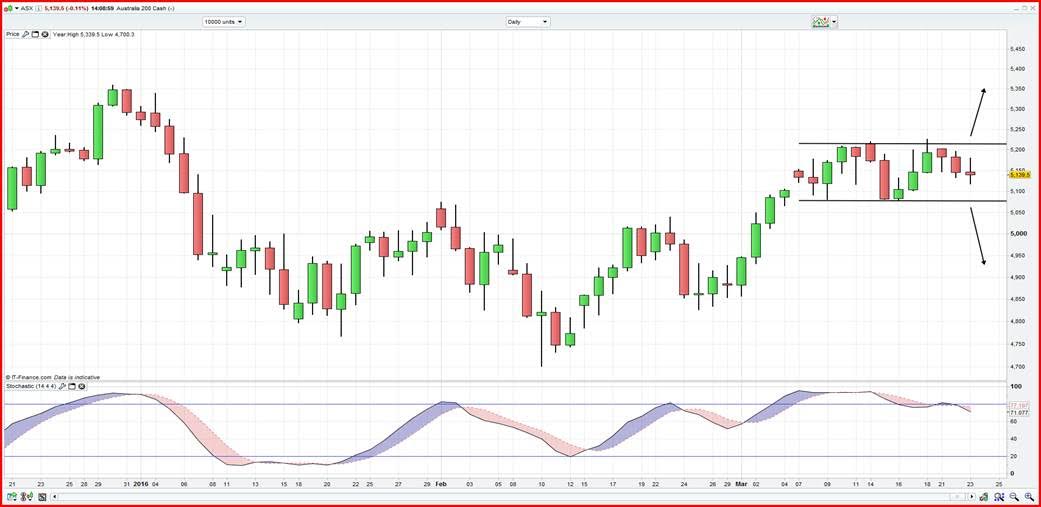
The daily chart of the ASX 200 is also showing indecision. I would be a buyer on a move through 5200 or shorting below the double top neckline at 5077.
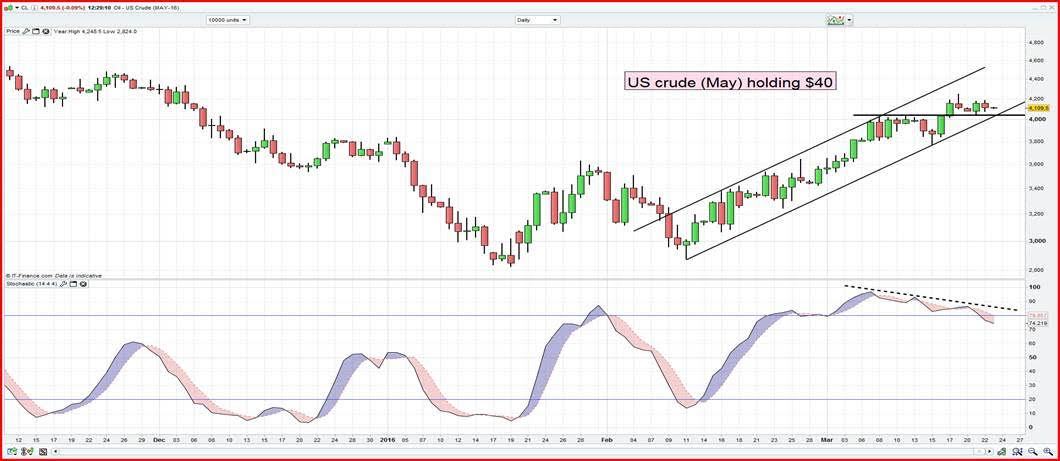
Moves in US crude optimise all we have been seeing with a Teflon market that feels like it should be short but no one being prepared to act. We saw an 8.8 million increase to the American Petroleum’s Institute inventory data, but front month continues to trade nicely within the bullish channel. At 01:30 AEDT we get the more important Department of Energy’s inventory data, with the market expecting 2.48 million barrels (range 4m to 1.25m barrels) of additional inventory. I’ll go out on a limb and guestimate that the number will be modestly higher at 3.5 million barrels but, similar to the US or Aussie payrolls report, forecasting is impossible. Keep an eye on both gasoline inventories and demand – both have been highly inspiring as demand is trending higher. A break of horizontal support at $40.40 and channel support at $40.00 would suggest looking at short positions, for a move into $37.60 (15 March low) as first target.
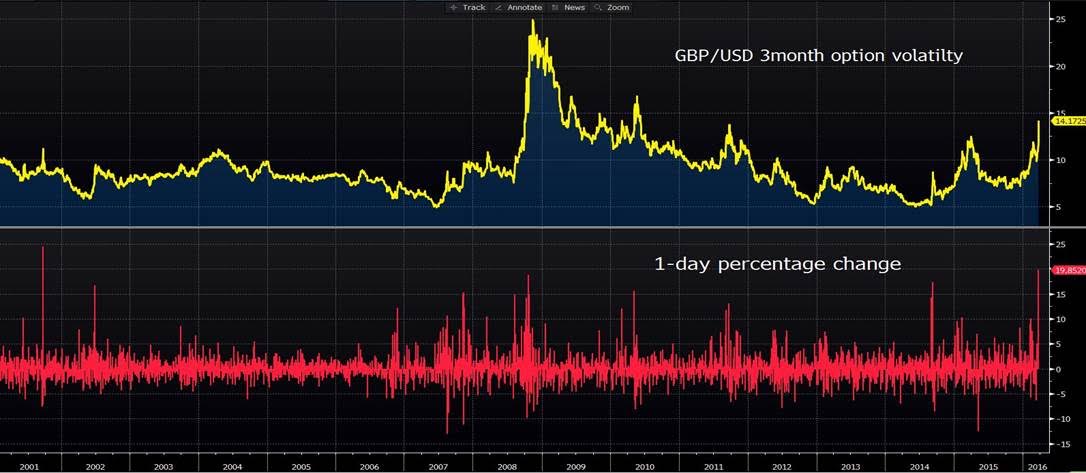
Perhaps the asset that has moved the most and has the most interest is sterling. The market more broadly has become very excited about the ability to buy downside protection on GBP for the EU referendum through three-month expiries, given today means this expiry encapsulates the 23 June vote. Of course, traders could have traded longer dated options, but the time premium is costly.
What we have seen today has been pretty staggering, with GBP/USD three-month implied volatility spiking 20% to the highest level since 2010. What’s more, the 20% increase was the biggest one-day move since 2001! Clearly the shocking events in Belgium have seen traders fearing a higher chance of ‘Brexit’, although the betting markets are priced at around a 36% chance. Many have simply seen the Tory party in all sorts of strife after last week’s budget and showing little solidarity. Comments from Moody’s about the pace of fiscal consolidation haven’t helped either.
The sterling is looking awful and there seems little doubt that there will be a time to buy the currency. It takes the bravest of souls in this market to do so. As with any market, when there are no buyers, the path of least resistance tends to be lower.