
Chris Weston, Chief Market Strategist at IG Markets
There is an uneasy calm that descended on the world’s financial markets. While volatility has been drastically reduced since February, there are a number of red flags that traders should be looking at. This could be the time for contrarian trading, although price has yet to really respond.
Certainly central banks will be highly enthused by the grind higher in risk assets, as importantly inflation expectations have moved modestly higher too. The concerted efforts from central banks to remove a number of key macro headwinds has been assisted by the holiday shortened week.
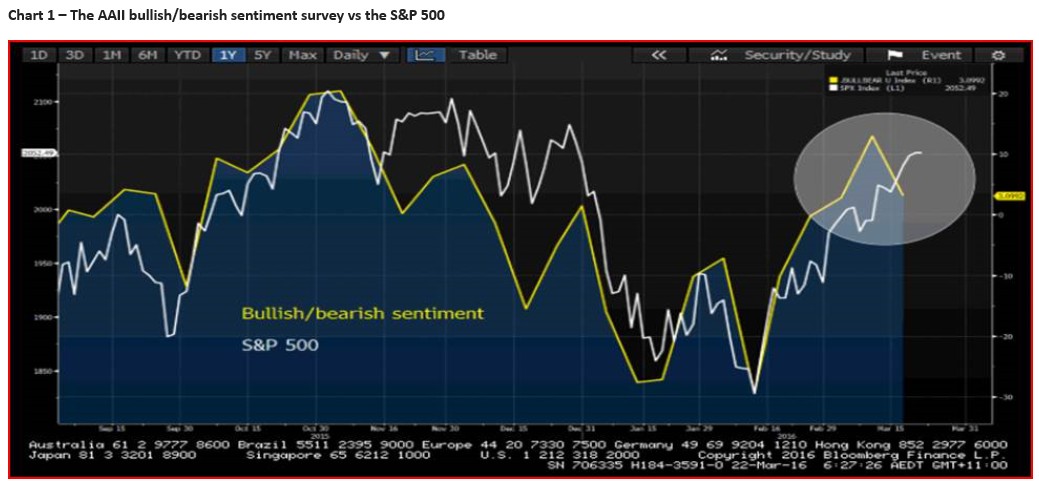
One has to question though what will be the catalyst for a collapse in risk sentiment though, and other than political issues there doesn’t seem a lot to really promote strong downside. Consolidation seems likely. If we look at investor sentiment (I’ve looked at the ratio of AAII bullish/AAII bearish sentiment – the yellow line on chart one), we can see bearish sentiment is accelerating. This is not a reason in itself to short the S&P 500, but it does suggest a number of market participants are seeing the upside harder to come by. I would echo this view.
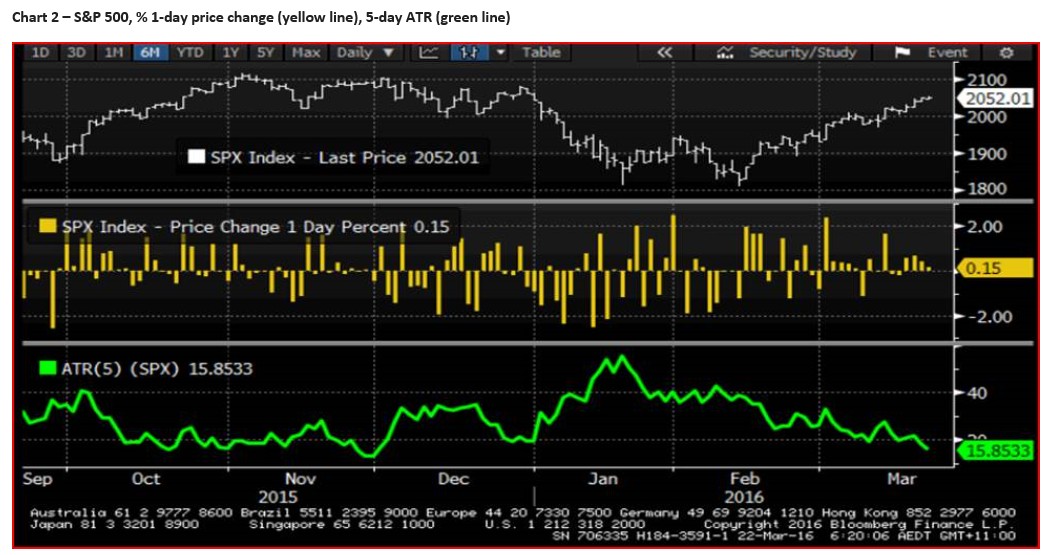
Interestingly, 92% of S&P 500 companies are above their 50-day moving average. On one hand this shows great participation in the rally, but this is also a level where the contrarian in me says ‘sell euphoria’. The fact that the five-day average range (ATR) is a meagre 15 points (chart 2 – the green lower pane) and the Dow Jones 145 points is concerning, especially when put into context that the VIX (US volatility index) has fallen for eight of the last nine sessions. The fact that many market internals are so elevated while implied volatility is at such low levels makes me uneasy.
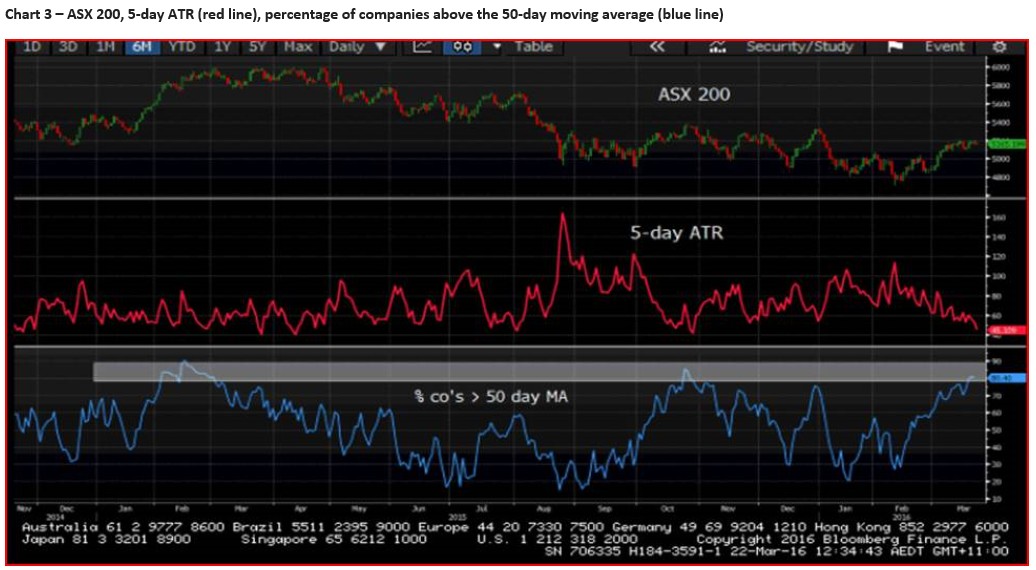
In Australia, the ASX 200 is also in a similar position with a highly elevated 80% of companies above their 50-day average and the average five-day range at the lowest level since July. These conditions are at levels where the index has reversed on a number of occasions.
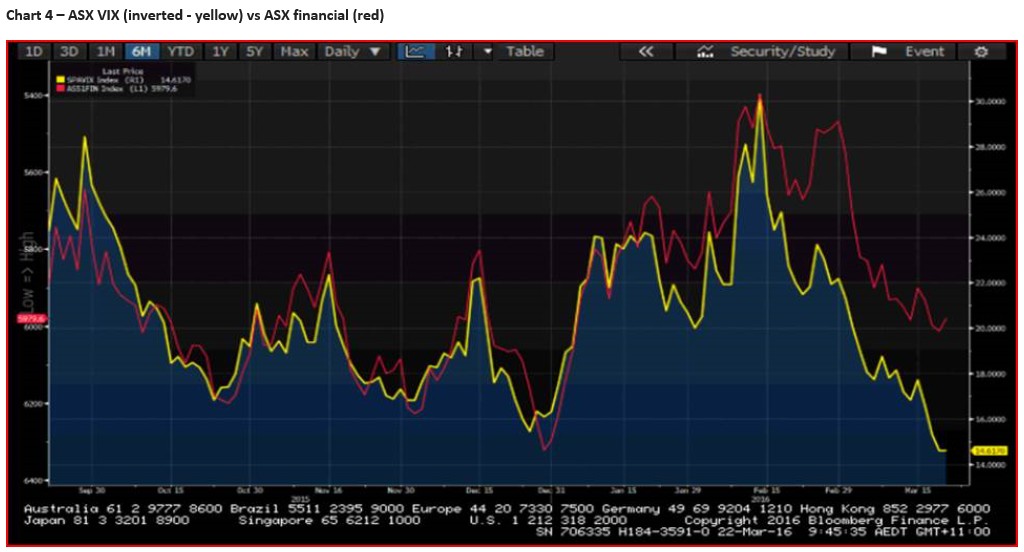
The ASX volatility index is at the lowest level since July and at 14.6 is now at a 24% discount to the 12-month average. This low level of implied volatility in the equity market has been positive for domestic yield plays, with the ASX financial sector a key beneficiary. Here I have flipped the financial sector around to better show the correlation between low volatility and the hunt for yield.
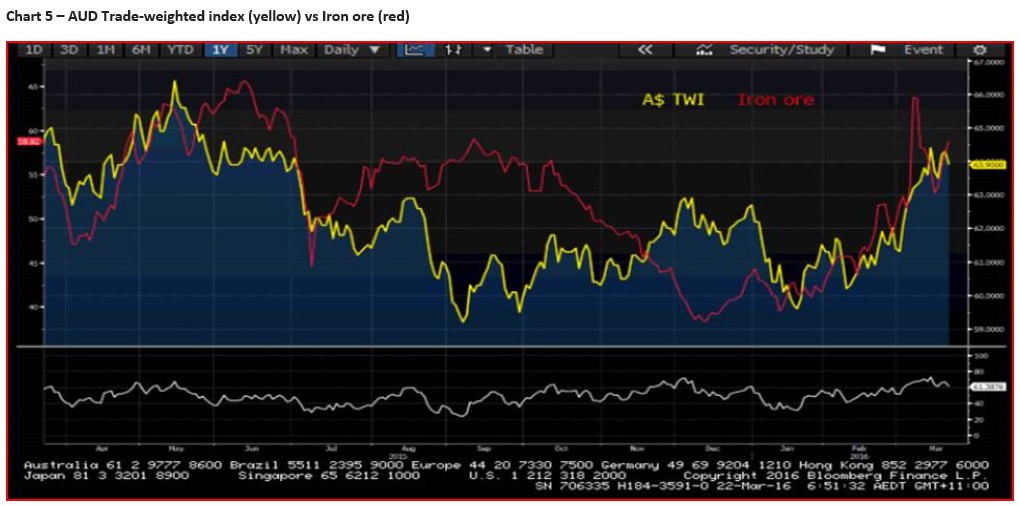
Another key beneficiary has been the AUD, although the rise in iron ore, steel and energy has also been a key tailwind. All eyes are on Glenn Steven’s who has the opportunity to somewhat talk down the AUD at 16:15 AEDT, although he would be facing the wrath of the US treasury again, especially as the trade-weighted AUD has benefited from rising terms of trade (see chart 5).
The market is still pricing in rate cuts, but obviously much less than a month ago. There is now a 28% probability (using the swaps market pricing) of a 25 basis point cut by the June meeting, which is down from 41% from a month ago. One can assume that a strong number in the 28 April Q1 CPI print and this probability comes right out of the market, although we have the budget to contend with too.
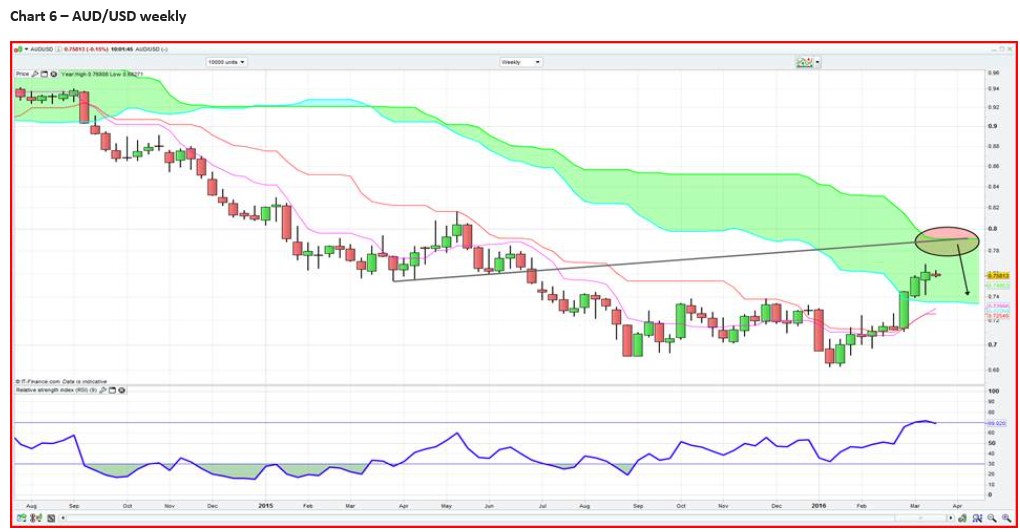
The AUD/USD is in similar position as the S&P 500, and is in need of a new catalyst (in either direction). A number of the daily momentum indicators are starting to roll over and I suspect downside will be driven by the S&P 500. (Dalian) iron ore futures are 1.1% lower today and the PBoC ‘fixed’ the CNY 147 weaker today and both are strong headwinds, although we haven’t seen much in the way of AUD selling. My conviction to short AUD/USD is best seen on the weekly chart, where we have a confluence of strong resistance levels into $0.7800 to $0.7850 and rallies over the next week or two should be sold here in my opinion.
Ahead of the open IG are calling the DAX at 9940 -8, FTSE 6180 -4 and CAC 4428 +1