
The claim of an Australian land and housing shortage is a myth of epic proportions, perpetuated by vested interests across the media landscape. An Internet search for the phrase ‘Australian land shortage’ produces a deluge of pronouncements confirming this view.
Those with an intimate knowledge of property-related data, or with experience in the development industry, can tell you that the alleged housing shortage is fiction. It is in the developers’ best interests, however, to remain quiet and reap windfall gains from beneficial rezoning (surely betterment taxes should be imposed on that?). The imagined scarcity of housing is promoted by think-tanks and other vested interests, and follows a familiar script:
Australia is not producing enough new land for housing due to policies pursued by state and local governments that prevent land supply and land use from responding to price signals. In fact, the supply of new land for housing has declined over the last decade, with the average number of lots produced in the five largest capital cities declining by 21%. The decrease in the supply of new land has not surprisingly seen an increase in land prices.
Everyone is familiar with varying forms of this argument that are ceaselessly promoted by think-tanks and housing lobby organisations. Unfortunately for the vested interests, it is nonsense. For an abnormal surge in housing prices to be attributed to supply constraints that arise from town planning regulations, the following events must have occurred:
- Rents must rise relative to household income (the rent to income ratio), for if fewer homes are built, tenant bidding wars for scarce shelter must result in a higher ratio.
- Real rents must increase (the nominal rent to inflation ratio), as supply is squeezed by regulations that restrict the number of new dwellings.
- The occupancy rate must rise, as a lower dwelling construction rate results in more people per property.
- The council approval rate for new dwellings must fall.
- The rate of new construction must decrease. If government meddling prevents developers from building, the ratio of new housing construction to recent arrivals in a town, city, state, region and/or country must rise.
The following data tests these assumptions taken for granted by most economists. In the figure below, the top panel shows the mean housing rents and prices in five of the larger Australian states, while the bottom panel displays mean housing rents and prices relative to incomes. In these states, the rent to income ratio during the 2000s is approximately the same as throughout the 1990s, but the price to income ratio has risen.
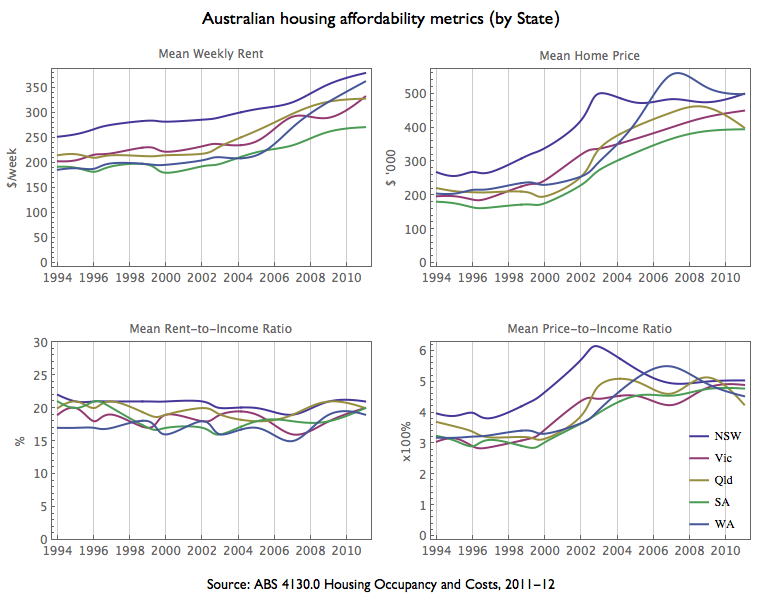
RBA statistics reveal the rent to income ratio actually fell during the late 1990s through to the mid-2000s, despite the unprecedented inflation in housing prices. After 2007, the ratio increased, but has remained under the peak established in 1999. Furthermore, the rent to income ratios for all income quintiles has remained steady during the housing price boom, except for a slight increase in the lowest income quintile.
Regarding the second criterion, real rents were trending close to zero during the late 1990s, and even turned negative during the early to mid-2000s as housing prices boomed, invalidating the assertion that supply shortages were squeezing the number of new dwellings.
The third criterion of the mainstream account also withers under scrutiny, for the occupancy rate (persons per household) has continued to fall during the boom, hitting a record low in 2007 at 2.72 before flattening out. This trend is in line with similar developed nations and has persisted, despite the average size of residential dwellings increasing to a record high.
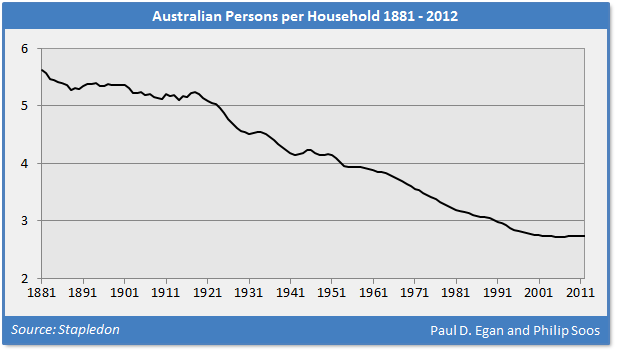
The ratio can only fall so far, constrained by the social dynamics that affect family households and shared housing arrangements. The ratio of dwellings to people will never approach a one to one ratio, even when considering the surplus housing stock comprised of long-term vacant properties, second homes and holiday houses, and the extremely large size of the average Australian home.
Available data to assess the fourth criterion (housing approvals) also paints an interesting picture. For instance, South East Queensland provides an excellent measure – ‘Stock of lots approved by Council’ – that covers the early 2000s boom. Between 2000 and 2004, annual approvals increased from around 10,000 to 24,000, while the stock of approved but undeveloped lots surged from 25,000 to 46,000. If councils and planning controls really constrained development, the pattern should in fact be inverted.
Finally, in relation to the fifth criterion, the methodology often employed by economists when examining dwelling construction is faulty. New dwellings are sometimes compared to the existing population base, resulting in a downwards sloping trend. One could just as easily generate a rising trend by comparing the flow of new population against the existing dwelling stock (see here for an example). Further, measurement of the absolute and relative change in the number of dwellings constructed is pointless, for it says nothing about the change in population.
Flow to stock comparisons are occasionally valid, but it is nonsensical in the case of new supply. The existing (housed) population cares little about the availability of new dwellings, whereas it matters a great deal to the new net inflow of persons migrating into a city, town, region, state, or country. Australia has a relatively high home ownership rate of 68 per cent, with owners moving every decade on average.
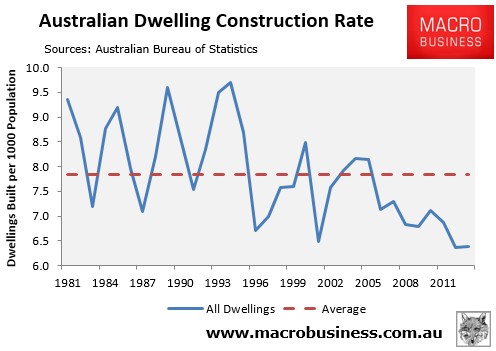
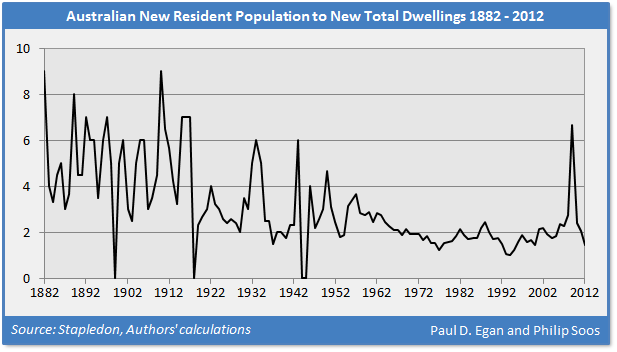
Contrary to common perception, Australia has experienced a blistering rate of dwelling construction. From 1981 to 2013, Australia produced an average of one new dwelling per 1.76 new persons. Over the course of the housing price boom (1996 to 2013), the ratio is still a remarkable 1.93 – still way below the average 2.7 persons per existing household.
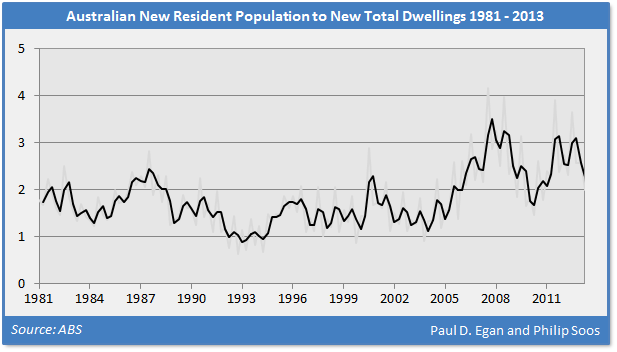
Due to moderate volatility a 2-period moving average trend line has been applied to smooth the series. The ratio is actually overstated, because it compares the new estimated residential population to new construction. A more appropriate measure would only include adults because children don’t purchase homes, make mortgage payments or pay rent, and it ignores increasing size of existing housing true to renovations and extensions.
Over the long-term, the post-WW2 ratio exhibits less volatility as a consequence of implementing stringent town planning regulations, perhaps by reducing uncertainty (a ratio of 2.0 between 1946 and 2012 compared to 3.8 between 1881 and 1945). This era also has a lower average ratio than pre-WW2, though this may be partially explained by more accurate data post-WW2. The supply of new housing has improved dramatically and remained responsive in the post-WW2 era in defiance of stricter planning regulations.
In contrast to the conventional supply argument, Australia has even out-built Texas, typically advocated as the ideal of supply-side efficiency. Between 1990 and 2012, where comparable data are available, the Australian and Texan ratios averaged 1.85 and 2.86, respectively. Over the course of both housing booms between 1996 and 2006 (the peak of the US bubble), the Australian and Texan ratios averaged 1.88 and 2.20, respectively.
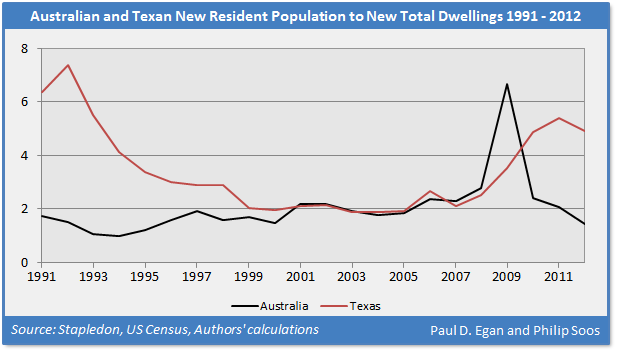
When Australia and Texas experienced downturns during the GFC, the ratios in both countries increased, though more significantly in Australia’s case, leading to a sharp peak in 2009. Australia’s housing bubble failed to burst, following banking and housing interventions by the Rudd government. Consequently, the rate of construction has resumed its long-term average.
The comparison of the ratio of new population arrivals to new dwellings has some interesting implications for those blaming developer land-banking and other non-competitive practices on restrictive supply-side regulations. If the supply of new housing is being artificially constricted in Australia, how many new dwellings should developers be constructing? Should it be one new dwelling per new person? Ten new dwellings?
Fortunately, developers are run by businesspersons who are finely attuned to the real world functioning of property markets. Quaint notions of neoclassical equilibrium theory are discarded; such as the assumption the real estate market should operate in a perfectly competitive manner, with plots of land and dwellings modeled as if they come off a factory assembly line like candy.
In reality, developers carefully assess market conditions and make future trend estimates in an environment of uncertainty. They will certainly not imperil their future profits by constructing an absurd amount of dwellings in response to high prices. Rather, land banks are used strategically, in spite of the clamor against these practices.
The totality of the data discredits the mainstream housing shortage argument. In particular, the rent to inflation and rent to income ratios provide compelling evidence, alongside the occupancy rate. Apart from a few years during the GFC, both ratios have remained steady and/or even fallen for the most part during the housing price boom between 1996 and 2013. The data reveals the supply of dwellings has remained responsive and generally fulfilled the needs of a growing population, even as regulatory burdens have increased.
Conventional economic theory makes no allowances for private debt, land rent, speculation, bubbles, irrationality, instability and uncertainty – the characteristics of real world property markets. Yet, this has not prevented a number of economists from claiming that accelerating private debt results in greater volatility in restricted land markets.
This schizophrenic approach is inherently contradictory: on the one hand accepting that markets operate (correctly) according to disequilibrium price dynamics, but simultaneously modelling real estate markets as if they operate according to equilibrium price statics. Markets must be modelled with one or the other, not mixed and matched when convenient.
As equilibrium econometric modelling does not account for the role of accelerating private debt on asset (land) prices, a causative relationship cannot be established between supply factors and prices, only a tentative correlation. Even then, a thorough analysis of the data leads to misgivings about the role of restricted supply, with a strong rate of dwelling construction over the long-term in the midst of a supposedly strict town planning system.
The same cyclical pattern is found in the stock market, evidenced by the recent Dot-Com bubble which was the largest of its kind. What supply-side factors generated that enormous bubble in the virtual world? For centuries, developed nations have experienced recurring stock market bubbles irrespective of the regulatory environment. Thus, in a manner analogous to the real estate market, it would be absurd to blame high share prices on regulation, for instance, the government curbing the supply of new stock via IPOs.
Australia suffers not from a lack of supply, but high housing prices – seemingly contradictory if one abides by conventional economy theory and the standard account of town planning. Housing prices are abnormally high due to a bubble generated by financial deregulation and generous tax expenditures.
Even with plentiful supply, concerns over affordable housing, however, are still valid. The bottom 40 per cent of households by income has always struggled; it is not a recent phenomenon. Higher social welfare payments, rent controls and a greater supply of public housing would help to ameliorate affordability issues for the poor.
In conclusion, Australia has built a persistently responsive supply of new dwellings, relative to the flow of new net population. There has neither been a housing construction boom nor crash, but a healthy rate of supply at around one new dwelling for every 1.8 persons in recent decades. Assertions of a housing shortage and/or restricted supply are not supported by long-term data and a host of metrics.
Comments and data provided by Paul D. Egan and Philip Soos