
Yesterday the ABS released the new basket of goods weights for the CPI and the Analytical Living Cost Indexes (ALCI). This draws upon changes agreed during the 16th Series review with weighting revisions in all groups using the results from the 2009-2010 Household Expenditure Survey (HES), which surveys the expenditure patterns of almost 10,000 households over an eight week period (in a rather onerous fashion).
But they side-stepped the main game of improving the methodology and weighting for housing costs, despite numerous submissions on this matter (for example this excellent submission from Rob Bray). Moreover, the outcomes of the HES that feed into the CPI weights continue to be used in a deceptive manner.
The main changes to the CPI were in the financial services, with reduction in weight to the costs of deposit and loan facilities (and a return to a previous definition of this group) and ‘other’ financial services dropped from 7.8% to 3.6% of the basket. Other financial services include taxes on property transfers (stamp duty), stockbroking services, legal and conveyancing services, and real estate agent services. My view is that this change is an improvement.
So what happened to housing? You can see in the table below the changes to the weighting of all groups in the CPI.
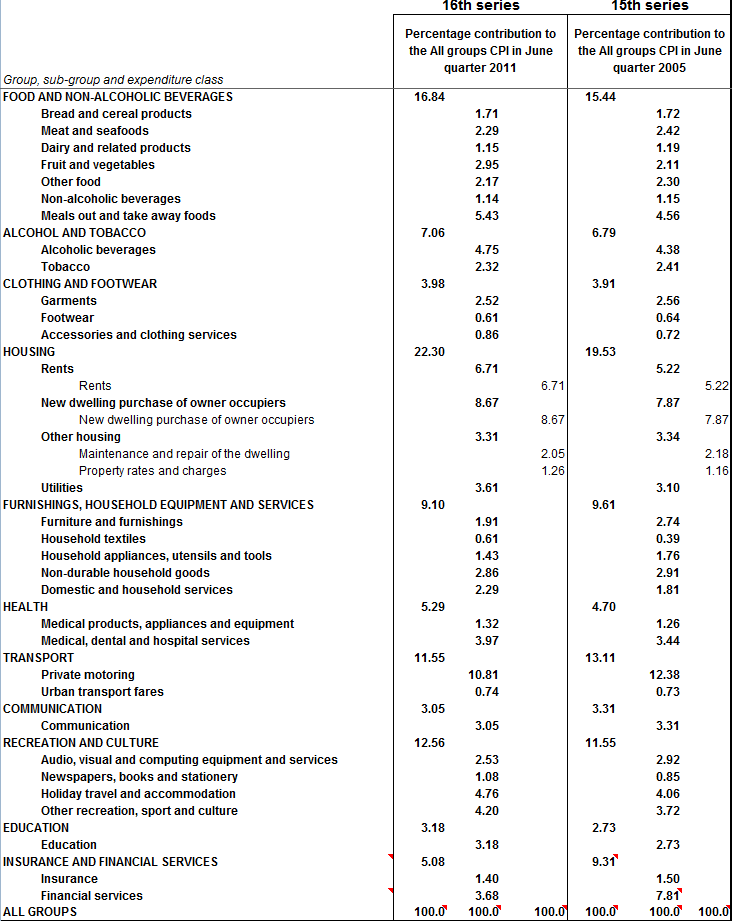
The big change in housing is that purchase of new homes increased by about 1percentage point, while rents increased by 1.5 percentage points. Remember, this is just the construction cost of new homes, and won’t be significantly affected by land price deflation until it has an impact on construction wages and materials costs.
Of course the weighting is still very low due to the exclusion of land or an imputed owner occupied rent (as previously discussed).
The more interesting change is to the ALCIs which actually includes mortgage interest in the cost of living (although with a questionable gap in the series from 1998-2003).
For the employee ALCI, the weighting for housing, including interest charges, increased from 20% to 24.8%. Remember, the latest HES survey took place in the 2009-10 financial year – a period when mortgage rates averaged 6.4%. In 2008-09 mortgage rates averaged 7.6%, as they did in the 2010-11 year. Had mortgage interest rates been more reflective of recent averages, the weighting would have been 2.2 percentage points higher, or 27% (including utilities). To me, this should be the ballpark for the weighting to housing in the CPI.
Nevertheless, it is interesting to see how the subtleties in the HES data can lead to a misleading image of the cost of housing to the average Australian household.
The RBA’s Phillip Lowe made a speech yesterday where he presented the following graph and offered this surprisingly frank comment – The bulk of this change took place over the past decade and largely reflects the rise in interest payments on mortgage debt due to higher levels of debt relative to income.
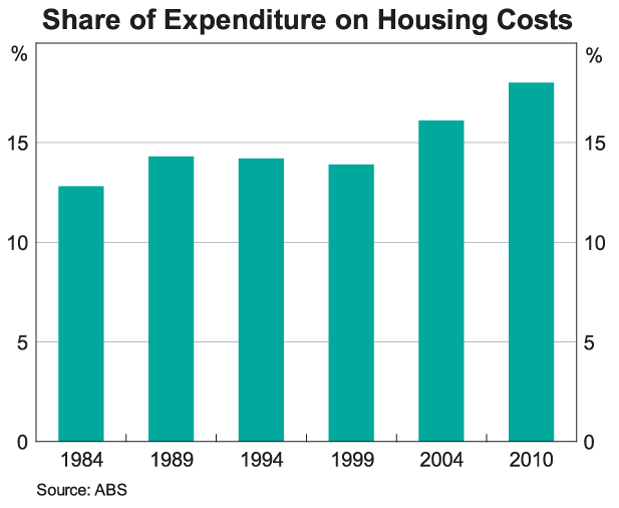
While his general conclusion that the change over time is a result of increased mortgage debt relative to income is true, the scale is deceptive.
The RBA graph excludes mortgage principle repayments, and takes advantage of the record low interest rates in 2009-2010 when the latest data was recorded. If we instead use the full current housing cost data in the HES for employee households including mortgage principle repayments, and adjust the interest rate in the 2009-10 survey to be more representative of the average around this period, we get the following chart.
*Includes current housing costs, plus mortgage principle divided by total expenditure for employee households.
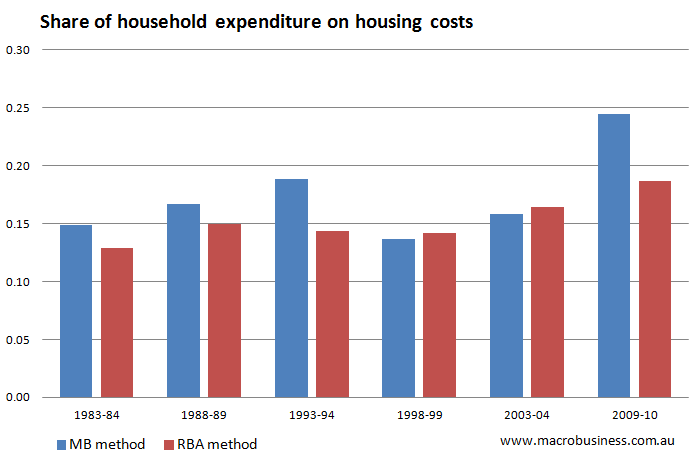 The appropriate coverage of housing costs paints a more troubling picture. Especially given the massive interest rate cuts required in the 1990s to stabilse home prices while reducing the share housing costs in the household budget.
To properly assess the true burden of housing on the household budget, we also need to consider this change over time in light of the changes in savings rates. After all, the denominator is total expenditure, not income. When the savings rate is low and income is close to total expenditure, the above figure is close to the portion of income devoted to housing. But when household saving is high (expenditure is much less than income), this figure overestimates the share of income being spent on housing.
The problem with taking this analysis further is that household saving rates are not estimated directly and the ABS warns against using the survey to estimate savings rate. We can use the National Account savings rate estimate as a guide only, which suggest that if the above chart was instead a share of income, the 2003-04 year would be significantly higher, relative to its position as a share of expenditure. This would indiate that the housing cost burden grew since 1998-99, rather than since 2003-04 and the graph appears to show.
In all, the CPI weighting change is no news at all. It is an incremental slight improvement, but still misses the main game of housing weights for owner-occupiers. Also, the interpretation of ABS data by even our knowledge folks such as the RBA needs careful consideration. Finally I expect that the ALCIs will show lower than CPI gains in the coming few years due to their interest rate and house price sensitivity, which is likely to create additional arguments around wage negotiations and welfare payment incrementation.
Tips, suggestions, comments and requests to rumplestatskin@gmail.com