
While the echoes of the financial crisis bounce off the walls of fiscal stimulus and austerity it seems an opportune time to take stock of labour market conditions. The recent uptick in the headline rate of unemployment from 4.9% to 5.3% over July and August left some mainstream commentators confused. Indeed, the irrationally optimistic have taken to criticising the survey methods and the statistical margin for error in the figures, rather than accept that the trend measure of unemployment is clearly showing a turning point in labour market conditions. The next data release on 13 October will be revealing and could turn unemployment into a critical political debate.
Let us examine some of the details of the employment data as a background to future analysis.
Some sceptical observers raise concerns over the definition of employment used by the ABS and the changes to that definition over time, which could lead to an overly optimistic impression of conditions. I can confirm the following is the basic definition of employed persons used in the ABS labour force survey.
- worked for one hour or more for pay, profit, commission or payment in kind, in a job or business or on a farm (comprising employees, employers and own account workers); or
- worked for one hour or more without pay in a family business or on a farm (i.e. contributing family workers); or
- were employees who had a job but were not at work and were:
- away from work for less than four weeks up to the end of the reference week; or
- away from work for more than four weeks up to the end of the reference week and received pay for some or all of the four week period to the end of the reference week; or
- away from work as a standard work or shift arrangement; or
- on strike or locked out; or
- on workers’ compensation and expected to be returning to their job; or
- were employers or own account workers, who had a job, business or farm, but were not at work.
While many may be critical of this rather trivial one hour threshold, and the consideration of unpaid family labour as employment, this definition has been consistently applied since 1986, and is in line with standards recommended by the International Labor Organization (ILO). Indeed, EuroStat compiles harmonised unemployment data based on these definitions, while allowing member countries to provide their own measure internally (for example, the Netherlands definition of employed requires 12 hours paid work).
Looking at the history of the employment statistics is an interesting exercise. When the series first began in 1960 it included only non-indigenous people over 14 years of age in capital cities. In 1966 the scope was changed to include all persons over 15 years (including indigenous persons). The next major change was in 1986, as discussed above, and in 2001 more definitions were tweaked –
- people on short term unpaid leave initiated by the employer (that is, people stood down for less than four weeks without pay) were classified as employed rather than as unemployed
- people who were unavailable to start work in the reference week due to temporary illness were classified as not in the labour force rather than as unemployed
Analysis of data for the period April 2001 to September 2003 has shown that, on average, around 15,300 persons currently classified as not in the labour force will now be classified as unemployed (increasing the unemployment rate by 0.14 percentage points).
Finally in 2004 there was a change to the small group of persons (‘future starters’) who had not actively looked for work because they were waiting to start a new job within four weeks from the end of the survey reference week, and would have started in the reference week if the job had been available then. These persons were previously classified as ‘not in the labour force’ but are now classified as unemployed. This revised treatment will increase the unemployment rate by, on average, 0.1 – 0.2 percentage points.
I can also confirm that the monthly unemployment data does in fact have a very large margin of error, as shown in the table below.
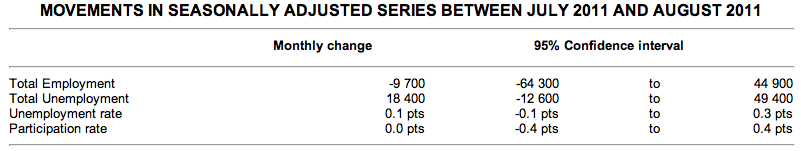
In all, like the CPI, the unemployment rate is useful for examining short-term changes in the direction of the labour market, but not ideal for making long-term comparisons.
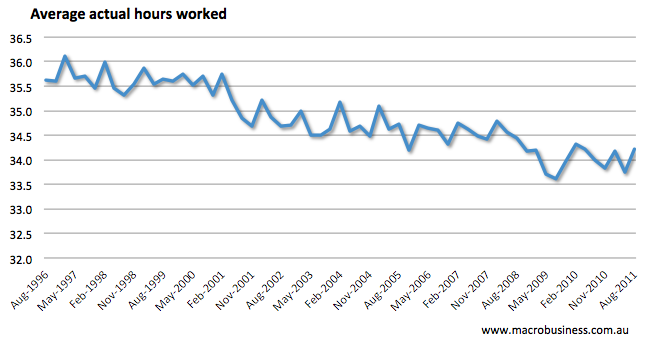
But a single unemployment figure is going to provide a very poor picture of the labour market given the long-term trend towards casualisation of the workforce (shown by average hours per employee in the graph below), with full time jobs down from 90% of jobs in 1966 to 72% in 2006. In addition there are long-term social changes towards more frequent job and career changes and the dramatic shift in the gender composition of the workforce.
The ABS produces a number of measures besides unemployment that help to paint the labour market picture – these measures include:
- Underemployment – the percentage of the labour force who want, and are available for, more hours of work than they currently have
- Underutilisation rate – the sum of the number of persons unemployed and the number of persons underemployed, expressed as a percentage of the labour force
- Extended labour force underutilisation rate – calculated as the unemployed, plus the underemployed, plus two groups who are marginally attached to the labour force: (i) persons actively looking for work, not available to start work in the reference week, but available to start work within four weeks; and (ii) discouraged jobseekers as a percentage of the labour force augmented by (i) and (ii).
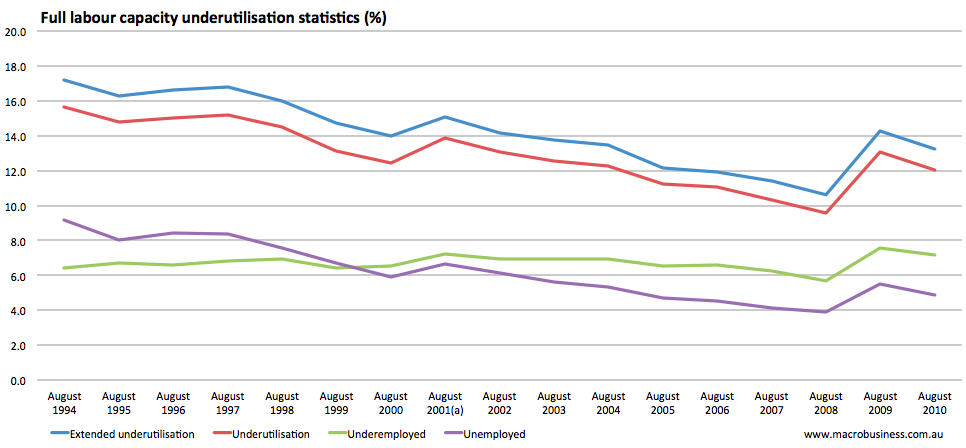
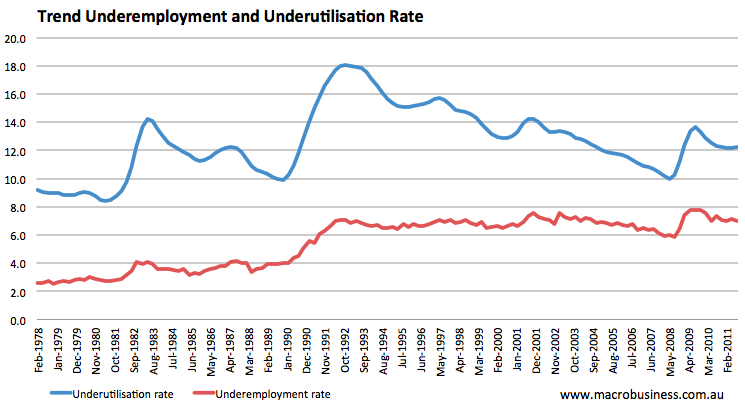
These measures give a better picture of the labour market and reveal labour market contraction through reductions in hours for the part-time and casual workforce. The graph below shows this more complete suite of measures for Australia annually since 1994, and the second graph shows the measures of underemployment monthly since 1978. As you can see, the casualisation of the labour force has brought a structural increase in the importance of underemployment in the labour market.
The observed trend in underemployment raises questions about the distribution of benefits from workforce casualisation. While there are clear benefits for workers seeking flexible and often temporary work arrangements, there are also costs from such arrangements due to the reduced bargaining power of employees.
This labour market picture is closely related to recent discussion over the challenges facing Australian retailers and housing construction. The key retail categories and building construction employ about 17% of the labour force alone and have a high proportion of part-time, casual and contract labour. The trends in the number of people employed in these areas are shown in the graph below.
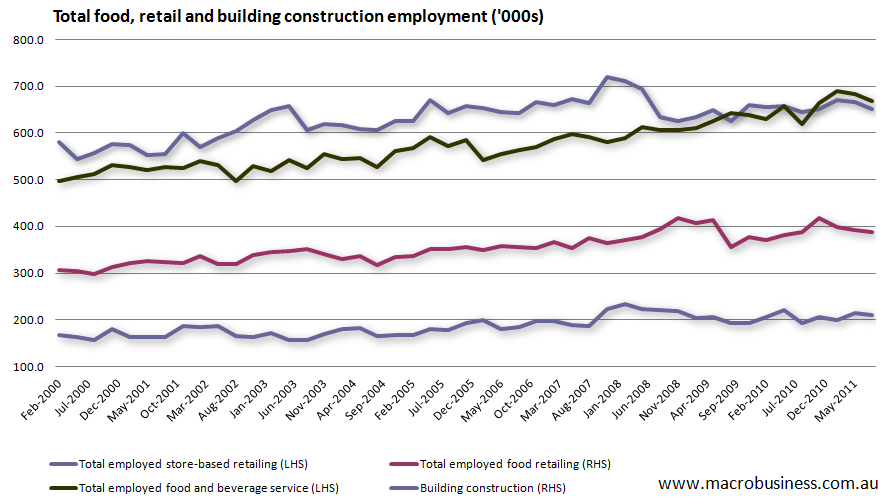
Given the nature of the labour market as a puzzle, where pieces of skilled employees are matched in a demand jigsaw, we know that major macro-economic adjustments have a human toll while labour demand and the supply of skills are mismatched. Don’t expect the ladies from the Myer cosmetics counter to simply be absorbed by the mining sector.
In all, the labour market is much more than a single headline unemployment figure. With a careful eye, labour market data can provide insightful clues to our genuine economic performance even with its high margin for error in any particular month. As a general rule I would argue that the published measure of underutilisation – the sum of unemployment and underemployment – is a more useful guide to labour market conditions, although don’t expect to see it in the mainstream media headlines.
Tips, suggestions, comments and requests to rumplestatskin@gmail.com