
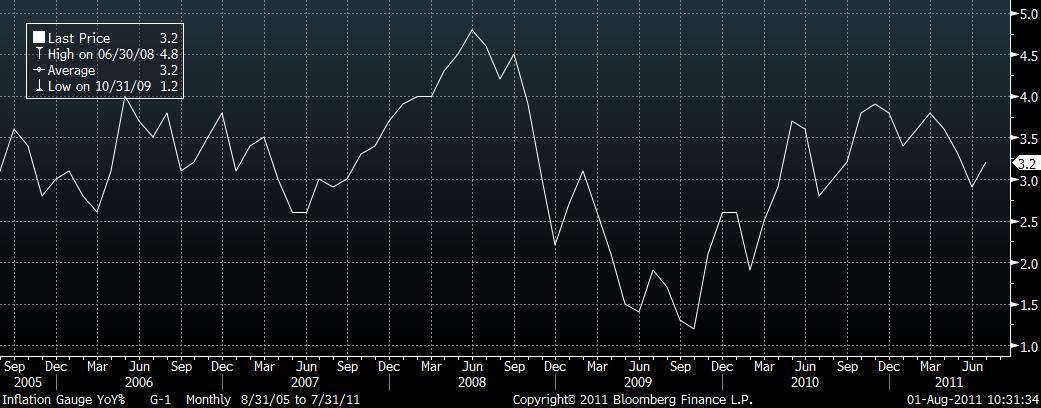
The monthly TD-MI Inflation guage has just been released with a rise of 0.3% in July up from the flat result last month. This has kicked the year on year change up to 3.2% and, for those of us who like to try to interpret charts, the chart below suggests the period of pullback/consolidation in the rise in this monthly index might be ending.
 Source: Bloomberg
This survey includes 90 items in its basket and the net balance was 6 items rose. That is, 28 items increased, 26 items decreased and 40 items remained unchanged.
The last six months sees inflation having risen 1.5% so if we are a bit crude and double that we end up with the top of the RBA’s band at 3% – which is a little on the high side. Equally however you could argue that if this is as bad as it is going to get with all the one off factors that we have seen in the past 6 months then we don’t really need to worry too much about the inflation picture.
The trimmed, which is really what matters to policy makers was up a more benign 0.2% and the last 6 months has only risen 1%.
This data, to a certain extent, will reinforce any concerns held by the RBA over an acceleration, or potential thereof, in Australia’s inflationary outlook. It is now a question of how hard they want to push this idea at tomorrow’s Board meeting and what weight they give the concerns around their central, mining boom/inflation, tendency.