
Australian Data
The Australian data calendar was dominated by employment and confidence figures this week and unfortunately neither provided any evidence of an improving outlook for the domestic economy with leading indicators actually suggesting we are in for weaker outcomes over the reminder of 2011. Housing finance was also subdued with investors becoming increasingly disenchanted with the housing market as prices remain weak.
ANZ job Ads Report

This weeks data unfortunately kicked off where we left last week, with total job advertisements falling 0.7% in July according to the ANZ’s job ads survey. News paper ads fell 0.5% while internet advertisements were down 0.7% over the month. The momentum has clearly faded with jobs ads rise in job ads stalling over the past few months and with global and domestic uncertainty growing we would expect businesses hiring intentions to fall as well.
Housing Finance
 The recent bounce in housing finance over the past 2 months faded in June as the surge in refinancing stalled. The total number and value of owner occupier loans was flat in June while the number and value of loans ex-refinancing rose 1.3% and 1.2% respectively. The total value of lending however actually declined as the value of investor loans fell 4.4% as falling house prices makes housing as an investment look increasingly poor. The continued down trend in the total value of housing commitments suggests further downside for house prices.
NAB Business Survey
 Probably one of the most important releases each month, the NAB business survey was on the whole weak, painting a bleak outlook for the domestic economy. While business confidence managed to edge higher after a sharp fall in June it was the one bright spot in the release with business conditions falling into negative territory while profitability fell further into the red, as did forward orders which is a good barometer of domestic demand. The most important indicator however was the employment index which collapsed from 5.3 to -1.9, its lowest level August 2009 and, along with jobs ads, suggest a further weakening in employment outcomes ahead.
Westpac Consumer Survey
 The Westpac consumer sentiment saw further weakness in consumers confidence in both their own financial situation and the outlook for the economy. The confidence index fell 3.4% however there was a large divergence between those who responded before August 5 and those who responded after August 5 as financial markets went into meltdown. The key is that weaker confidence is likely to result in further circumspect behaviour with retailers, the property sector and credit growth likely to be hit the hardest.
Australian Employment
 Inline with what the NAB survey continues to suggest the July employment figures were indeed week. As much as we would like to there is unfortunately no way to put a positive spin on the outcome. While the total number of Australian’s employed fell by only 100 in July, which was short of the market’s expectations of a 10,000 increase, it is the fall in full-time employment that is really concerning. Full time employment, which is classified by workers working more than 35 hours, fell by 22,200 while part-time employment rose by 22,100. In fact total hours worked only grew by 0.2% with the trend growth in hours worked slowing to 0.1%, its lowest level since August 2009
Offshore Data
Offshore it was a similar story with the data from the developed economies across Europe and the US confirming that the global economy continues to slow as the stimulus boosted growth following the GFC continues to fade
Chinese Inflation
 Despite the persistent efforts of Chinese officials to dampen inflationary pressure through increased reserve requirements for the nation’s biggest banks and higher interest rates prices have begun to accelerate once again. Inflation rose by 0.5% over the month, following an increase of 0.3% the previous month with the annual rate climbing to 6.5%. Food inflation continues to be the main driver as the increase income is seeing the Chinese population move towards more protein rich foods with the annual pace of food inflation climbing to 14.8% with meat, poultry and related products up 32.3% over the year.
Chinese Activity Indicators
 The monthly run of Chinese economic activity Indicators were all weaker than expected. The annual pace of industrial production slowed from 15.1% to 14% against expectations of 14.6%, retail sales fell to 17.2% from 17.7% after they were expected to remain unchanged while fixed asset investment slowed from 25.6% to 25.4% against expectations of 25.5%. While they were all weaker than expected they all remain quite strong in the grand scheme of things and are unlikely to hinder Chinese official tightening monetary policy settings further to reign in inflation.
Chinese Trade Balance
 China’s trade balance surged to its highest level since January 2009 and its 5th highest level of all time in July as exports surged 8.1% to a record high while imports rose 2.8%. the Trade balance now sits at US $31.5bln while total exports now stand at US $175.1bln. What is interesting to note is that the last time China’s trade balance surged to similar levels was October 2008 and January 2009 as imports fell as the global economy ground to a halt following the collapse with exports following suit a few months later. While we are YET to experience another event like Lehman the global economy is clearly slowing.
German Trade
 While the German economy remains the strongest in the Euro-zone and the driving force behind growth in Europe there are growing signs that the German economy is facing increasing pressure from the increasing economic weakness in the remainder of Europe and the developed world for that matter. Germany’s latest trade figures showed exports fell 1.2% while imports eeked out a gain of 0.3%. While activity has remained solid for longer than we expected Germany’s trade continuing to slow and it is expected to slow much over the coming months.
UK Industrial and Manufacturing production
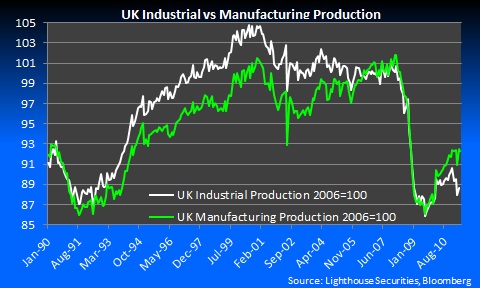 Economic activity in the UK remained unequivocally weak with industrial and manufacturing activity both missing estimates in June. Industrial production was unchanged from a month earlier after it was expected to rise 0.4% while manufacturing production fell 0.4% after it was expected to rise 0.2%. Both the industrial and manufacturing production indices remain well below their Pre-crisis peaks and with the Government aggressively pursuing austerity to reign in their public finance there is little chance of a bounce anytime soon.
US weekly jobless claims
 Weekly jobless claims, which came in a touch ahead of estimates appeared to get the market going however the result was far from spectacular. Initial jobless claims fell to 395k in the week ending August 6 after they were expected to rise to 405k from a revised 402k. While 400k has been a sticking point for initial jobless claims we would need to see a sustained move below 400k before we got too excited. Meanwhile continuing claims have remained largely unchanged while those on emergency and extended continue to fall of the eligibility list as in America you are limited to how long you can receive benefits.
French GDP
 If France wasn’t already gaining enough attention with itself and its banks coming under growing increased scrutiny, the announcement of a quarter of zero growth couldn’t have been more poorly timed. French GDP was unchanged in the second quarter as it joined the global economic slowdown. The unchanged quarter resulted in the annual pace of growth slowing from 2.1% to 1.6%. Germany, the real driving force behind the Euro-zone, will release their figures next week and we sure hope for a solid result.
EU Industrial Production
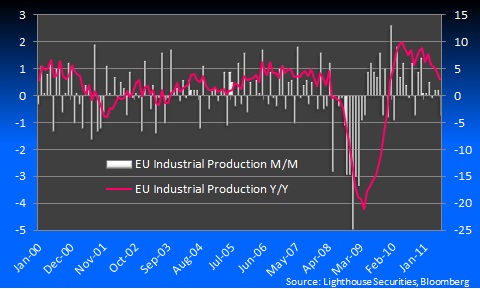 Adding to Europe’s woes is increasing signs that, like much of the rest of the developed world, their stimulus boosted growth since the GFC is fading with industrial production losing more momentum in June. Industrial production fell 0.7% in June after it was expected to remain unchanged from May. The sharp slowdown is evident in the annual rate of growth that has continued to trend lower from its recent peak in December 2010 of 8.9% to 2.9% in June. With the ECB already tightening rates twice in order to reign in inflationary pressures and Governments across the EU pursuing drastic austerity measures to restore public finance we can only see industrial production slowing further from here.
US Advanced Retail Sales
 July’s advanced retail sales were largely in line with expectations with total sales rising 0.5% which was spot on expectations while sales ex autos also rose 0.5% which was just ahead of the 0.3% expected and sales ex autos and gas were 0.3% higher against expectations of a 0.2% rise. After a steady rise through the back half of 2010, US retail sales have slowly lost momentum through 2011.
US Consumer Confidence
 Congress’s standoff over the US debt reduction plan, which ultimately resulted in S&P downgrading the US Governments Sovereign Debt rating, increased volatility and a deteriorating economic outlook has weighed on US consumers with the preliminary reading of the University of Michigan’s consumer confidence survey posting a sharp fall to its lowest level since May 1980, eclipsing its lows from the GFC. The confidence index fell from 63.7 to 54.9 after it was expected to drop to 62.0. The collapse in confidence suggest we are likely to see much weaker retail sales and consumption figures over the coming months in the US
Yours in data – The Lighthouse Research Team.