
After trading the inside range for a while now the Aussie has finally broken topside overnight on the back of the Euro “solution” and along with the ebullience in other markets is threatening to move up and test resistance at 1.1013.
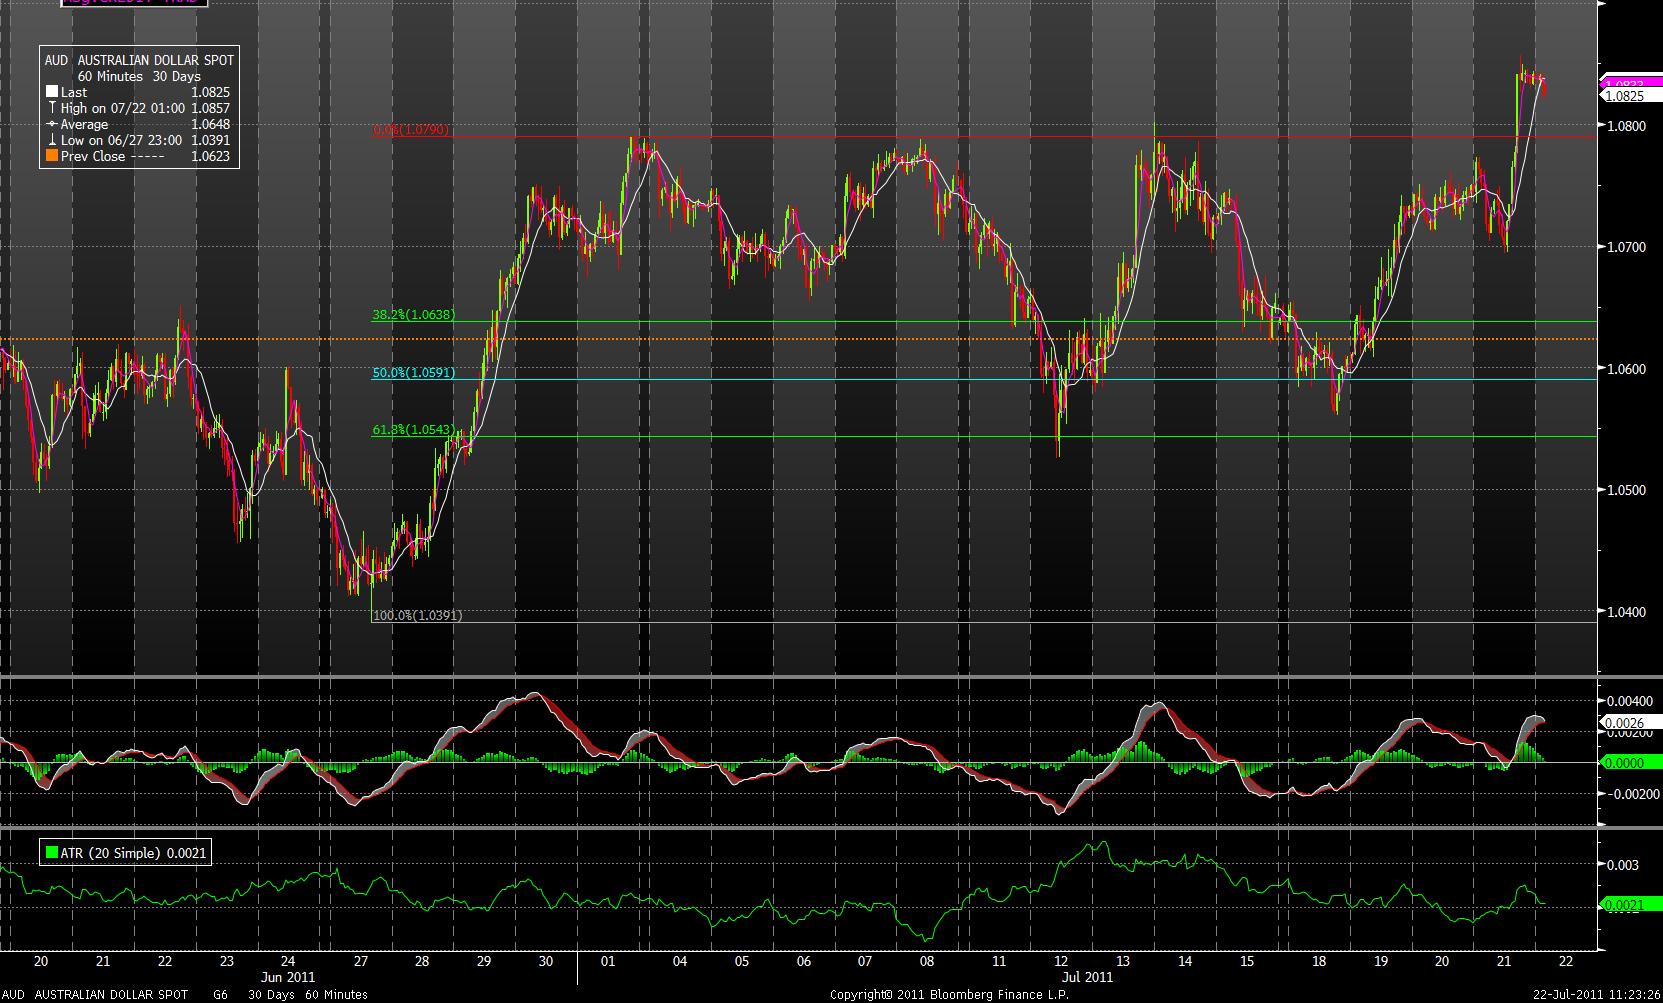
As you can see in this chart the Aussie does not have a life of its own at present. Rather it is hostage to the whims of the short term traders and the latest news. Indeed if you have a close look at the chart you’ll see that it was threatening to break down below 1.07 late yestereday on the back of the weak Chinese data but then swiftly reversed on what – I hate to say it – was a risk rally.
I always believe that markets take the path of least resistance and when I am trading I’m always trying to find this path. Over the last couple of months we have found both sides of the range blocked. But while it often looked like it was going to break down even as markets teetered it always found really solid support. So we know that that side is safe unless there is a market catastrophe most likely.
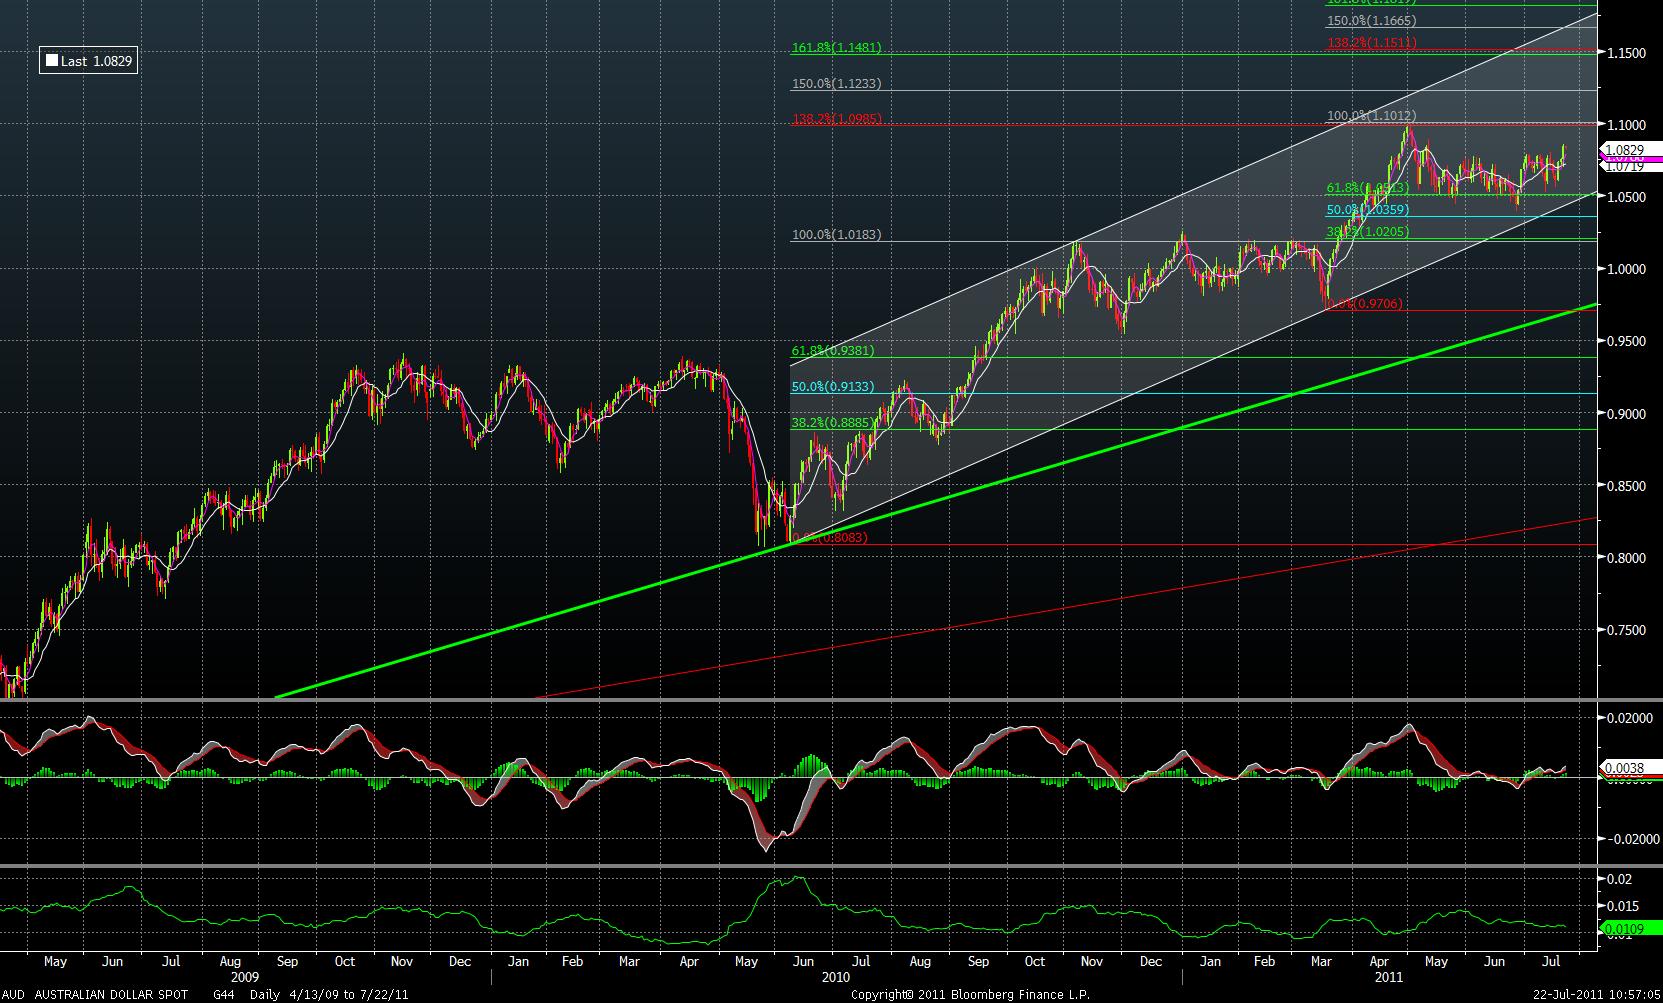
But what about the top side? As you can see in the chart above the Aussie remains firmly in its uptrend from last year. We have now had a sideways correction which may have built momentum for a break to the topside.
Let me explain. In my experience there are two types of consolidations. The first is the big market fall (or rise) where the long’s (or short’s) get stopped out of their positions the overweight nature of positioning washes out of the market and it is free to resume its previous move.
The second type of consolidation is the “time” consolidation where the market trades in a range for a while, actual volatility falls because it is in a range, and traders get washed out of positions over time. This is possibly the type of consolidation we have just experienced.
So to the extent that we know that there is solid downside support around 1.04 the path of least resistance at present may be to try to find where the real topside resistance is. We know that in the short term 1.0890 looks like a little hurdle and then we have the massive level, in terms of the charts going back to 1971, and the recent high of 1.1013 looms large.
Unless or until this level breaks we are just inside a broader 1.04ish 1.10ish range.
What do I think?
As a trader I want it to test 1.1013 so I can guage whether this is real resistance or not. As someone with Turtle tendancies I would be small long on the break of the range high overnight. But it all depends on what happens offshore and in other markets – so the fundamentalist in me says be careful.
If the Aussie does break 1.1013 then there is resistance at 1.1233 and 1.1480/1.1511.
I don’t trust the equity rally so I don’t trust the Aussie’s rally for anything other than a trade either.