
I wanted to retouch on the Building Approvals data released this morning and pop a chart or two in so that you can see just how weak the overall picture has become.
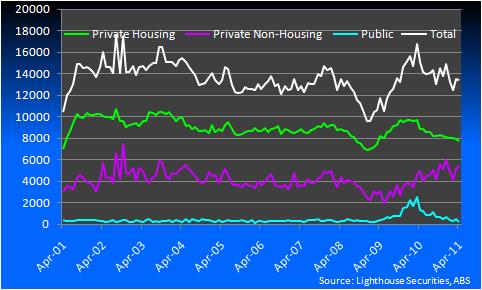
This first chart is the break up of the overall Building Approvals series. There seems to be a clear dichotomy between the volatile but continued uptrend in “private non-housing” (purplish line) versus the obvious downtrend in “private housing” (green line). We’ll leave “public” out of it because of its size.
Does this imply that affordability is driving people from houses to units in the way that the oil shock in the 1970’s drove people into Datsun 120Y’s and other tiny cars? Perhaps, but it at least alludes to a weakening trend overall.
Now let’s drill down a little and get a good look at “private housing” in the next chart.
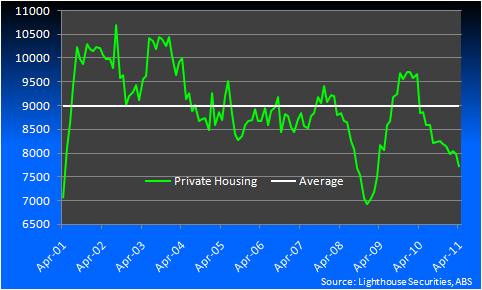
This is where the rubber hits the roads in terms of overall economic impact of the sector and trend and regardless of what some commentators say about this data and the give back after last month’s bounce the trend in private housing is clear – it is in free fall and well below the long run average.
Put this together with household demand for finance, both housing and other personal, and we see a sector of the economy not playing ball. The RBA has hit its mark and hit it well – households and housing are in the doldrums – they have made way for the mining boom the RBA just doesn’t recognise it yet.