

The USD didn’t play ball this week. Just when it looked like assets in the so-called risk basket were pricing off weak data from the US, traders decided that a moribund euro was preferable to the USD and those of us who thought Aussie was headed for 1.0350 got to experience the joys of stop losses.
Before I look at why the USD turned tail and perhaps why the Aussie bounced so nicely from the lows I just want to reiterate once again the importance of stop losses and how I use them. The 2nd “risk off’ break this week happened in our afternoon and I thought we busted resistance, at least on my charts. Two readers, Avid Chartist and Rota Fortunae, had a better feel for it than me and thought it was a test not a break – which proved correct. But let me walk you through the mechanics of how I would have traded it and why a stop was important.
Having tested 1.0479 twice on the hourliles earlier in the week, 5 points through here became my stop entry for a short. That is, I would have sold at 1.0474 looking for 1.0350/59. My stop was based on the hourly volatility which was running at 25 pips per hour on my ATR indicator. So 2 times that was 50 pips or a stop at 1.0524 (remember this was an hourly trade so P&L expectations are reduced).
Now the beauty of this is that even though I got it wrong, I only lost 50 pips, give or take slippage, in a move that in the end ran from 1.0440 to a high yesterday of 1.0719. Why is that important? Because I didn’t believe this move had credibility and without the stop I would have fought it and probably lost double or triple. Remember, if your trading know where you are getting out when you are getting in because we don’t always get it right and importantly to stay profitable you don’t have too.
So what was it that took the wind from the sales of the USD and thus gave AUD and other currencies a lift. Essentially it has been a run of weaker than expected data in the US which, combined with the bond market rally, is reiterating to traders that the headwinds facing the United Stqates economy are not only still present but growing.
One of my personal favourite indicators is the ECRI leading Index of Economic Activity which is released on Fridays. Its a weekly release but I have it on my screen all day everyday so I don’t forget what its telling me about the US economy (it works nicely for equities as well – but that’s for another blog) when I go to make an investment call.
Here is a chart from Doug Short who analyses all things in the US data space.
Two things are important here. Firstly it has been a long run good predicter of the US growth profile and second it has rolled over now for 5 weeks and seems to be pointing to further economic weakness to build on this week’s weak GDP, Richmond Fed Index, Durable Goods Orders, house price falls and initial jobless claims.
Now, we know that exchange rates are bilateral so the other side of each USD cross also matters. But it seems to me that what is happening in the US and the sentiment toward the USD that is the most dominant and thus important input for traders and investors at the moment. That’s why the EUR is now trading with the commodity bloc against the USD but getting hit hard against the Swiss Franc, GBP and Aussie.
So back to the Aussie what does it all mean? But lets look at the USD Index first.
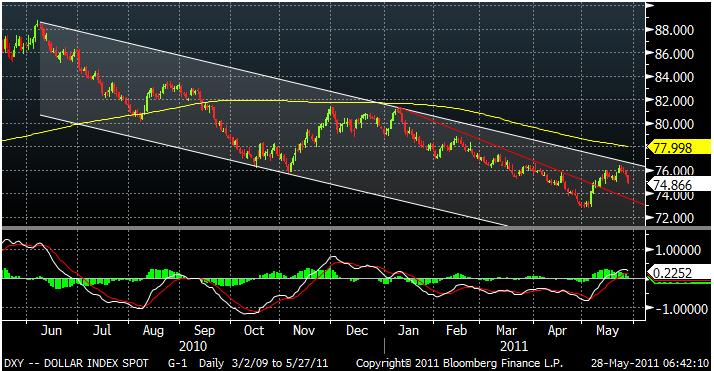
You can see here that the USD has not been able to challenge or break the downtrend that stretches back to this time last year. So it remains in a bear trend. This week’s price action will have sapped the resolve of any bulls is my guess. From a fibonacci retracement, not shown here, the USD couldn’t even get to the 50% of the last leg down. So overall if its basing it has got some work to do lower before anyone gets convinced. Key short term support is 74.16 then the recent low at 72.696.
Now if it’s all about the USD, which it seems to be at the moment, then the Aussies rejection of lower levels and rally and close above 1.07 (1.0710 for the week), which is its best close 4 weeks, suggests a retest higher to determine if the medium term top is truly in place.
Now I’m sure to some readers this is all just technical mumbo jumbo but the reality is that in the current unstable environment, when Greece could falter at any moment sending markets into a tailspin, technicals become very important guideposts for many traders and the levels are to be respected.
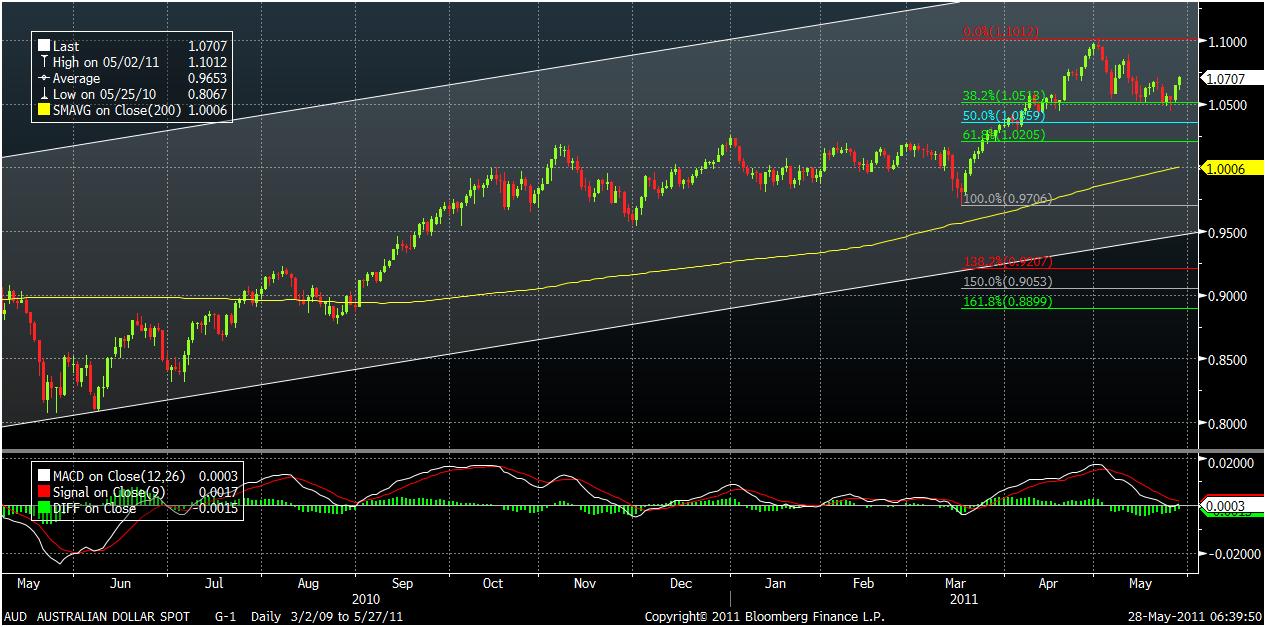
Looking at the Aussie chart we see in many ways a mirror of the USD chart in that the big uptrend is still intact, in that it never got to that that 50% retracement level I was looking for at 1.0350/59 and its little old downtrend from the 1.1013 high has been broken. So at the risk of getting whipped the technical outlook has got a bit more positive over the past few days. 1.0725 then 1.0794 are short term upside resistance and if the higher level breaks then a retest of the high becomes a real possibility.
The key to all this is that uncertainty is high and it’s a traders market. This week we get the release of Australian GDP on Wednesday and all the partilas that flow before that Monday and Tuesday so there are plenty of domestically focussed events that could drive the Aussie one way or the other, so if it’s a traders market, watch the levels closely and don’t forget about Europe.
So what do I really think? I think we are in a range but that the medium term top in the AUD and low in the USD are in place. It would be normal and reasonable, indeed preferable, for these levels to be rested to prove the solidity of same. I’ll keep an eye on things and report back because its not a time for welded on views, the market is the market and it goes where it must.
And one other thing, its memorial day holiday in the US so the summer holiday’s have just begun – always an interesting time for markets.