
Bullish commentator Clifford Bennett was recently interviewed and restated his opinion that the ASX200 is on its way to a “100% rally”, and will end up “above 8000 points” in 2 years time. Given this forecast is also some 16% above the historic high reached on 1st November of 2007, and others have continually called for a new rally and bull market in stocks, I’d like to examine the probability of the Australian share market reaching such euphoric highs.
Predictions and Assumptions
Predictions about stock markets are easy to make. Given the inexorable rise of developed world equity markets since ca. 1875 of approx. 6% per year, it takes only the most ardent uber-bears (e.g Marc Faber) to predict any sort of terminal decline in share prices.
But predictions are based on at best, thoughtful assumptions, or at worst, hope. Let’s look at the set of assumptions required to achieve the 8000 target level within 2 years as stated by Mr Bennett:
- 15% earnings growth, compounded PLUS 30% expansion in current trailing PE (price earnings) to ca. 15.5 times
- if the ASX8 (top four banks and top four miners) continues to provide 99% of all earnings growth whilst the remainder of the ASX50 lags, then housing credit and commodity prices must at a minimum continue at their present levels
- if we assume above, then an expansion in PE ratios for the ASX8 would require an increase in investor sentiment OR an expansion in housing credit growth and a rise in commodity prices of approx. 20-50% from current levels
- in the absence of the above the rest of the ASX50 must provide ca. 20-30% plus earnings growth from current levels
What are the current conditions?
- trailing PE ratio for the ASX200 is 12.6 and the All Ords is 12 (as of close yesterday)
- forecast earnings growth for FY12 is between 11 and 13%, whilst FY13 is forecast at 9 to 12% (with PE ratios forecast to stabilise between 10 and 11)
- earnings per share for the non-top four miners and banks are almost 20% below 2008 levels, even though net levels of profit is up. This is due to the extremely dilutive capital raisings of early 2009 to pay down debt, which impacted Return on Equity (ROE) significantly (doing so reduces that return to the cost of the debt paid off)
Note that earnings growth forecasts have not yet included the results of the big four banks AGM’s where further guidance is provided (actually just 3 – CBA not included in this round due to reporting calendar).
A heady set of assumptions and conditions to overcome, but there are three core “memes” that seem to have the bulls excited:
- 1. An average PE of approx. 15 times earnings is reasonable and the current level is well below historic averages
- 2. The market has priced in exogenous and endogenous risks i.e overcompensating from the risk of a Euro crisis and a disleveraging Australian household
- 3. Earnings growth will increase due to continuing demand for resources from China and emerging markets and steady growth of household credit
PE of 15 is not the average – its 11
In my Australian Share Market Report, I noted:
When considered within a historical context however, a PER of 11 is not so unusual nor very low at all.
The maximum PER attained during the 1969-1982 bear market (using the All Ordinaries Index) was 11.7 whilst the trimmed mean was 8.4 times. During the 1982-2007 secular bull market, the trimmed mean was 15.1, approx. 30% higher.
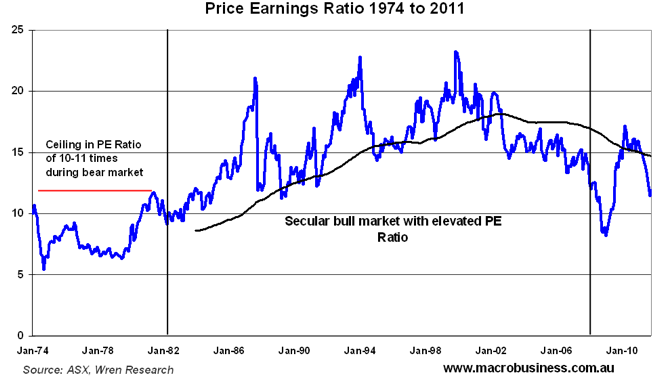 I’ve updated the chart above to include last month’s PE and the current PE ratio of 12.1 times for the All Ords plus a 10 year moving average of the PE ratio.
 As has been argued on MacroBusiness before, the case for an “average PE ratio of 15 times is reasonable”, only relates to the previous secular bull market, namely from the mid 1980’s to 2007. This level has been shown to be an aberration, as even in the post WW2 boom market Australian stocks were priced at just over 14 times earnings only twice, and during the last secular bear market of the 1970’s, averaged 8-9 times.
It wasn’t until 1984 when the full effect of the demographic push of the Baby Boomers combined with a once in a century bubble in credit did they exceed 12 times earnings.
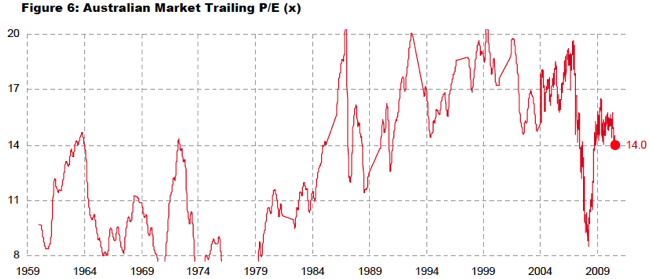
From Wilson HTM
Not only is a crucial demographic change going against this meme of “15 times earnings is reasonable”, but so does the continued unwinding of credit, including households, corporates and investors. As I have explained previously as part of a multi-factor macro model for Australian stocks:
One of the key factors in a new bull market in stocks, just like property, is a propensity for investors to borrow more on expectation of higher earnings – alongside a move to higher price/earnings ratio premia, reversal from a lower interest rate environment and the “lazy balance sheet” theory. Margin debt deleveraging began in the December 2009 quarter and has accelerated, averaging 3.4% quarterly or over 12% in the last year.
The corporates are truly deleveraging, undergoing a massive round of capital raising in 2009 to extinguish debt, and then returning funds to shareholders again by undertaking share buybacks. This is the opposite of true bull market conditions, when corporates struggle for cash to expand earnings (and bonuses) and rely on raising equity – the diluting effect hopefully overcome by increased returns – and borrowing as much as they can (and sometimes more).
With corporate gearing at 30 year lows, with debt/equity ratios below 30% and IPO’s activity muted alongside increased buybacks (the only way for corporates to enhance lazy Return on Equity (ROE)), this driver on PE premia is completely absent.
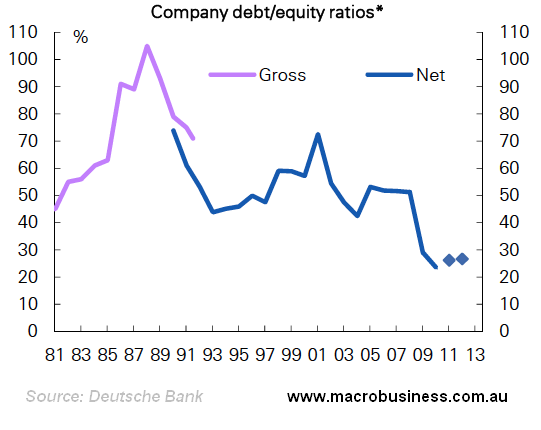
Companies have deleveraged and conducting buybacks whilst margins stabilise with tepid recovery.
Market Pricing in Risk? This is not March 2009
It is completely true that the sound and fury of the mainstream media (you know when they are frothing when updates are turned into a minute by minute blog) has blasted fear and uncertainty – after the fact – into stock market investors. This has self-perpetuated in a 20% or 1000+ point correction from the April high at 4971 points to the late September close at 3863 points on the ASX200.
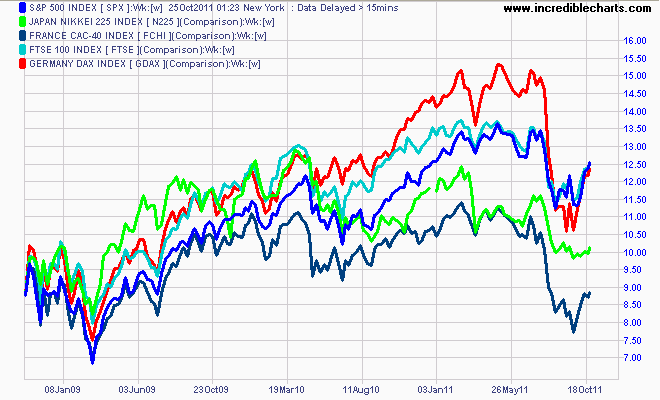
As I stated last week, other equity markets have fared worse, but the main markets of Germany and the US are well above their bear market low:
The DAX is off 24% from its May high, but still 58% above its March 2009 low (i.e around 20% annualised)
The FTSE is off 12% from its high, still 53% above its March 2009 low.
The French CAC-40 is off 25% from its high, but only 24% above its March 2009 low.
The Nikkei 225 is similar – also 23% from its high, but only 24% above its March 2009 low.
As for the US, the SP500 is only 10% off its high, and some 80% above its March 2009 low.
The magnitude of the falls for US equity markets in particular, is less than that of Greece Crisis 1.0 in May 2010. As I’ve shown repeatedly, 20% plus corrections are the norm for all bear markets (defined as a market which has not exceeded the recent bull market high e.g 6700 points on the ASX200), as are the subsequent 10-20% bear market rallies.
This is not a “pricing in of risks” – this is a Tom Jones correction – not unusual at all, just highlighted by the interconnectedness and fragility of worldwide equity markets. Notably, their PE ratio correlation is increasing:
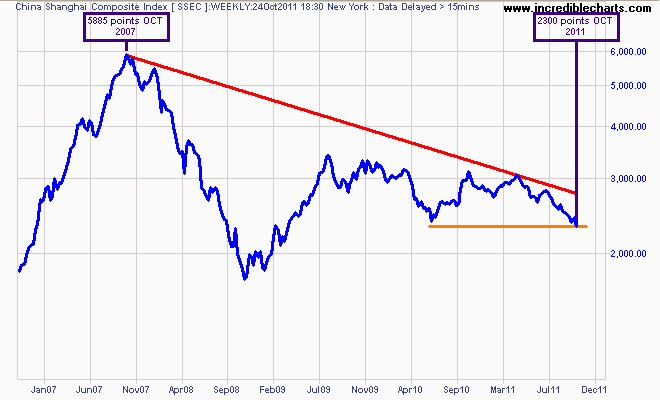
The only market that appears to have priced in the real risk to global growth – a slowing down China – is the Chinese equity market, represented by the Shanghai Composite index, which is starting to resemble the aftermath of the late 1980’s stock market bubble of Japan’s Nikkei 225, down some 60% from its nominal high:
Earnings Growth
Finally we come to earnings growth. It is perceivable that investors could increase current PE ratios based on a perception of “value” and that markets have fallen “too far”, even without considering future expectations of earnings.
But unfortunately this is where irrational investor behaviour diverges from the fundamentals. As I explained above, the median forecast for earnings growth is 11 and 13% for this financial year and 9 and 12% for next financial year. This is well below the 15% compounded required to meet Mr Bennett’s forecast.
The graph below from the RBA explains why you should be sceptical of current’s brokers earnings forecasts:
The ASX8 – the four banks and top four miners (BHP-Billiton, Rio Tinto, Newcrest and Woodside) – are the only listed companies within the top 50 stocks by capitalisation providing meaningful profit growth (i.e that actually impacts the “E” in PE for the market).
This concentration of earnings risk means any ructions to housing credit growth (and particularly banks vulnerability to wholesale foreign funding) and commodity prices (particularly coal, iron ore, gold and oil) via a terms of trade shock will have significant impact on the ASX8 ability to lift up the rest of the market, who are struggling with tight margins and reluctant consumer spending (on a GDP per capita basis) due to the entrenched disleveraging of the Australian household.
Summary
How does a 8000 point target visually fit in with the range of probabilities I considered in my report, where a 15.5 times PE was considered the highest range?
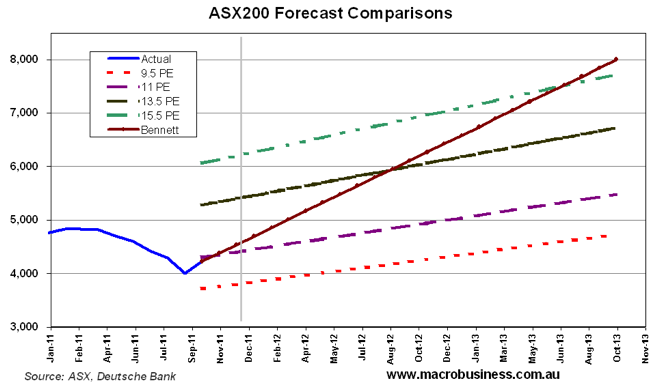
History, demographics, macroeconomic analysis and a prudent risk assessment is on the side of the realistic PE range of 9.5 to 11 PE.