In MB’s 2017 Christmas special report, entitled “The Great Housing Reckoning”, we anticipated a difficult 2018 for Australians with “an intensification of the per capita income recession that is the essence of the nation’s budding lost decade”.
While this view was largely correct, we also argued that “house prices… are unlikely to crash”, instead forecasting a “slow melt” whereby prices gradually deflate from exuberant levels.
As 2018 has unfolded, the Australian housing market has deteriorated faster than we envisaged. This correction has been driven by Sydney and Melbourne, where prices are now plunging, pulling the national index into the red.
This begs the question of whether Australia will experience a housing “crash”, loosely defined as a peak-to-trough decline in values equal to or greater than 20%.
Advertisement
We see this as a strong probability for Sydney and Melbourne, and a reasonable likelihood nationally. Although this will hinge on Labor following through with its commitment to limit negative gearing to newly constructed dwellings and halving the capital gains tax discount, as well as the response (or lack thereof) from the federal government and Reserve Bank.
The rest of this report unpicks these issues, as well as their implications for the broader Australian economy.
Housing valuations are finally deflating:
Advertisement
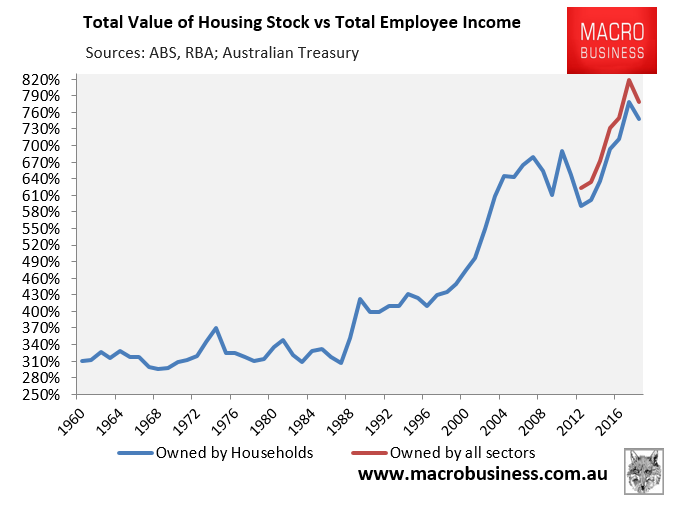
Following five years of unrelenting growth, Australia’s housing stock valuation hit an unprecedented 8.2 times employee incomes in June 2017, but has since retraced to 7.8 times incomes as at September 2018:
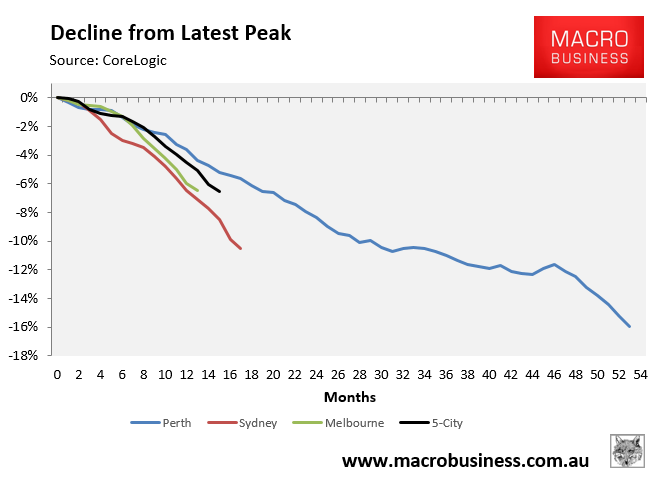
The decline in Australian dwelling values has been driven by Sydney and Melbourne, where prices have fallen sharply and are fast catching-up with Perth, whose correction has run for more than four years:
Advertisement
As at the time of writing in mid-December, CoreLogic’s 5-City index had fallen by 6.6%, driven by falls of 10.3% in Sydney, 6.7% in Melbourne, and 15.2% in Perth.
Further, all short-term indicators are pointing to ongoing dwelling value declines through 2019, led by Sydney and Melbourne.
Advertisement
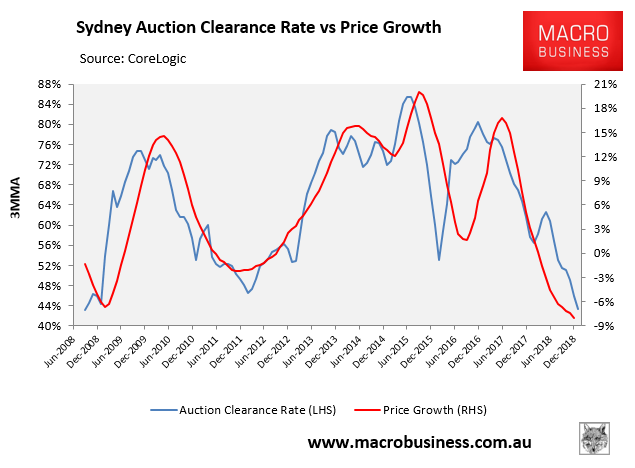
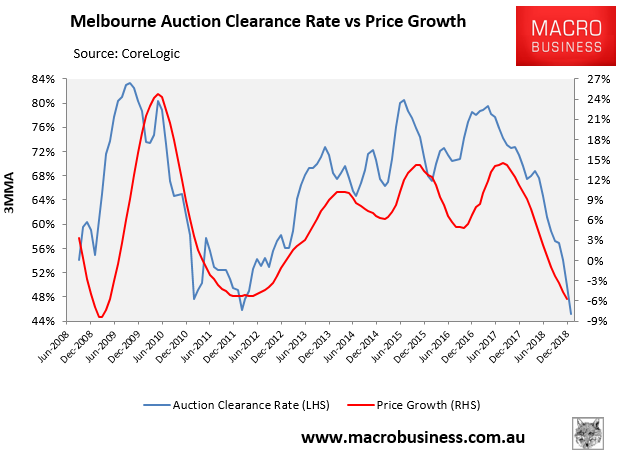
First, Auction clearance rates have crashed to 2011-12 lows, hovering in the low-40s nationally and across Sydney and Melbourne:
As shown in the above charts, there is a strong correlation between auction clearances and dwelling price growth, with clearance rates typically leading prices.
Advertisement
Clearance rates at these low levels is typically associated with dwelling price falls of 5% to 10% per annum across Sydney and Melbourne.
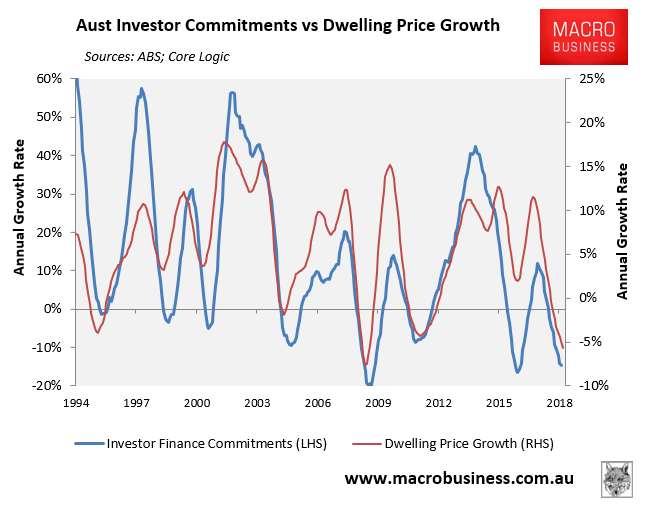
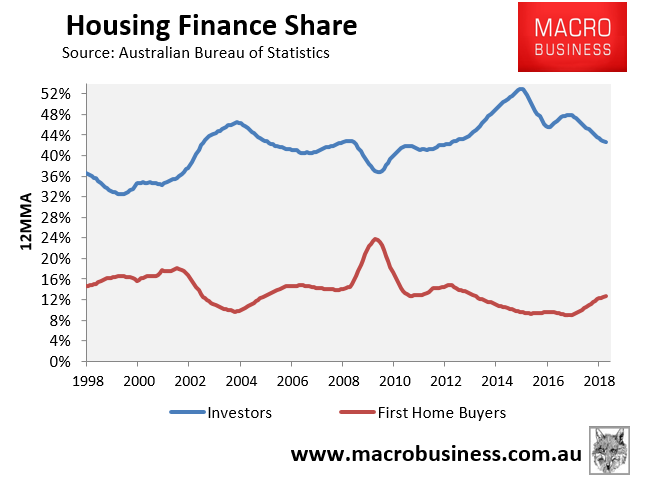
Second, investor finance growth has collapsed, which historically has also shown a very strong correlation with dwelling price growth:
Advertisement
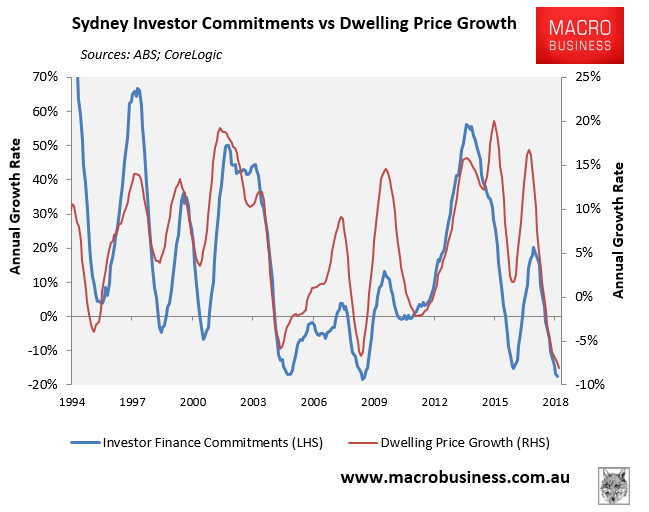
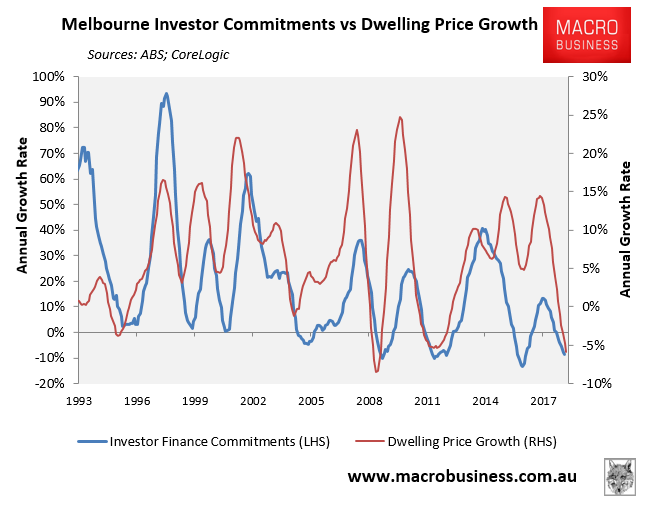
The situation is most acute in Sydney and Melbourne, which have the highest concentration of investors at more than 50% and 40% of mortgages respectively, making these two markets particularly prone to an investor-led downturn:
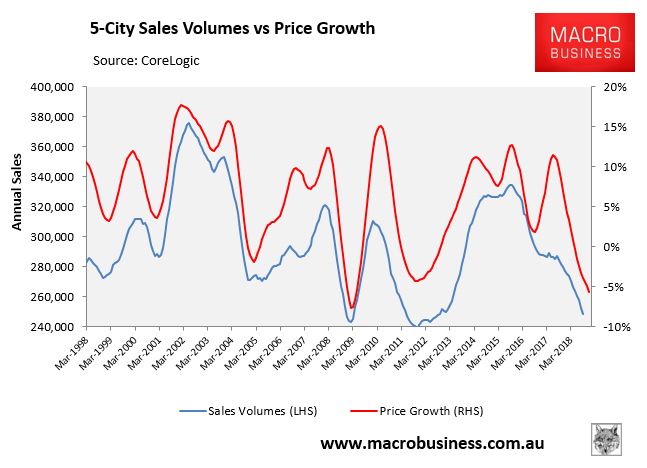
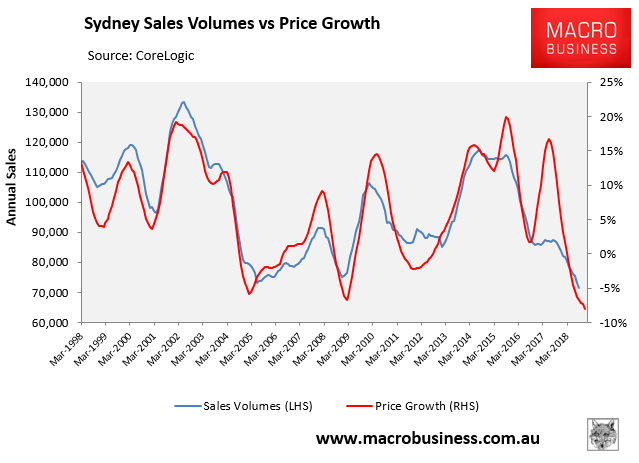
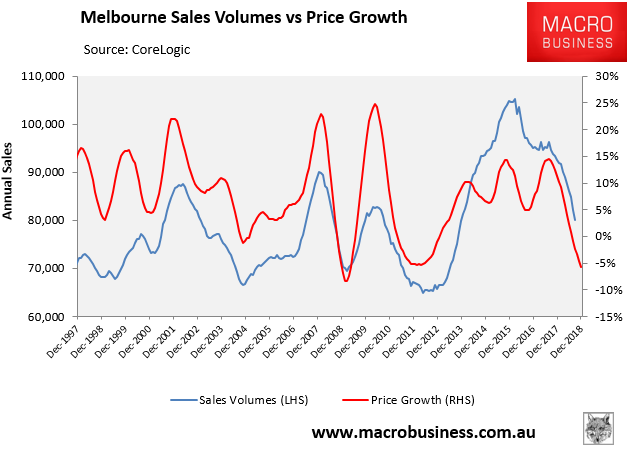
Third, sales volumes have collapsed, which given past historical correlations also augers badly for prices. At the 5-city level, sales are tracking at 26% below their most recent peak:
Advertisement
Whereas sales are 38% and 24% lower respectively in Sydney and Melbourne:
Advertisement
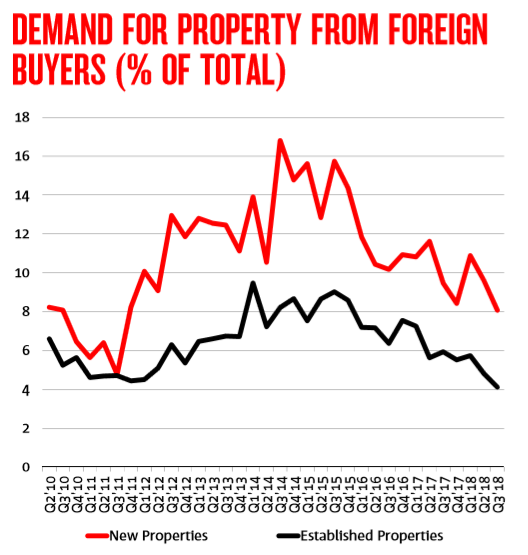
Fourth, survey data from NAB suggests that foreign buyers have pulled back sharply from the Australian housing market:
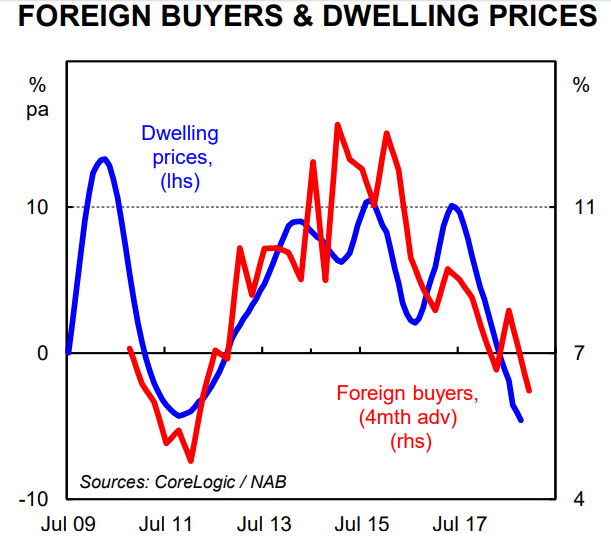
According to CBA senior economist, Gareth Aird, “there is a decent relationship between the annual change in property prices against the share of sales going to foreign investors”, with foreign buyers typically leading prices on average by around four months:
Advertisement
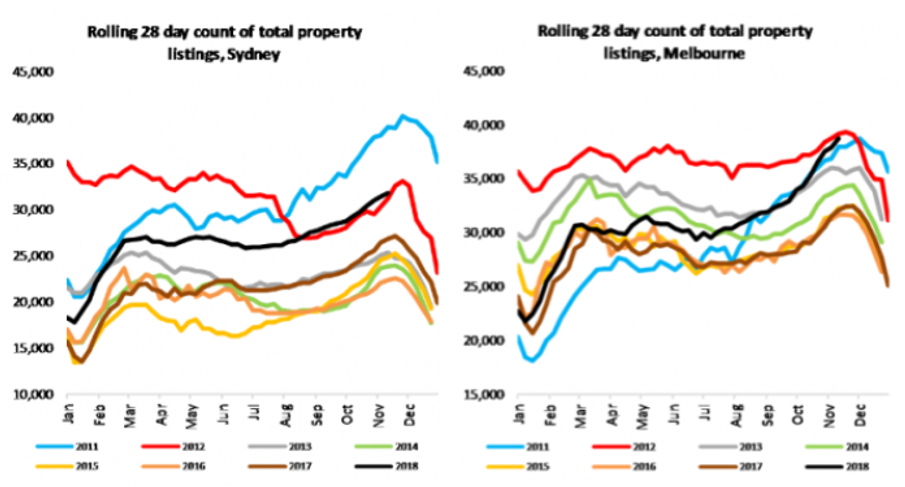
Finally, the inventory of unsold homes is accumulating, driven by the lack of demand. According to CoreLogic, total listings are higher than they were any year since 2011 in Sydney, whereas in Melbourne total listings haven’t been as high since 2012:
Advertisement
Data from rival firm SQM Research shows a similarly strong increase in for sale listings across Sydney and Melbourne:
Housing market will determine economy’s fortunes in 2019:
Advertisement
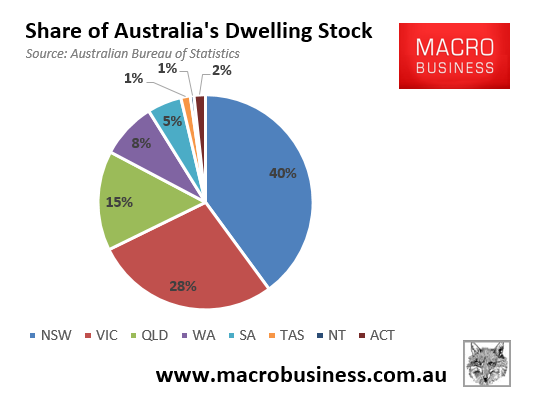
The significance of the housing busts underway in Sydney and Melbourne cannot be underestimated. According to the ABS, 68% of Australia’s housing value is held in New South Wales and Victoria, with around 60% held in Sydney and Melbourne alone:
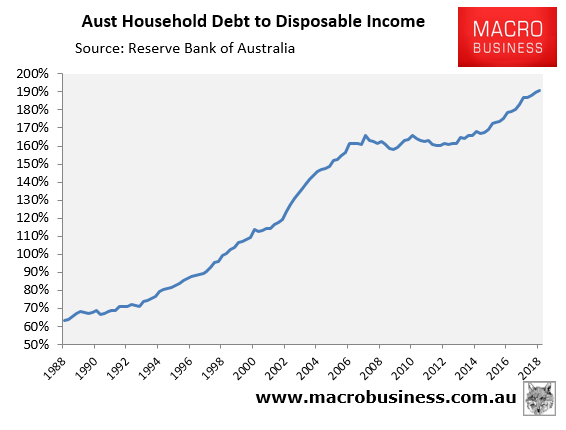
When you look at Australia’s wealth, we see that around 55% of household wealth in Australia is held in housing, whereas around 70% of household debt is in housing as well. Household debt, which is tracking around 190% of income, has also never been this high:
Advertisement
The correction of Australia’s housing market will, therefore, negatively impact the Australian economy in several ways.
Weaker Consumption:
Advertisement
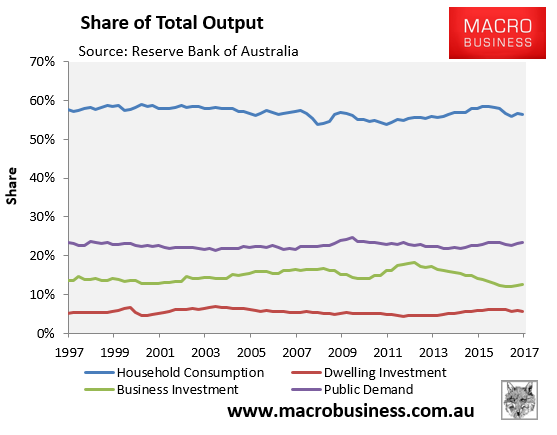
The negative wealth effect associated with falling housing values is likely to dampen consumption, which is worth 57% of GDP:
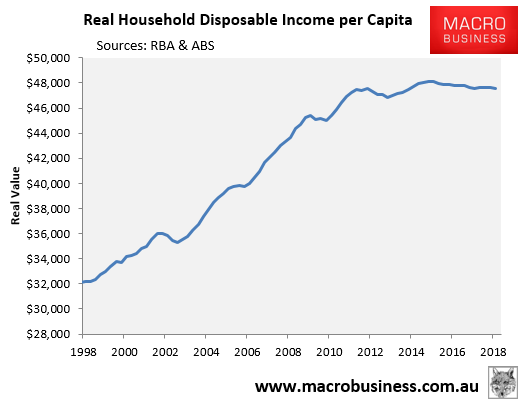
To date, Australian households have successfully maintained their consumption spending in the face of falling real household disposable income:
Advertisement
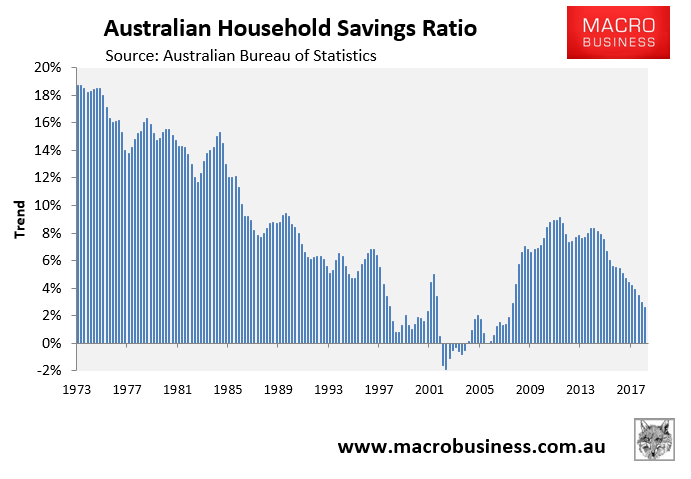
This has been achieved by running down their savings and increasing debt:
Advertisement
The saving rate has been falling since late-2011 and is currently tracking at the lowest level since the Global Financial Crisis (GFC).
This means that expenditure growth over that period has outpaced income growth precisely because the saving rate has fallen. In other words, Australian households are drawing down their savings in order to maintain a constant level of consumption.
There are obviously limits to this phenomenon. At some point, the household savings rate must stabilise if not increase, and falling house prices will likely be the trigger for it. And in the absence of a pick-up in wages growth, this means household consumption growth must necessarily fall.
Advertisement
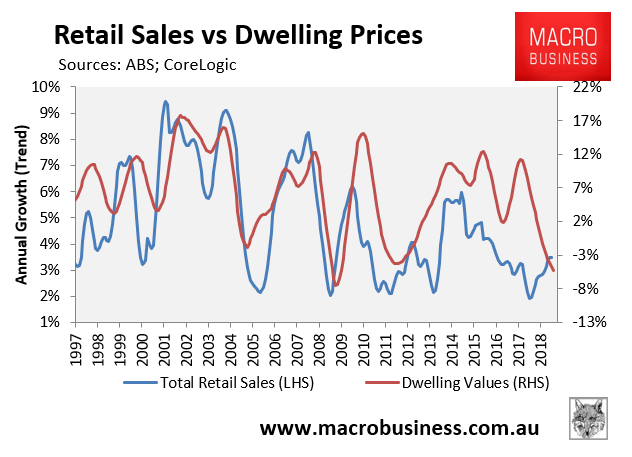
Indeed, there has historically been a reasonably strong correlation between dwelling price growth and retail sales:
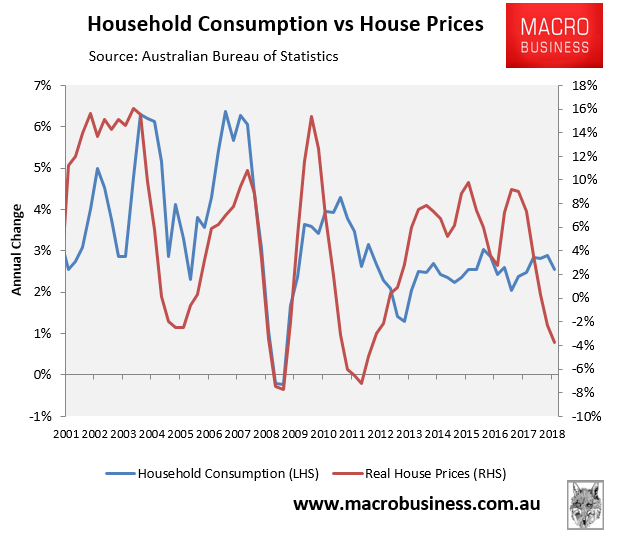
As well as dwelling price growth and household consumption:
Advertisement
So, with Australian dwelling values falling, led by Sydney and Melbourne, this will ultimately act as a constraint on households’ willingness or ability to continue drawing down their savings and leveraging-up with debt, as well as spending.
Therefore, we see weaker household consumption expenditure growth in 2019, and corresponding weaker economic activity.
Falling dwelling investment:
Advertisement
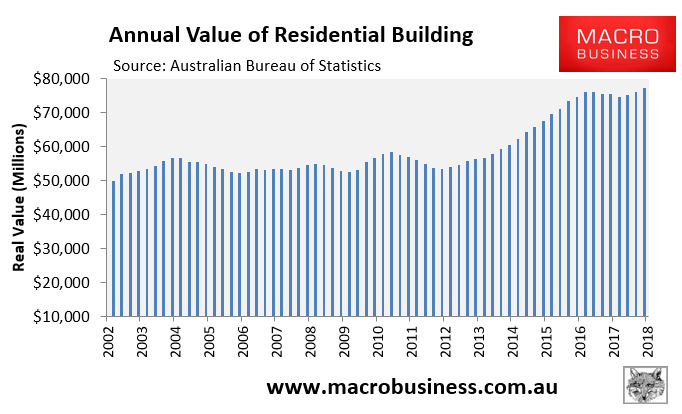
In addition to the budding downturn in dwelling prices, Australia’s epic apartment construction-led boom will very likely unwind in 2019. This is significant because rising dwelling construction has been one of the Australian economy’s major growth supports since the mining construction boom ended in late-2012:
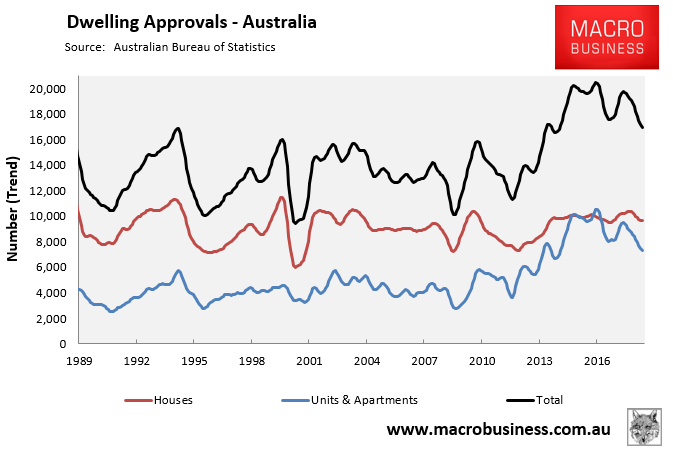
The forward looking indicator of dwelling approvals are falling fast in trend terms and are down 16.1% since peaking in March 2015:
Advertisement
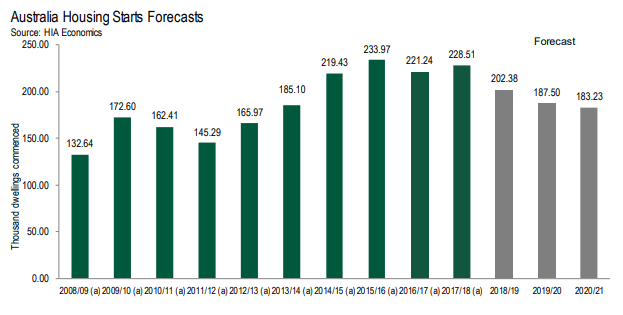
Whereas the latest forecast from the Housing Industry Association has dwelling starts declining by 20% in total to 2020-21, with an 11% decline expected for 2018-19 alone:
Advertisement
As dwelling construction falls, it will obviously detract from ‘jobs and growth’ (more on this below).
State Budgets to come under pressure:
The collapse in real estate transaction volumes is also very bad news for those groups heavily reliant on property transactions, such as real estate agents, household goods retailers, and state governments (via stamp duty).
Advertisement
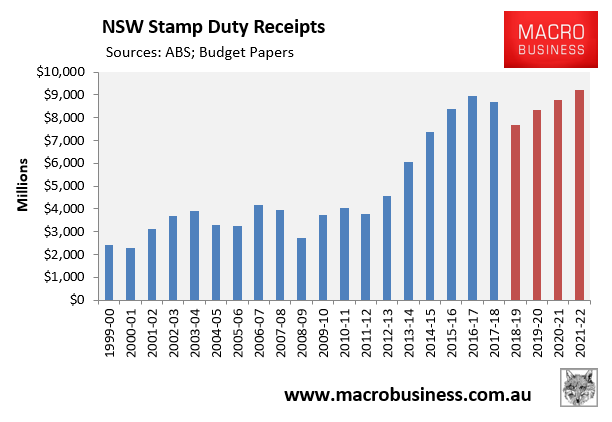
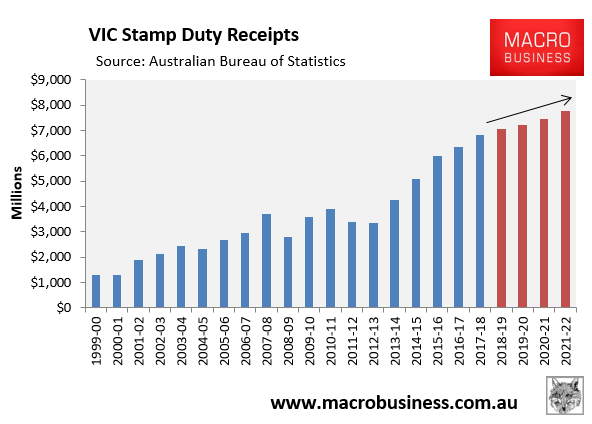
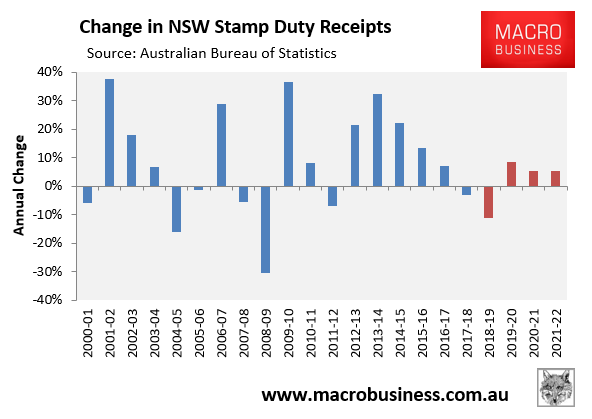
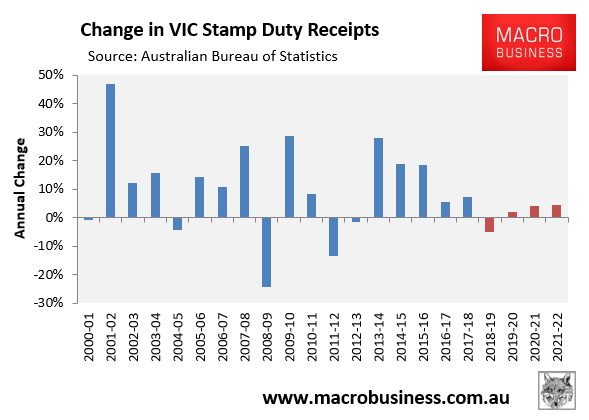
The latter group – state governments – are particularly exposed, especially in New South Wales and Victoria. Both states have reaped a massive windfall from stamp duty receipts over the past five years, and both have ridiculously optimistic forecasts for future stamp duty revenue (see red bars below):
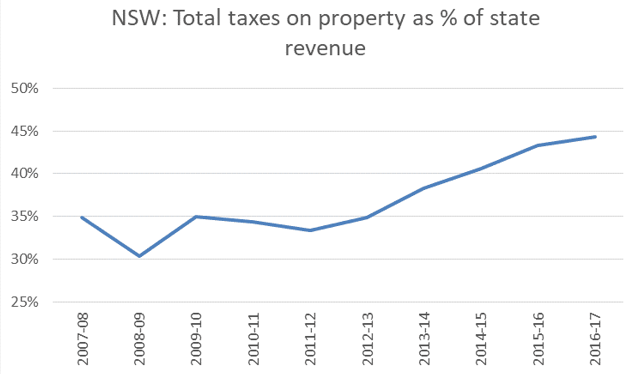
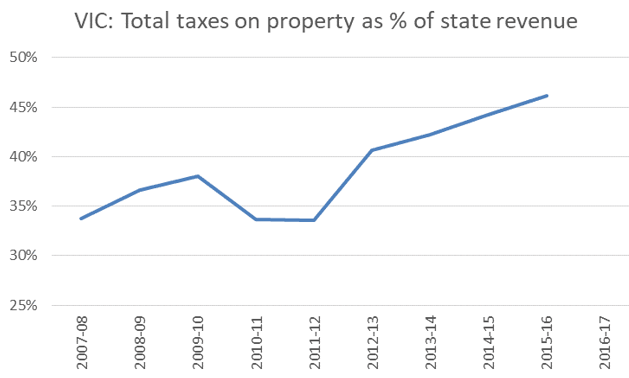
Both states have also become increasingly reliant on property taxes, with the share of New South Wales tax revenue from property growing from around a third to nearly 45% between 2011-12 and 2016-17, and Victoria’s growing from around a third to more than 45% of all income over the same period:
Advertisement
Both New South Wales and Victoria experienced large reductions in stamp duty receipts following the GFC – 31% and 24% respectively – off relatively minor and short-lived 7% to 8% declines in dwelling values:
Advertisement
Therefore, if Sydney and Melbourne dwelling values decline by 15% to 20%, as economists like Shane Oliver are predicting, then the New South Wales and Victorian Governments could easily face $3 billion annual writedowns in stamp duty receipts.
Declines in revenue of this magnitude would place infrastructure commitments at risk, dealing a further blow to ‘jobs and growth’ down the track.
The upshot: Economy to slow in 2019:
Advertisement
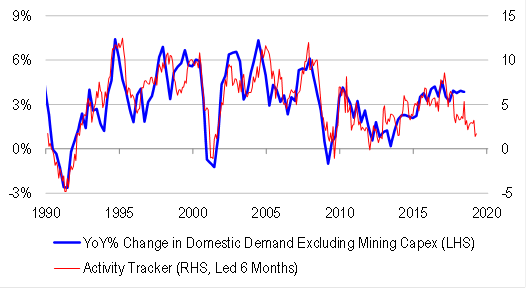
The next chart tracking the contributors to Australian domestic economic activity (final demand) illustrates the dilemma facing the Australian economy in 2019 and beyond:
The end of the mining investment slump has seen a rebound in business investment, which contributed 0.5% to the 3.1% growth in real final demand in the year to September 2018.
Advertisement
We expect this positive contribution from business investment to continue in 2019. This is because in the year to September 2018, business investment grew by 3.6%, whereas the Q3 capex expectations survey revealed a 4.4% lift for 2018-19. But as the year wears on we expect the growth rate fall away with wider domestic demand.
This is where the good news ends, however. As discussed above, dwelling construction is projected by the HIA to fall by 11% in 2018-19 and a further 7% in 2019-20, and this view is supported by the sharp fall in dwelling approvals. Therefore, dwelling investment is very likely to detract from growth in 2019 and 2020, although the magnitude of the drag is uncertain.
Public demand – which captures the current infrastructure mini-boom as well as the roll-out of the NDIS – added 1.0% to this year’s 3.1% growth in real final demand.
Advertisement
However, like dwelling construction, this kind of investment only adds to economic activity while the amount being spent is increasing. That is, it is no good remaining on a high plateau of spending, it must increase every year to add to growth.
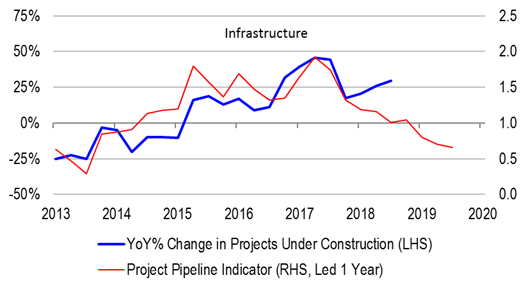
The bad news is that public investment looks to have already peaked and, therefore, may actually subtract from growth in 2019. The below charts from Credit Suisse tell the story and shows that the infrastructure pipeline is shrinking fast:
Our view is that the economy is overshooting… We think that the [economy] is still being supported by infrastructure….
Infrastructure spending is providing a circuit breaker between falling house prices and the aggregate spending. Employment growth has been remarkably resilient, allowing households to absorb negative wealth and credit effects from housing downturn.
But if the infrastructure pipeline is not topped up in a timely fashion, the risk is that the public spending impulse will fade, employment growth will slow, and private sector de-leveraging forces will take over.
Advertisement
This brings us to the biggest growth risk – household consumption – which typically accounts for 57% of real final demand and contributed 1.6% of the 3.1% final demand growth in the year to September 2018.
As noted above, household consumption is facing stiff headwinds in 2019 from falling real wages, falling dwelling values, as well as record household debt. In 2018, these headwinds were overcome by the compression in the household savings rate to the lowest level in the post-GFC era. But this is unlikely to repeat in 2019 given the obvious limits to households’ ability to drawdown savings. Even if the savings rate merely stabilises, let alone falls, then consumption growth will fall.
The upshot is that we see overall growth falling in 2019 from 3.1% currently to something below 2%, thus barely keeping pace with population growth (1.6%).
Advertisement
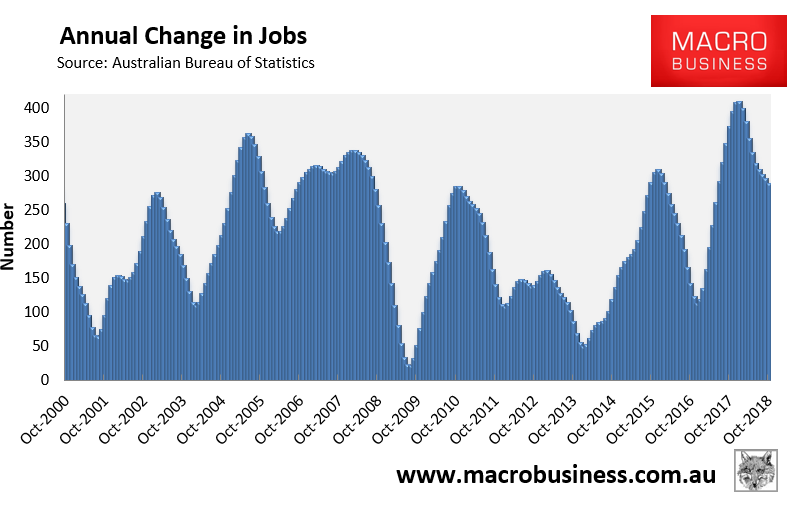
We also see momentum in the labour market continuing to weaken from current solid levels. While current jobs growth remains strong, it has faded substantially from the circa 400,000 this time last year to around 280,000 currently:
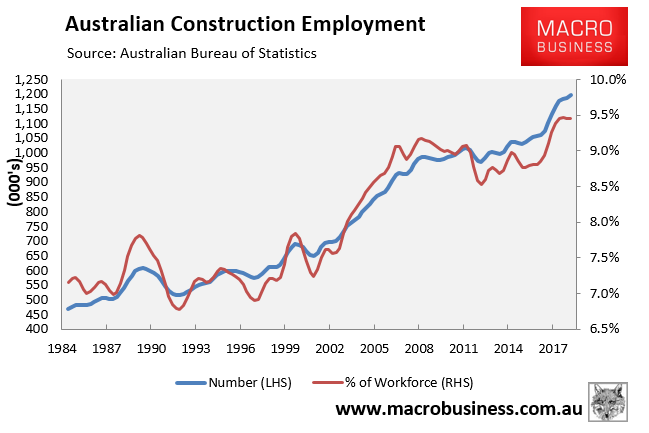
Importantly, there are currently 1.2 million Australians (9.5% of the workforce) employed directly in the construction sector, which has increased from around 700,000 at the beginning of the mining boom:
Advertisement
Over the past few years, the dwelling construction and infrastructure booms have offset the decline in mining investment. However, in 2019, we will likely see employment activity in housing construction and infrastructure fall, dragging down overall employment growth.
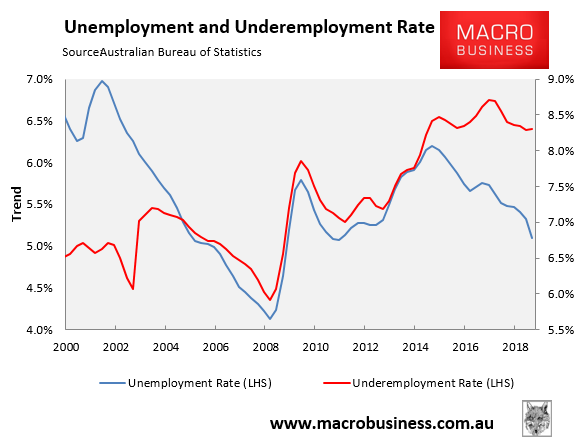
With Australia’s labour force growing by around 20,000 people a month due to strong population growth, the economy needs to generate around 240,000 jobs a year to keep the unemployment rate steady (other things equal). Therefore, we see unemployment and underemployment creeping upwards over 2019.
Advertisement
National income recession to reassert itself:
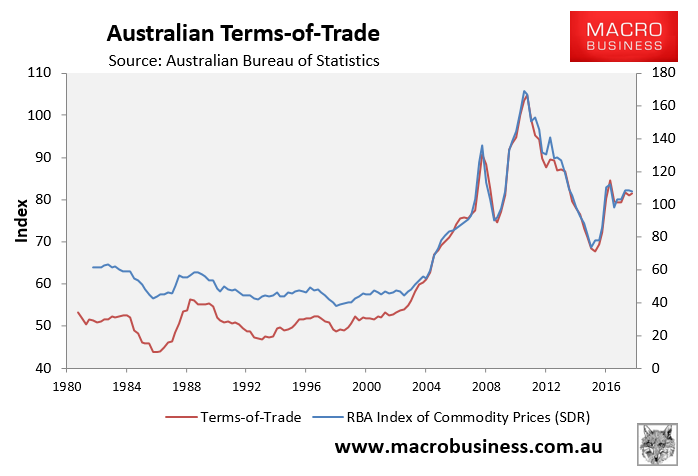
One area where we missed badly last year was our forecast that commodity prices and the terms-of-trade would fall in 2018. Instead, we saw both rise moderately, thus extending the commodity mini-boom for another year:
Advertisement
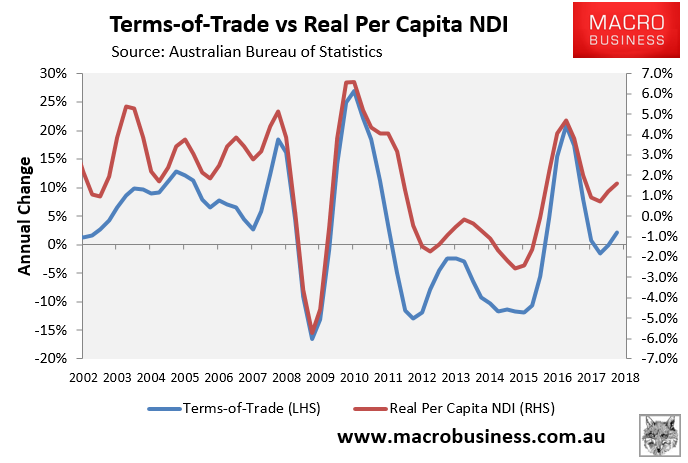
This extension of the terms-of-trade boom supported national disposable income (NDI) growth:
Advertisement
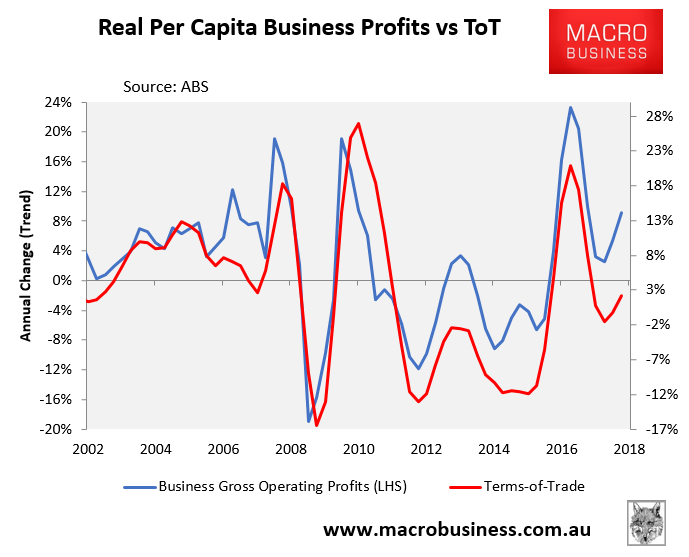
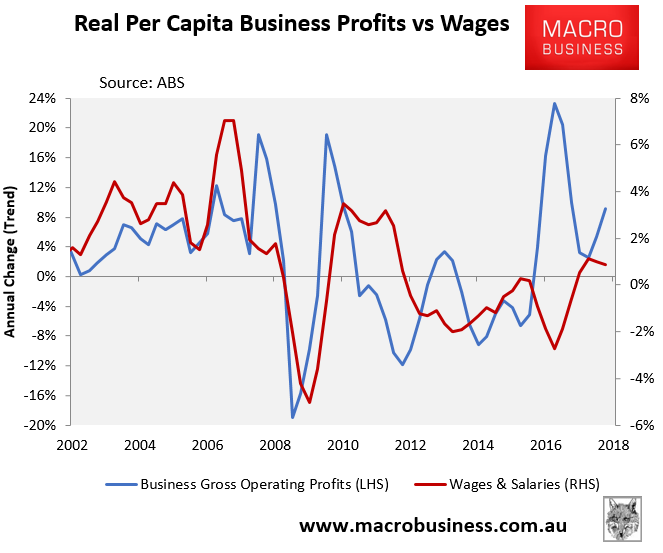
Although unfortunately, this income mini-boom again flowed almost exclusively to Australian businesses, rather than workers:
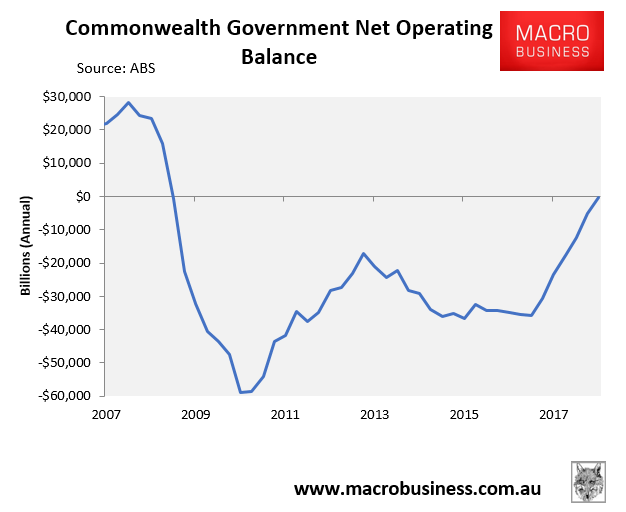
Nevertheless, it also helped to fill the government’s coffers with extra tax revenue, thereby reducing the Budget deficit and facilitating the significant public investment boom that has bolsted Australia’s economic growth:
Advertisement
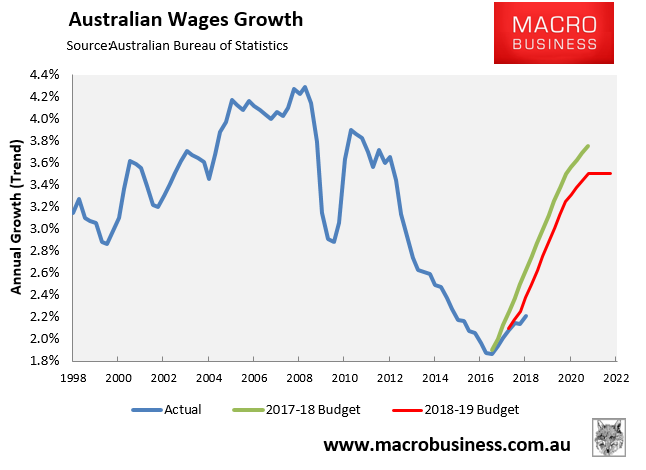
MB believes that commodity prices and the terms-of-trade will finally fall in 2019 (see below), meaning that business profits, national income and the federal Budget will all take a hit. It will also all but extinguish hopes that strong business profits will eventually flow to workers in the form of higher wages, thereby smashing the May Budget’s optimistic forecasts of a wages explosion – a central plank to the federal government’s planned path back to Budget surplus:
Advertisement
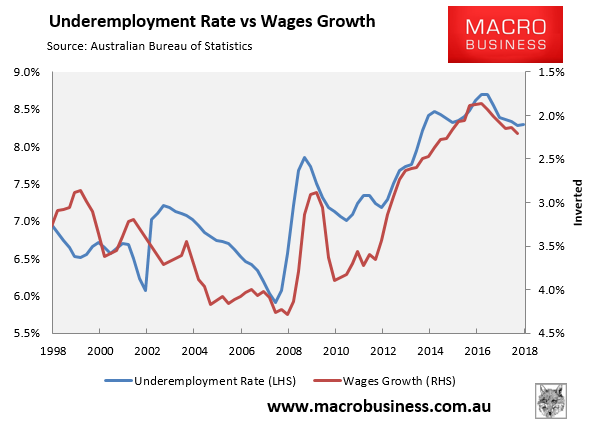
Indeed, wages growth is strongly correlated with the underemployment rate. And with the labour market likely to soften in 2019, the hopes for a meaningful rebound in wages growth look heroic:
Commodity prices to continue falling in 2018:
Advertisement
Global markets are late cycle. This includes China, to the extent that such definitions matter to its centrally-planned economy.
The US economy will slow throughout 2019 as the previous Federal Reserve tightening takes its toll on interest rate sensitive sectors, the fiscal cliff derived from Trump tax cuts strikes, and the oil patch consolidates. The Fed will stop hiking soon and shift to a month-to-month data driven reaction function. We see little prospect of US easing in 2019.
Europe is headed back into its perennial stagnation and will provide little impetus for global markets. The ECB has exited QE too early and will never raise interest rates, pressuring the euro. Brexit is an outstanding risk in March and European elections in May will be raided by anti-European parties.
Advertisement
These factors between them will keep the US dollar strong and, by consequence, emerging markets weak.
This is a difficult backdrop for China next year. Indeed, it is so difficult that it offers a hint as to why it has begun to buckle on trade war concessions. China is caught between the rock of domestic deleveraging and the hard place of falling external demand.
On the former it is very clear that measures to control debt growth are slowing activity and will do so much more in H1 2019:
Advertisement
China needs to cut its interest rates but hasn’t done so far. One reason why is that it does not want the yuan to fall and make the trade war with the US worse, as well as raise the cost of capital locally.
For now we see China continuing to do what it has been so far doing, using iterative steps to ease policy via money markets, reserve ratio cuts and sporadic fiscal stimulus. But, as we have seen for repeated mini-cycles, this will not turn the economy so long as credit growth keeps slowing. So much Chinese growth is now a driven by the debt-addicted construction monster that keeping it humming is a immense challenge all on its own. 2018 saw more building by floor area that any previous year by miles:
Advertisement
It only takes a pause in this staggering waste to crash bulk commodity prices, as we saw in 2015, and a pause is now coming.
So, we see China slowing through H1, 2019 before finally breaking into another panic and throwing in another round of kitchen sink stimulus. There are many factors that determine bulk commodity prices but Chinese macro is by far the most important. So, as China struggles with its new slowdown we see iron ore reverting to a new lower trading range between $50-60 with coking coal slumping to $140-150. There are large downside risks to these if China drags its heals on stimulus.
Advertisement
These are not severe enough to rerun the 2015 Australian Budget crisis but they are enough to dry up the current mining taxes ‘rivers of gold’ meaning that misses to local growth forecasts will drag the Budget into deficit again.
This is a developing marginal negative for politics, hoped for tax relief for households and the broader economy as the endless income recession intensifies.
Navel gazing into 2020:
Advertisement
Based on current indicators, a difficult 2019 is penciled in, driven by ongoing dwelling price falls in Sydney and Melbourne.
Indeed, we see the housing correction steepening next year, weighed down by a multitude of headwinds.
First, the Hayne banking royal commission is scheduled to hand down its final report in February and is likely to document further criminality and widespread mortgage fraud. We, therefore, expect further tightening in lending standards and restriction of credit to follow, placing additional downward pressure on dwelling prices.
Advertisement
Most importantly, the royal commission is likely to banish the Household Expenditure Measure (HEM) – a relative poverty measure – from being the default credit assessment tool used by lenders. This is significant as the commission’s interim report found that “three out of every four home loans examined in the course of APRA’s 2016/2017 targeted review into home lending practices… assumed that the borrower’s household expenditures were equal to the relevant HEM”. The interim report explicitly attacked the banks for failing to fulfill their legal obligations to make reasonable inquiries about borrowers’ financial situation, as well as properly verifying their information, foreshadowing tougher regulatory action down the road.
Already, we have seen banks move away from the HEM in preparation of the royal commission’s final report. For example, CBA and ANZ were pinged for defaulting to the HEM for three quarters of their loan assessments. CBA has already pulled that back to 40-50%, whereas ANZ has vowed to reduce its use of the HEM to one-third of its mortgage applications.
If the HEM ends up being effectively outlawed as a credit assessment tool, then something like one quarter of loans that were formerly rubber stamped would no longer be available, or much smaller, as income and expenses are assessed properly.
Advertisement
This tightening has already happened. We see it as a generational shift. There is little any corrupt regulator can do to reverse it.
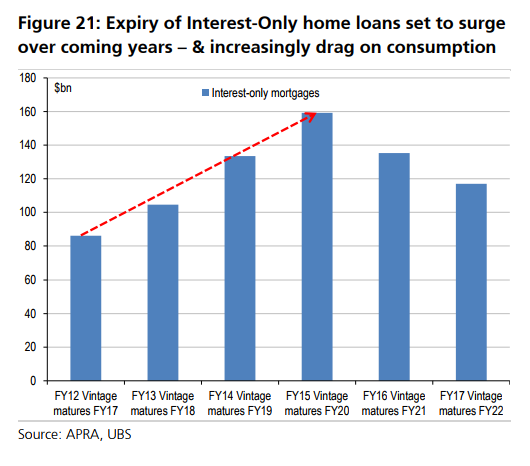
The second major headwind for the housing market in 2019 and extending into 2020 is the ongoing interest-only mortgage reset. According to analysis by UBS, the volume of interest-only mortgages due to expire will rise from $105 billion in 2018 to $133 billion in 2019, and then peak at $159 billion in 2020:
Advertisement
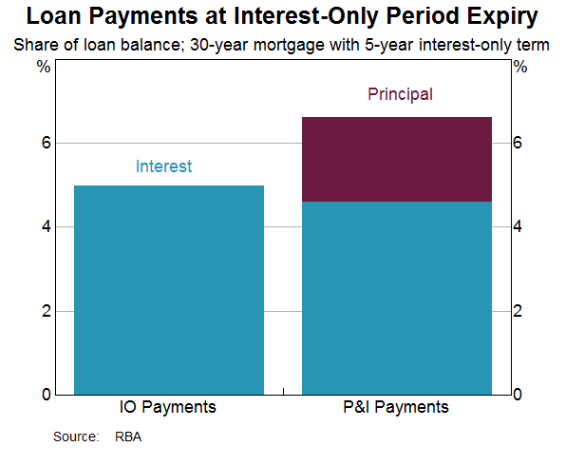
Borrowers switching from interest-only to principle and interest mortgages are facing a 35% increase in mortgage repayments, according to the RBA, representing another drain on household cash flow and consumption, and potentially resulting in forced-sales as borrowers struggle with cash flow:
Banks are ahead of schedule on the reset but it is ongoing. Moreover, there will no imminent return of the interest-only boom given it was the core of the bubble blow-off and is also under intense scrutiny at the Hayne royal commission, as well as several very large private class actions by aggrieved borrowers.
Advertisement
The third major headwind for housing is further mortgage tightening coming from regulators and markets. Banks are scheduled to adopt comprehensive credit reporting which APRA will use to apply 6-times debt-to-income limits.
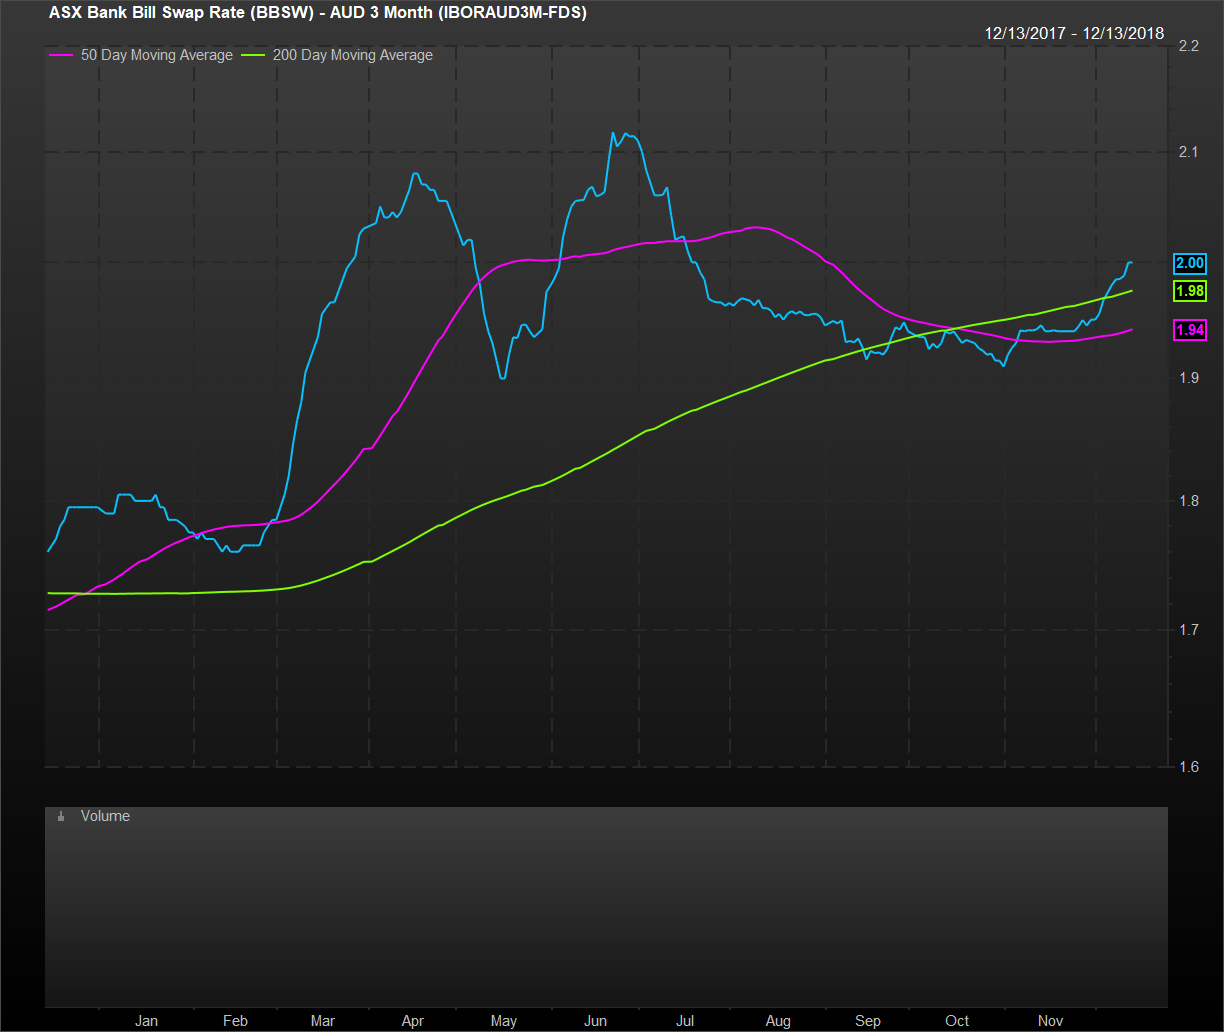
As well, ever since the Hayne banking royal commission revealed Australia’s gigantic mortgage fraud, short term funding costs for banks have been rising. This unprecedented outcome has persisted all year:
Advertisement
We see this as counter-party risk in the banks themselves. That is, they no longer fully trust each other’s credit quality and are charging more to lend to one another. This has already driven banks to out-of-cycle rate mortgage rate hikes this year and it will do so again next year if the RBA does not cut rates (in which case banks will pad out margins by holding some cut back from mortgagees).
Fourth, there are two major elections – New South Wales and federal – due to take place in the first half of 2018. We see this as having a dampening impact on both the economy and housing market that risks a feedback loop of rising unemployment and house prices.
That said, post-election we could also see a confidence rebound in the second half, as often arrives with a new government. Or not.
Advertisement
Our fifth headwind is that Labor looks certain to storm the federal election and one of its signature policies, which it has recommitted to repeatedly, is to restrict negative gearing to newly constructed dwellings as well as halve the capital gains tax discount. Given investors comprise half of all mortgages (excluding refinancings) in Sydney and 40% in Melbourne, Labor’s reform would obviously remove a significant share of new demand into those markets, thereby lowering prices.
If implemented in mid-2020, as flagged by Labor, our best guess is that the reforms could shave another 5% to 10% of value from Sydney’s and Melbourne’s homes. Given dwelling values in both cities will likely already be down around 20% or more by this stage, both markets could conceivably see peak-to-trough declines of 25% to 30%, with national declines of around 20% – a bonafide housing crash.
Sixth, the withdrawal of Chinese buyers will continue. As China slows next year it will eventually be forced to cut its own cash rate. That is going to pressure the yuan lower and trigger capital outflow. Given the danger that poses in an exacerbated trade war (and other current account risks), this will result in even more Chinese capital account tightening meaning that Chinese individuals and businesses will be unable to get money out of China and may, in fact, be forced to repatriate it.
Advertisement
We see this process as structural and irreversible. As Chinese capex-led growth grinds into stagnation, it’s deflation will intensify and its interest rates will join the global zero bound club. To prevent a collapse of the yuan, Chinese capital flows may even need to be inhibited in the trade account. That is, students and tourists will be kept at home, with obvious implications for Australia. Though we don’t see this as imminent.
By this time next year, we expect Sydney dwelling values to be tracking close to 20% below their peak, Melbourne’s 15% below peak, and values nationally down around 10%. Even if declines stopped there, it would represent the biggest housing correction on record (40 years) across those markets, according to CoreLogic.
How bad the housing bust gets will obviously depend on other factors. For example, we see it as a near certainty that the next move in interest rates will be down, with the first move most likely some time in the second half of 2019, once the RBA belatedly realises that its bullish forecasts for the economy are fantasy. This could foster a stabilisation of house prices in early 2020 prior to the introduction of Labor’s policy.
Advertisement
However, with Australia’s cash rate already at a record low 1.5%, there isn’t much room for the RBA to cut, since Australia must maintain a positive margin to fund Australia’s gaping current account deficit. Even if the RBA slashed the cash rate to just 0.5%, then it is likely that the banks would keep half to offset higher funding costs and to arrest falling net interest margins. Therefore, mortgage borrowers would likely only get 0.5% of mortgage relief before the RBA has run out of interest rate bullets. We see these rate cuts beginning by mid-2019.
There is also the likelihood that the new Labor government would introduce a stimulus package to soften the implementation of its negative gearing policy, such as a form of first home buyer (FHB) grant. It would play well with FHBs who would receive the double dividend of having less investors to compete against, as well as taxpayer subsidies at their disposal.
A FHB stimulus package would obviously help stem the bleeding, but wouldn’t be enough to offset the impact of its negative gearing policy, since investors outweigh FHBs more than three-to-one by value:
Advertisement
There is also the possibility that Labor ends up abandoning its negative gearing reforms, or cannot get its reforms through the Senate. However, we see this scenario as unlikely, since it is a signature policy and would represent a massive backflip. Along with the Greens, Labor will likely only need to gain the support of a few cross-benchers, some of whom are already amenable to negative gearing reform.
In short, while we are very confident that dwelling price falls will continue in earnest in 2019, based on all current market indicators pointing down amid further credit tightening, we are less confident looking further ahead. The second half of 2019 is likely to see a raft of stimulus measures to try to save the the market. We do not see them being very successful, with little prospect of any sustained turn for prices, but they may deliver some price stability for a time.
Advertisement
Beyond that we see prices falling again, in nominal or real terms, as either the global end of cycle shock strikes, finding Australia with no monetary bullets left to fire. Or, if global authorities manage to kick the cycle forward, also ahead is the steady stagnation of Chinese growth and further commodity price falls into the early 2020s, intensifying the Australian income recession and dragging asset prices lower as well.
The upshot is that Australia is almost certainly headed for the worst housing correction in 40-years, with a reasonable likelihood of experiencing a bona fide housing crash whereby peak-to-trough declines exceed 20% across the capitals. We see almost no chance of a material price rebound and high likelihood that the correction marches on for years in fits and starts.
One way or another, the Great Australian Housing Bubble is done for.