The 13th Annual Demographia International Housing Affordability Survey has just been released and, once again, it ranks Australia as having one of the most expensive housing markets out of the countries surveyed.
This year’s report assesses 406 urban markets in nine countries: Australia, Canada, Hong Kong, Ireland, Japan, New Zealand, Singapore, United Kingdom, and the United States as at the third quarter of 2016.
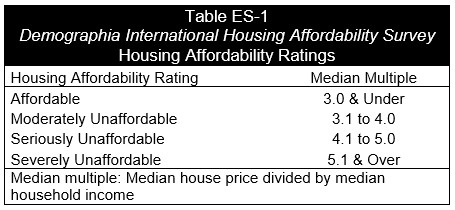
The survey employs the “Median Multiple” (median house price divided by gross annual median household income) to rate housing affordability. This measure is widely used for evaluating urban markets, and has been recommended by, amongst others, the World Bank and the United Nations, and is used by the Harvard University Joint Center on Housing.
Advertisement
The Survey ranks urban housing markets into four categories based on their Median Multiple, from “Affordable” (3.0 or less) to “Severely Unaffordable” (5.1 & Over) [Table ES-1]. Average multiple data (average house price divided by average household income) is used in Japan, since data for estimating medians is not readily available.
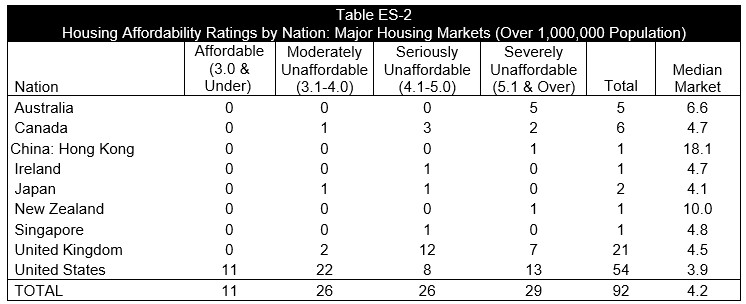
According to the Survey, housing affordability remained poor across most major metropolitan markets in 2016 (i.e. with over 1 million people).
Advertisement
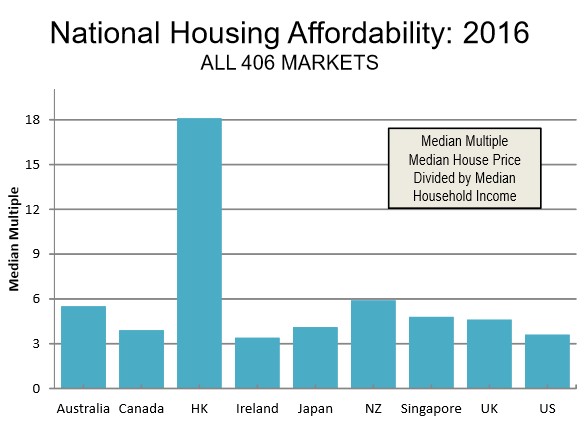
At the national level, Hong Kong has by far the most unaffordable housing, with a median multiple of 18.1. New Zealand is the second most unaffordable market with a median multiple of 5.9, followed by Australia (5.5), Singapore (4.8), the UK (4.6), Japan (4.1), Canada (3.9), the US (3.6) and Ireland (3.4):
Advertisement
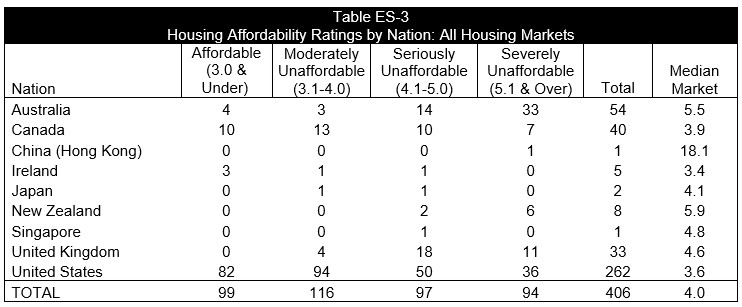
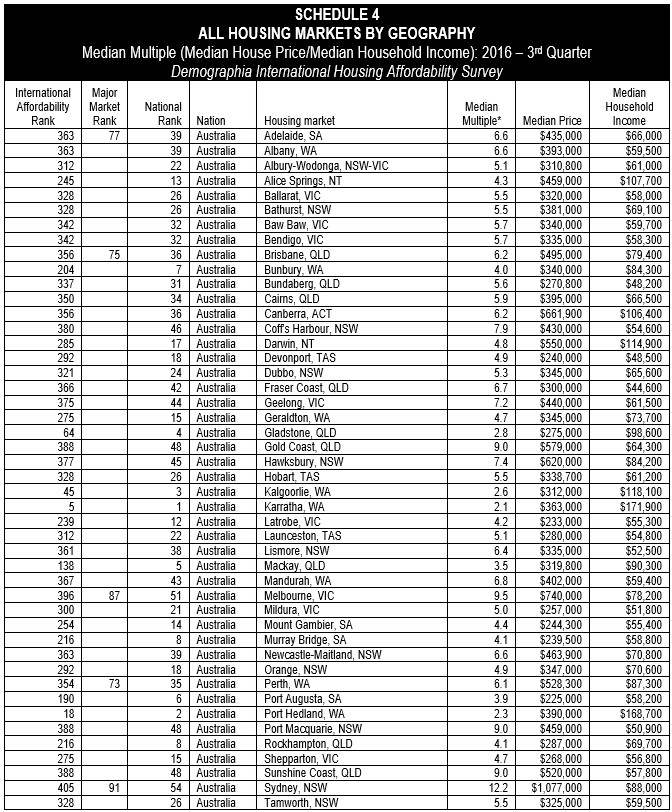
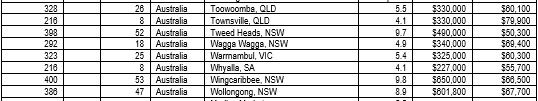
As shown in the above table, all but seven of Australia’s 54 markets captured in the survey are ranked as either “Seriously Unaffordable” (14) or “Severely Unaffordable” (33). The result represents little change from last year’s survey, where 33 markets were ranked as “Severely Unaffordable” and 12 were ranked as “Seriously Unaffordable”.
A break-down of Australia’s rankings are provided in the below table:
Advertisement
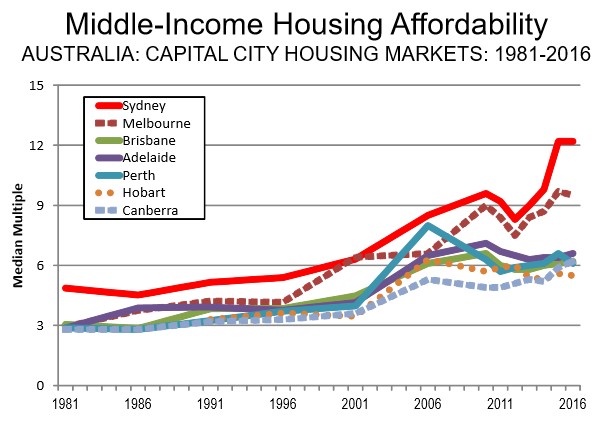
In 2016, the bubble epicentres of Sydney (12.2) and Melbourne (9.5) remained near their highest median multiples on record:
Advertisement
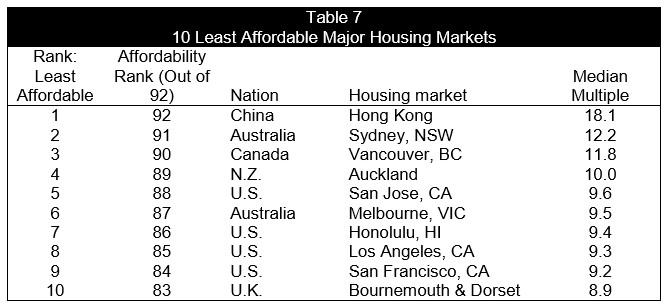
And Sydney was the second most expensive housing market out of the nine nations surveyed, with Melbourne the sixth most expensive:
Advertisement
By contrast, the most affordable market in Australia was Karratha, with a Median Multiple of 2.1, and rated “affordable.” Port Hedland (2.3), Kalgoorlie (2.6), and Gladstone (2.8) were also “affordable”. Both have obviously been hit hard by declining resource markets.
The overall decline of housing affordability in Australia over the past few decades is also clearly evident in the above Demographia chart. Whereas all major Australian markets, except Sydney, had Median Multiples of three in the early 1980s, today all are ranked at around five or above (well above in the case of Sydney and Melbourne).
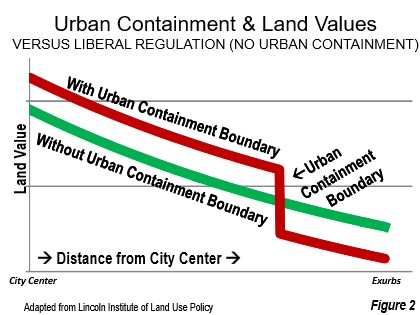
One of the key contentions of the Demographia Survey is that higher land prices are the principal contributor to the rapidly increasing home prices in unaffordable markets, as well as increased speculative activity. These land prices include the cost increasing influence of land supply restrictions (such as urban growth boundaries), excessive infrastructure fees and other overly strict land-use regulations:
Advertisement
… in many housing markets, house prices have skyrocketed compared to household incomes. The most severe house price increases have been limited to housing markets where urban containment policy (or its equivalent) have been implemented. Generally, urban containment policy draws a development limit around the urban area and seriously limits or even prohibits greenfield development of housing tracts on the urban fringe. Consistent with the basics of economics, this is associated with higher land prices and, in consequence higher house prices (Figure 2).
Virtually across the road land value gaps of ten or more times result. This destroys the competitive market for land by removing the “supply vent”19 necessary to maintain housing affordability…
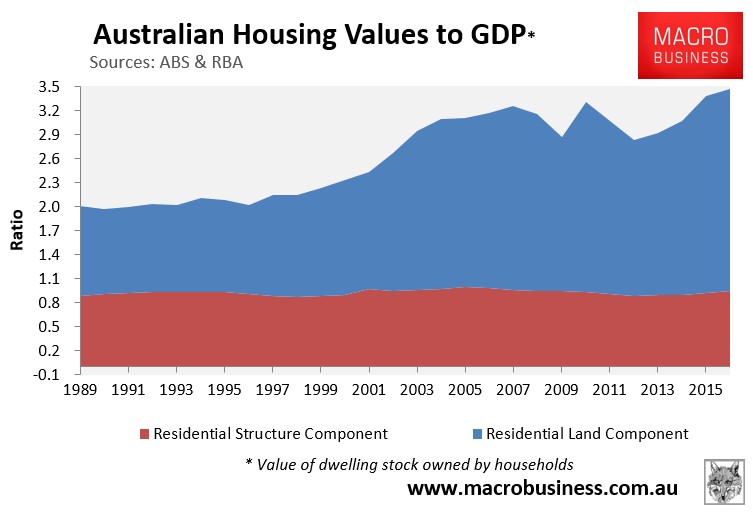
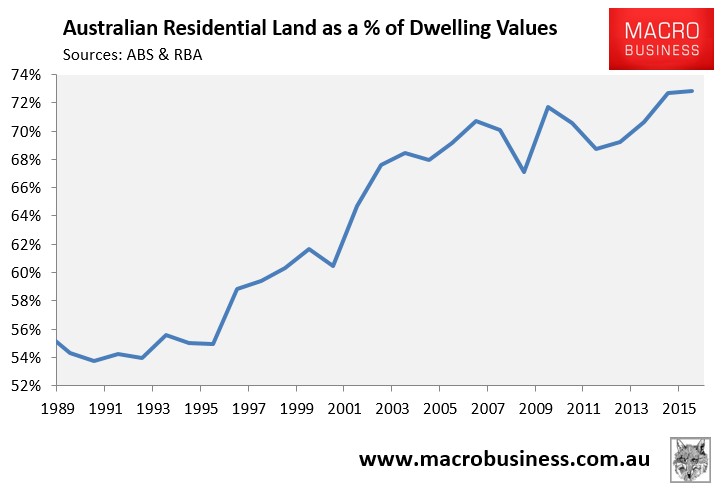
Demographia’s contention that Australia’s rising home prices have been caused primarily by escalating land costs is supported by evidence. The below chart shows aggregate Australian housing values relative to GDP broken down by the land component and the structure component. As you can see, almost all of the growth in Australian housing values (relative to GDP) has been in rising land values:
Advertisement
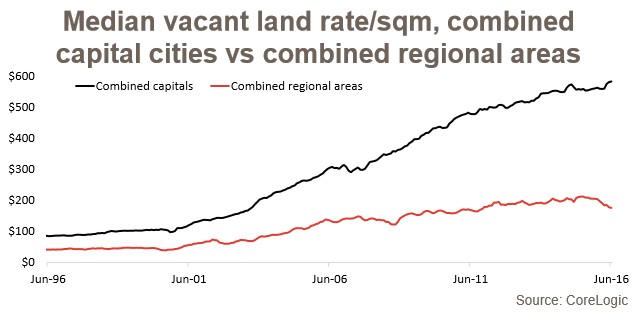
Meanwhile, CoreLogic has recorded massive rises in the value of Australian vacant land:
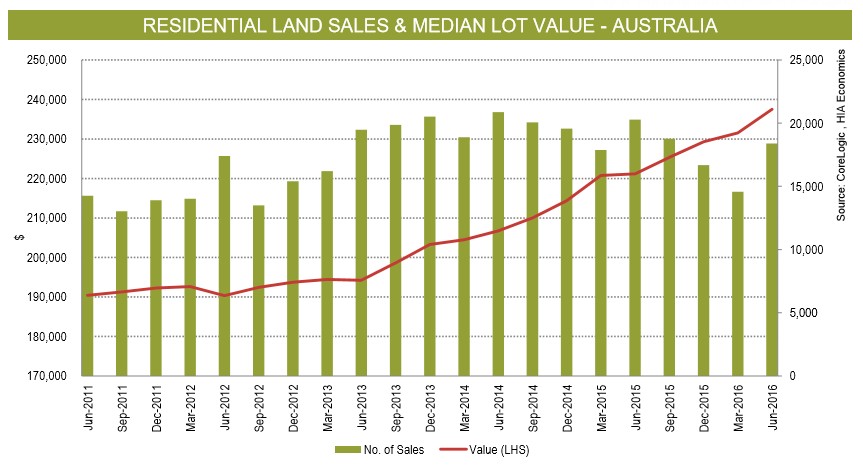
Whereas the HIA has recorded rising land values at the same time as lot volumes have contracted (suggesting choked supply):
Advertisement
A key reason for this land price escalation in Australia (as well as in New Zealand, the United Kingdom, and the expensive markets of the United States and Canada) is that the market’s ability to quickly provide low priced new housing supply is being hampered by restrictive land use regulations, many of which have come into effect since the mid-1990s (Sydney has had long-standing limits on housing development on the urban fringe). Demographia describes the key features and consequences of restrictive housing markets as follows:
More Restrictive Land Use Regulation uses urban containment policy or other mechanisms (such as comprehensive plans or development limits) to such an extent that the competitive market for land is not permitted to operate on the urban fringe. More restrictive land use regulation seeks to outlaw the liberal regulation that produced middle-income housing affordability.
Urban containment strategies are the most important of more restrictive land use regulation. Generally, urban containment regulation is “plan-driven,” as planning departments and governments determine where new housing is allowed to be built. There is a “negative presumption,” with new development generally prohibited, except in limited areas where it is permitted by government plans. Typically, urban containment policies include urban containment boundaries and related variations (such as urban growth boundaries, green belts, urban service districts, “growth areas” and other strategies that substantially reduce the amount of land available for house building. Urban containment policy may also be characterized by terms such as “densification policy,” “compact development”, “urban consolidation”, “growth management” “and “smart growth.”
By severely limiting or even prohibiting development on the urban fringe, urban containment eliminates the “supply vent” of urban fringe development, by not allowing the supply of housing to keep up with demand, except at prices elevated well above historic norms.
Urban containment policies are often accompanied by costly development impact fee regimes that disproportionately charge the cost of the necessary infrastructure for growth on new house buyers. There is particular concern about the cost increasing impacts of these fees and levies, especially in Australia, Canada (Canada Mortgage and Housing Corporation), New Zealand (New Zealand Productivity Commission) and California…
Advertisement
By contrast, affordable housing markets, like many cities in the US, utilise open market-based land use structures whereby plentiful new housing supply is able to be built quickly and cheaply on the urban fringe, thereby preventing rapid house price escalation. Demographia describes these markets as follows:
Liberal Land Use Policy (Less Restrictive Markets) applies in markets not classified as having more restrictive land use regulation (where competitive land markets are permitted to operate on the urban fringe). In these markets, residential development is allowed to occur based upon consumer preferences, subject to basic environmental regulation. Generally, liberal land use regulation is “demanddriven” Land is allowed to be developed, except in limited areas, such as parks and environmentally sensitive areas. By allowing development on the urban fringe, liberal land use regulation allows the “supply vent” to operate, which keeps house prices affordable. Less restrictive regulation can also be called traditional or liberal regulation. In addition to lower housing costs relative to incomes, the lower population densities typical of liberal markets are associated with less intense traffic congestion and shorter average work trip journey times. Liberal land use regulation has also been called “traditional” regulation.
So, under an open market-based model (provided there are not also substantial physical barriers to housing supply), increased demand, such as from reduced lending standards and easier availability of credit, quickly leads to the building of additional low priced housing on the urban fringe, which helps keep house prices in check and reduces the likelihood of speculative housing bubbles developing. Further, highly leveraged speculators are less likely to be encouraged into open land markets, since there is little prospect of achieving strong capital gains. Investing in open land markets is, instead, more about rental yield.
Advertisement
I will add that restrictive urban planning structures should not be viewed as a one-way bet for house prices, with unresponsive land supply also more likely to result in higher levels of house price volatility and boom/bust price cycles – a fact also acknowledged by Demographia and evident in Ireland’s boom and bust.
Why? Because strict land-use policies (planning) steepens the supply curve, which makes house prices more sensitive to changes in demand, increasing the likelihood of the housing market experiencing boom/bust price cycles as demand rises/falls.
The full 2017 Demographia Housing Affordability Survey can be downloaded here.
Leith van Onselen is Chief Economist at the MB Fund and MB Super. He is also a co-founder of MacroBusiness.
Leith has previously worked at the Australian Treasury, Victorian Treasury and Goldman Sachs.