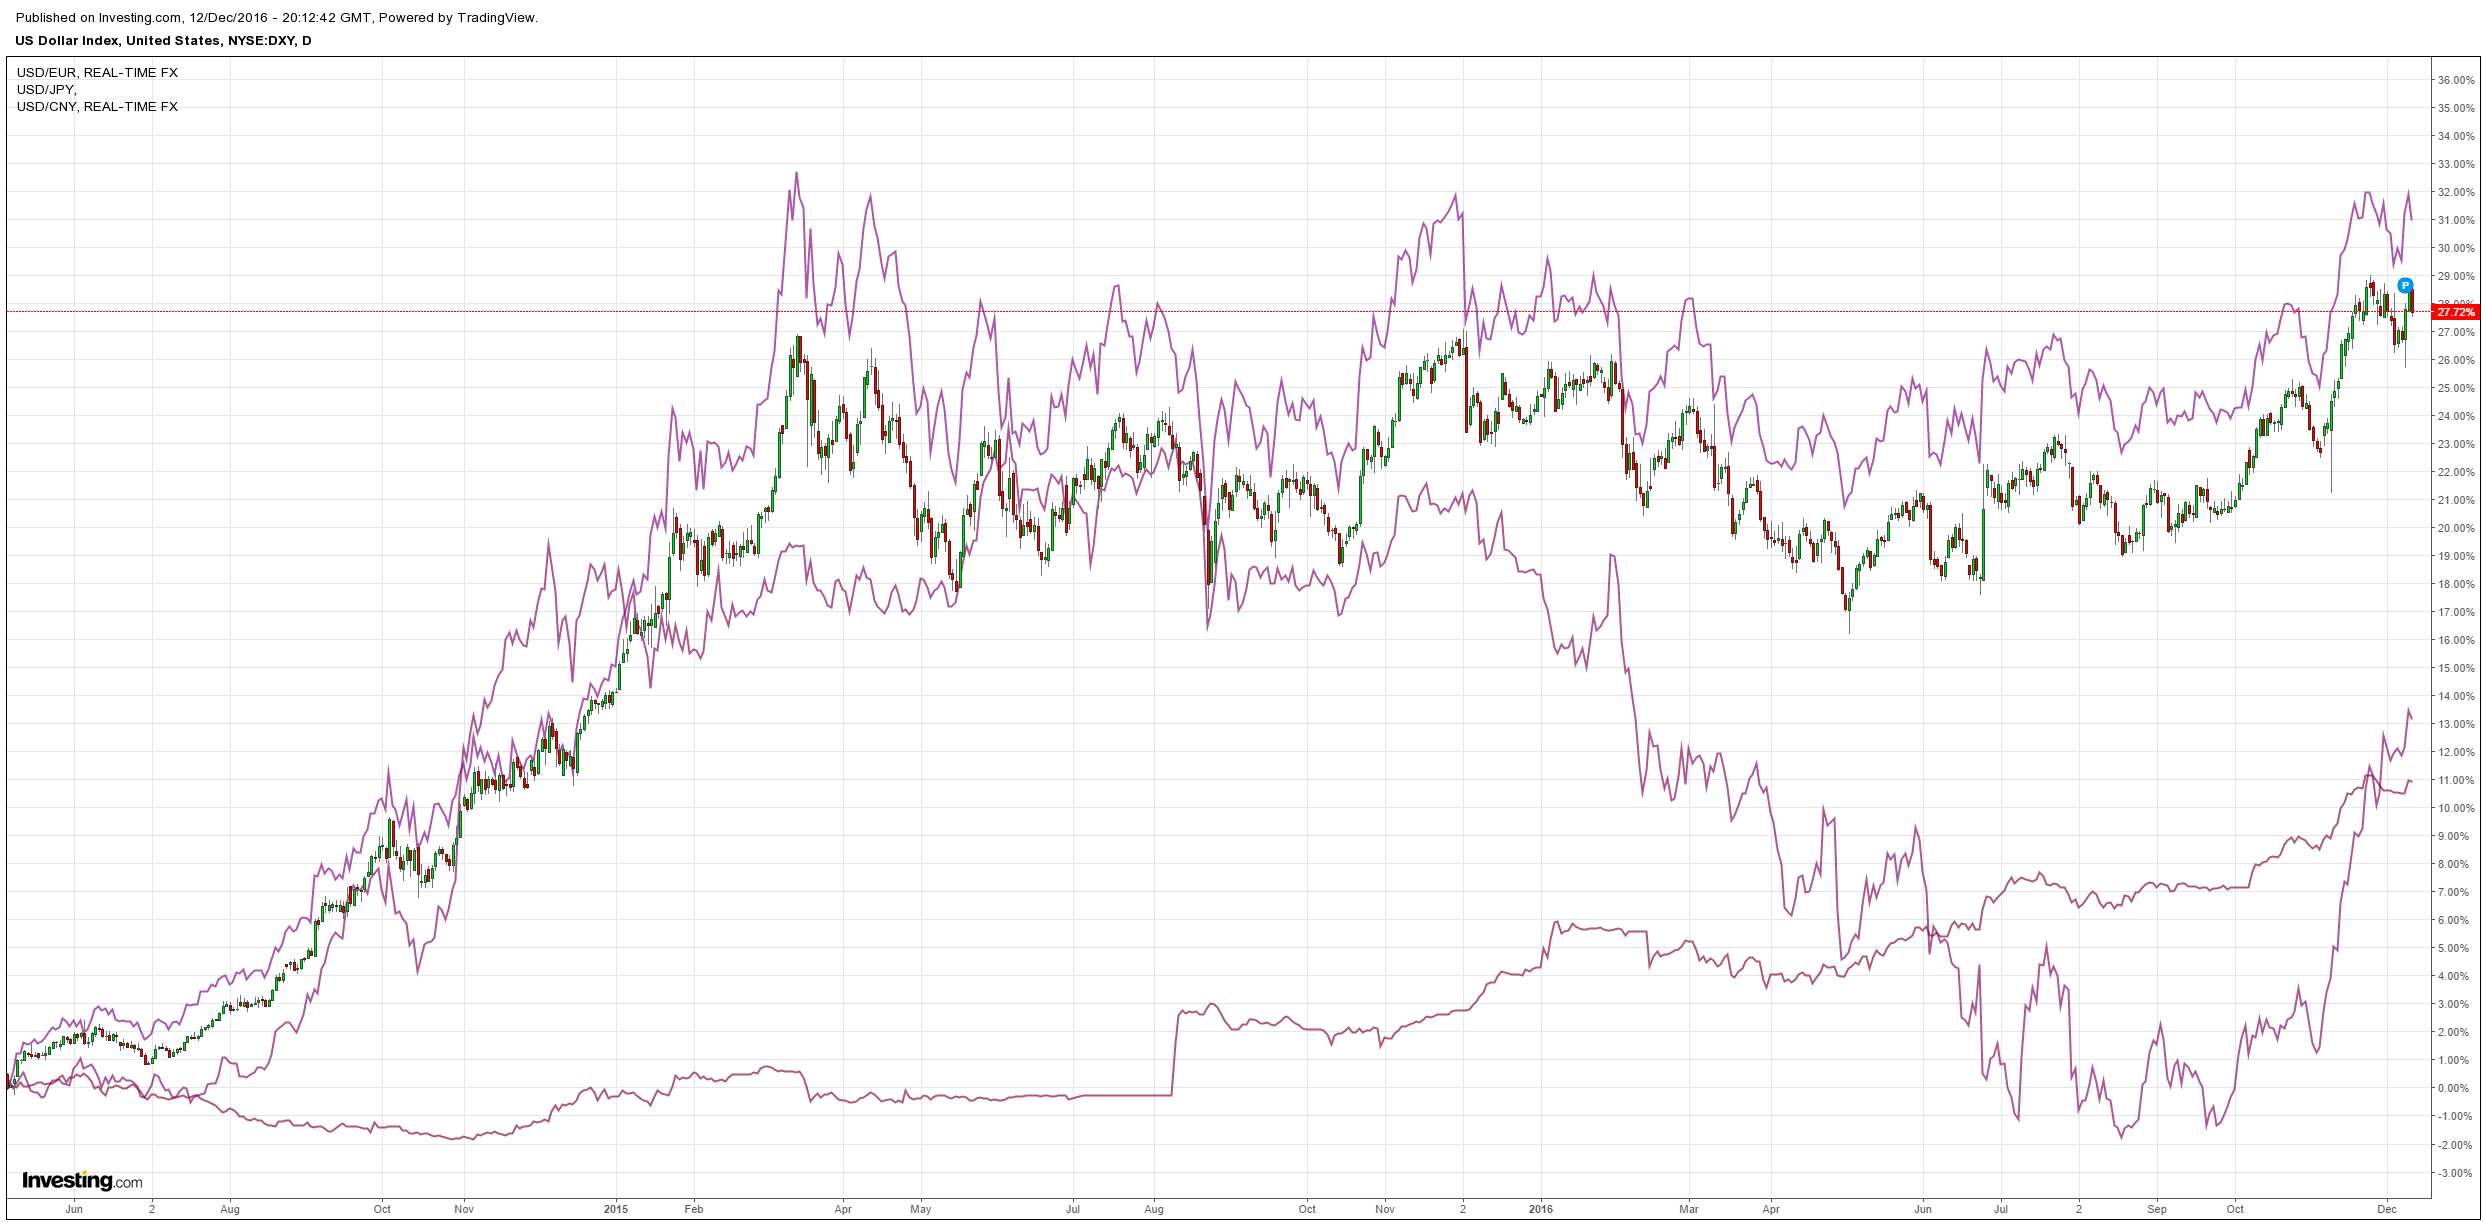
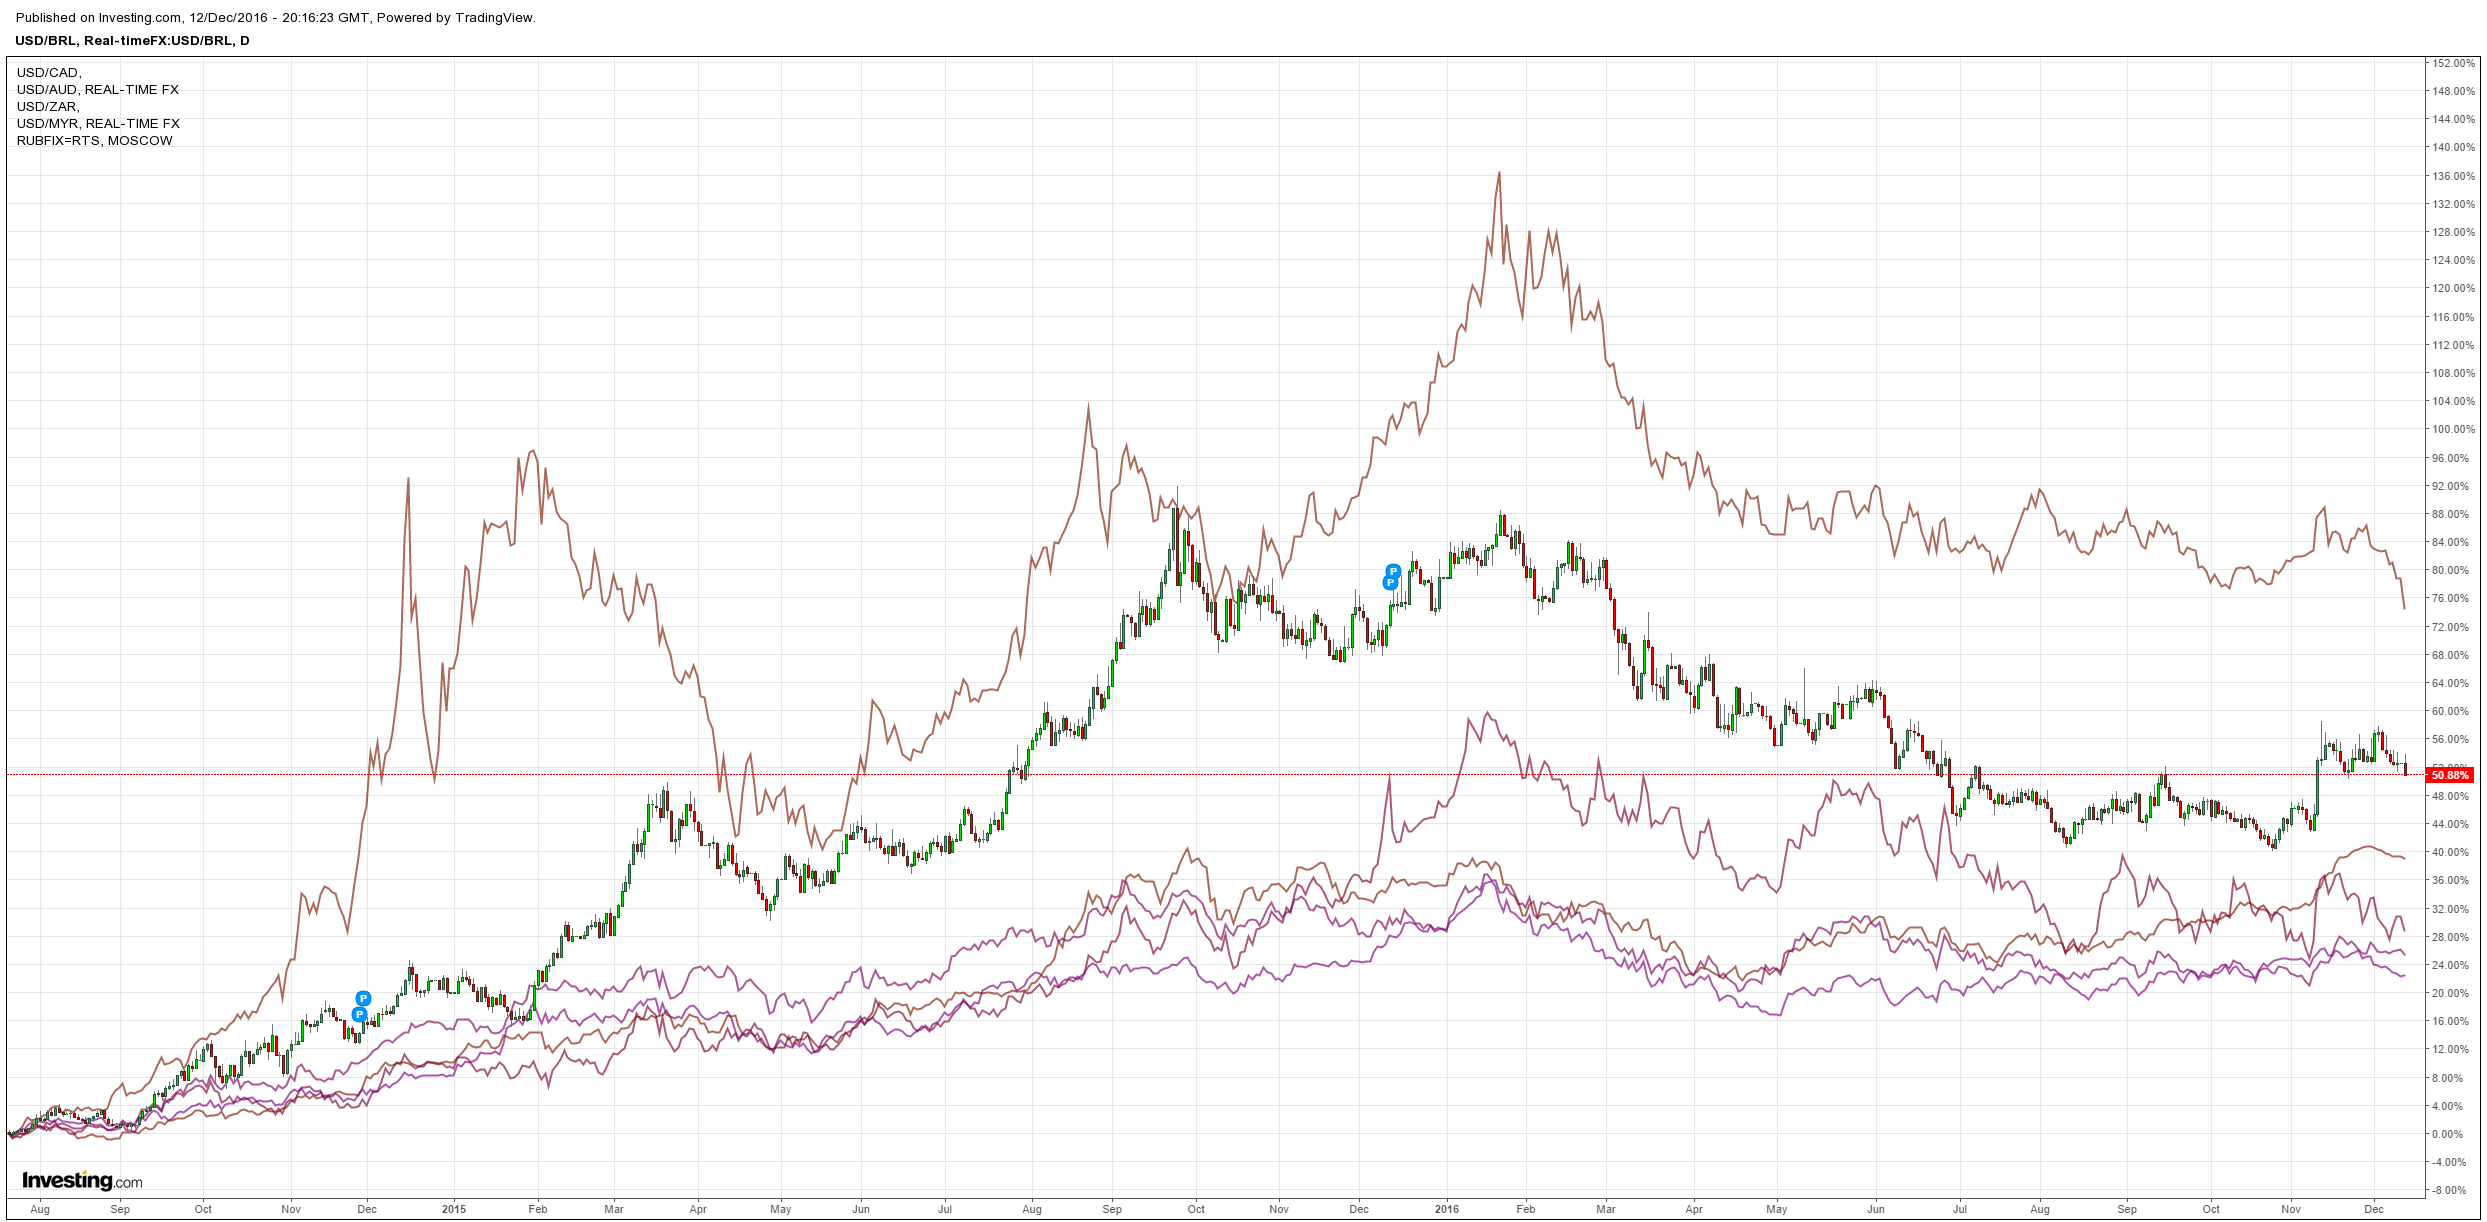
As commodity currencies roared with oil. The Aussie is now a major under-performer:
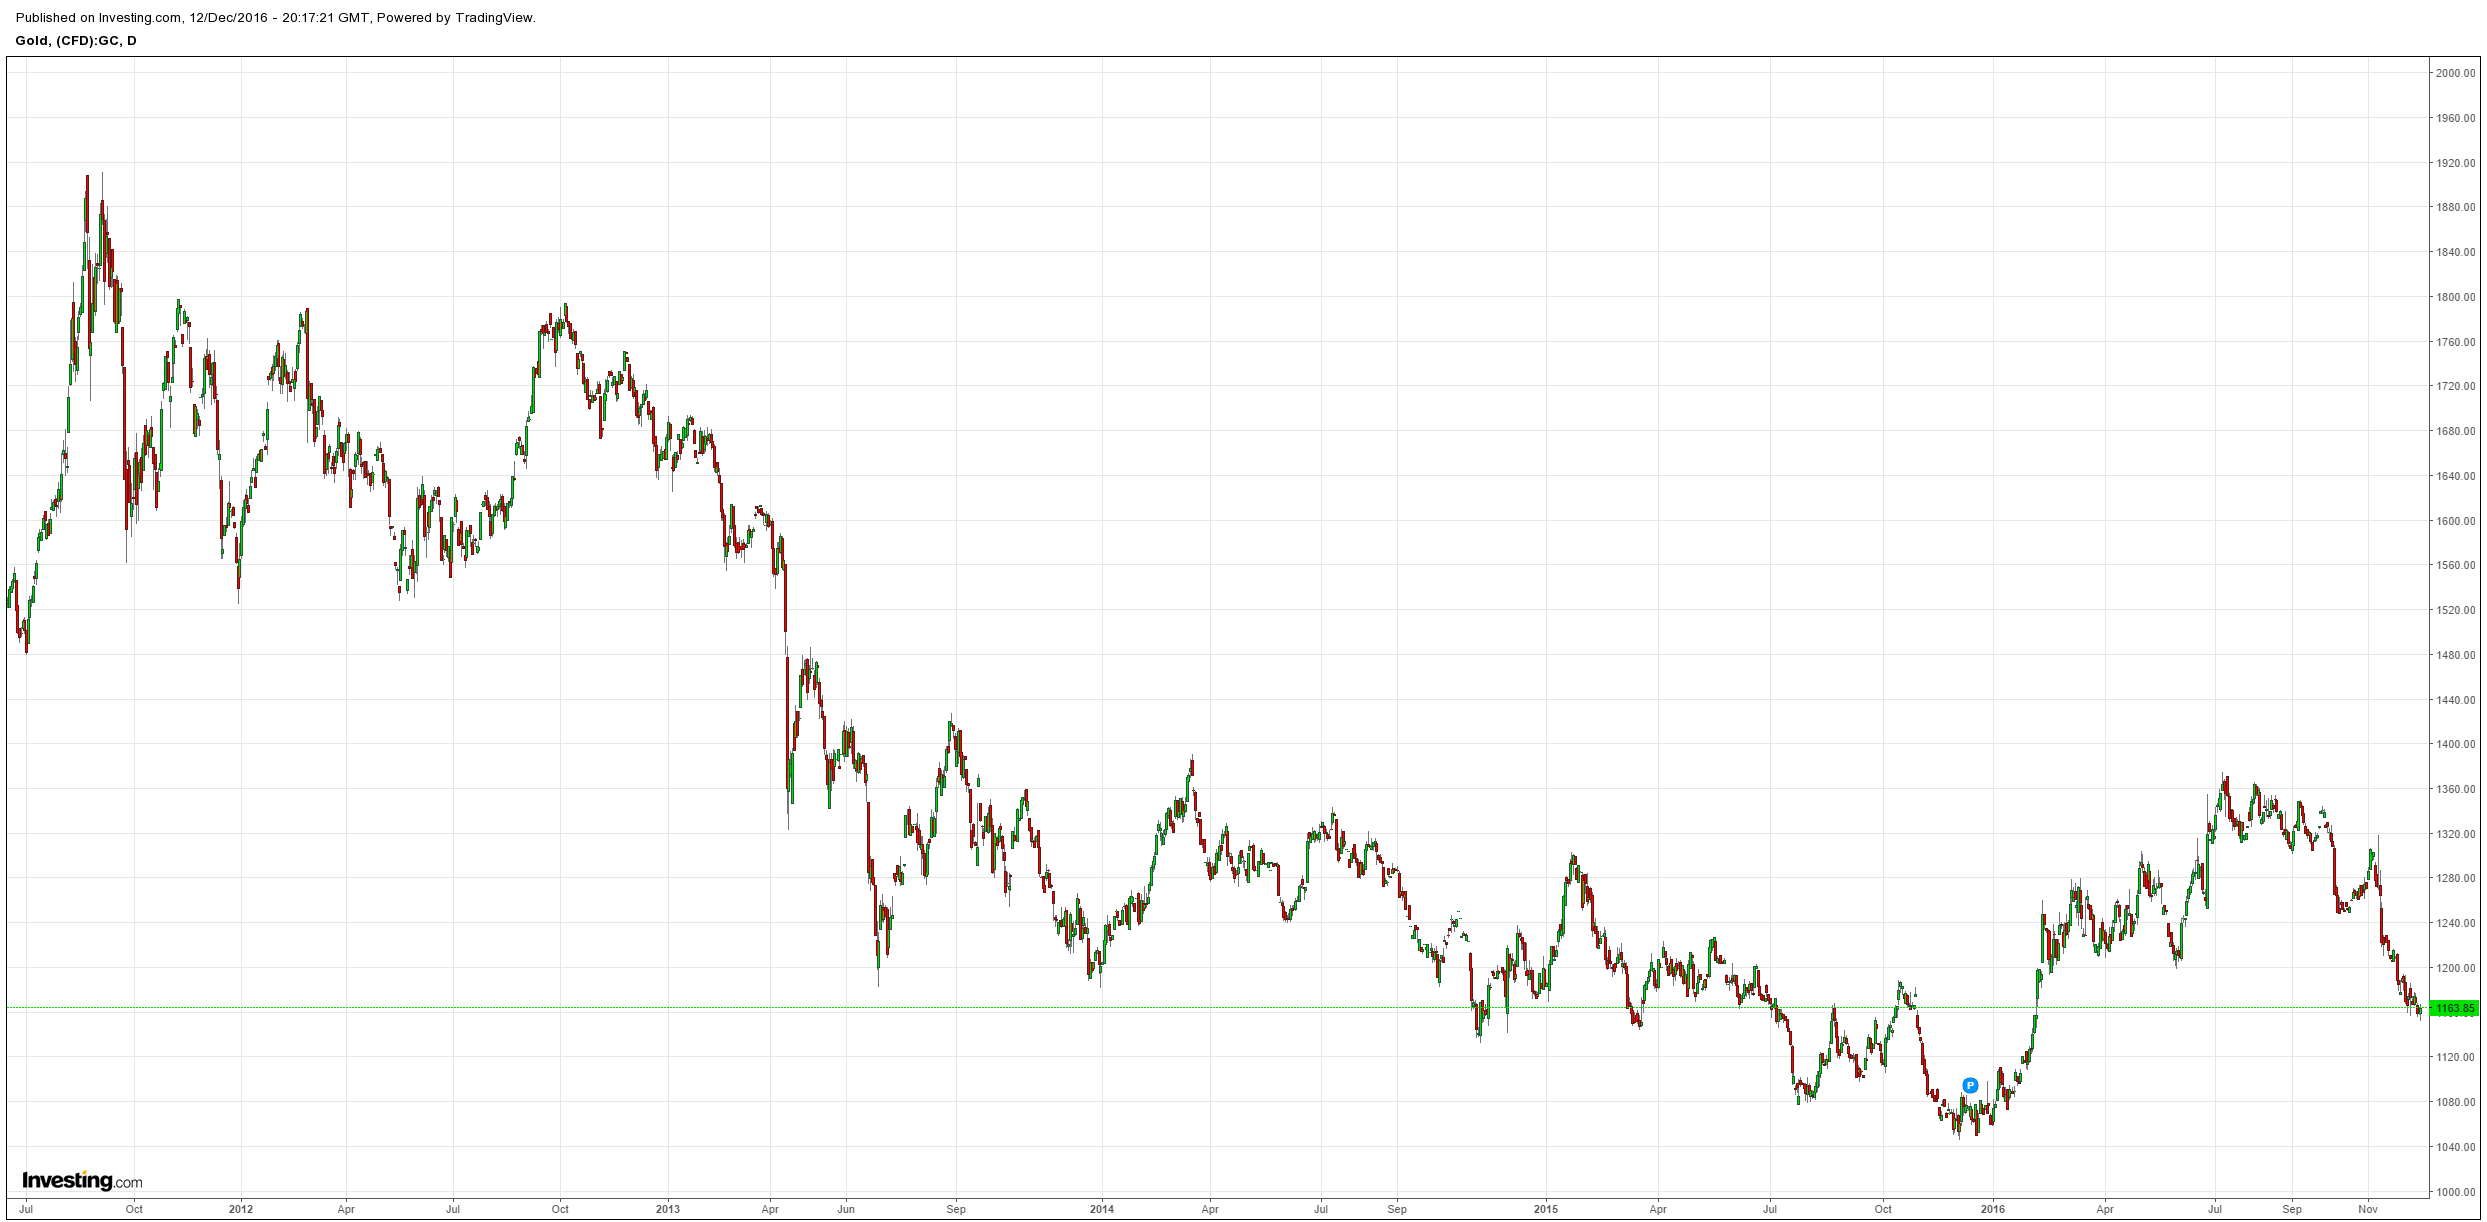
Gold hit new lows then rebounded:
Advertisement
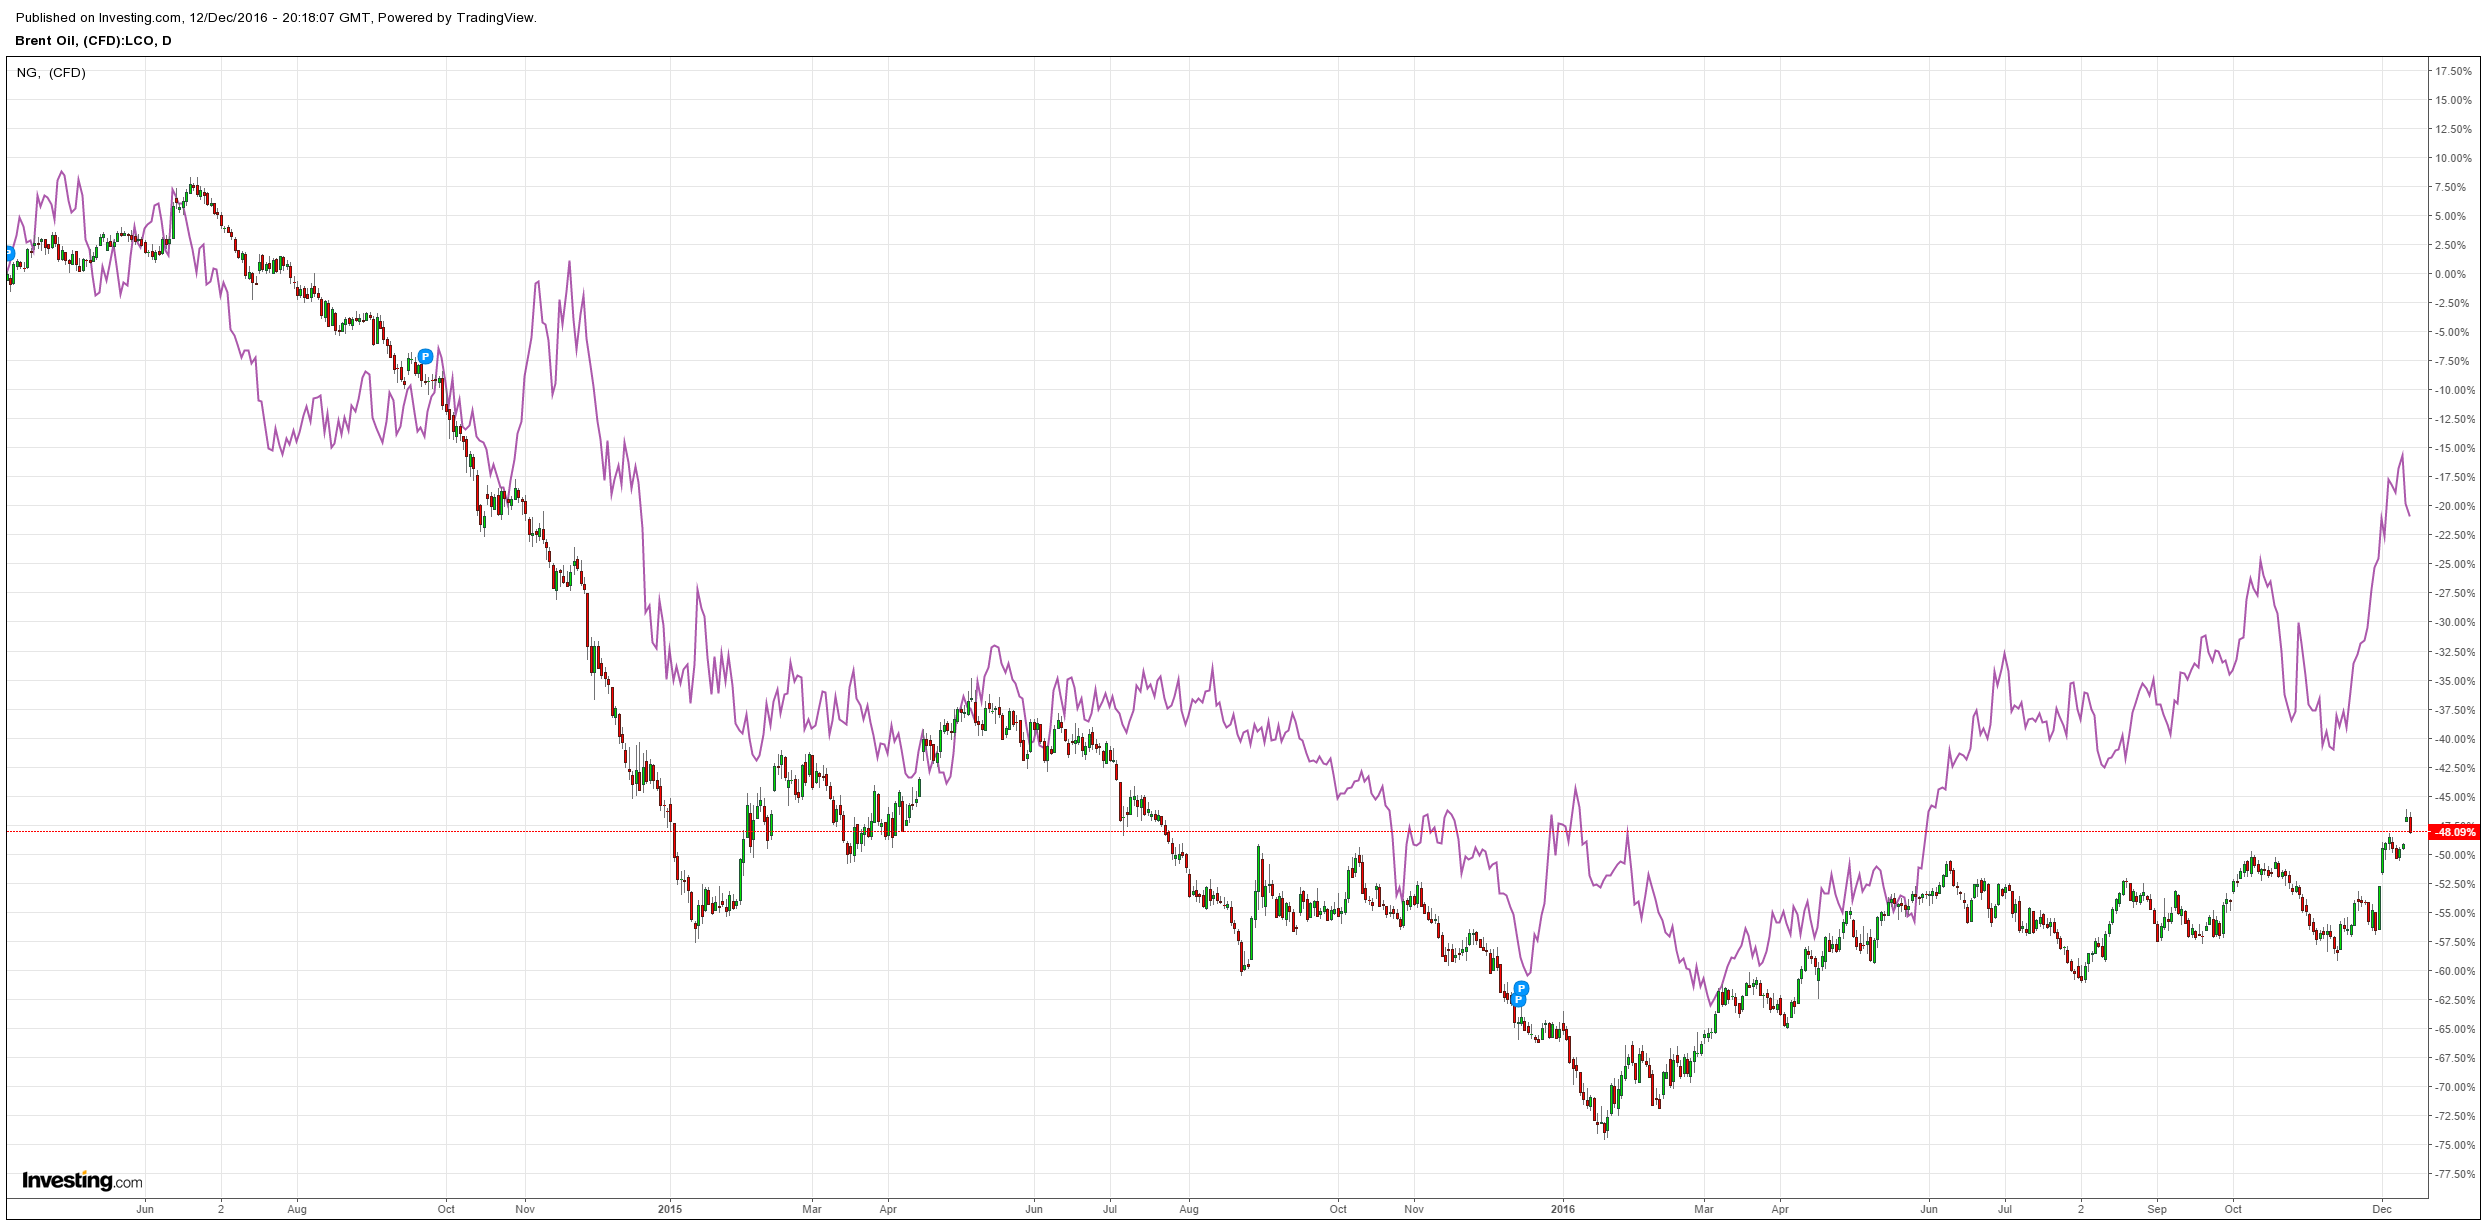
Brent took a hit:
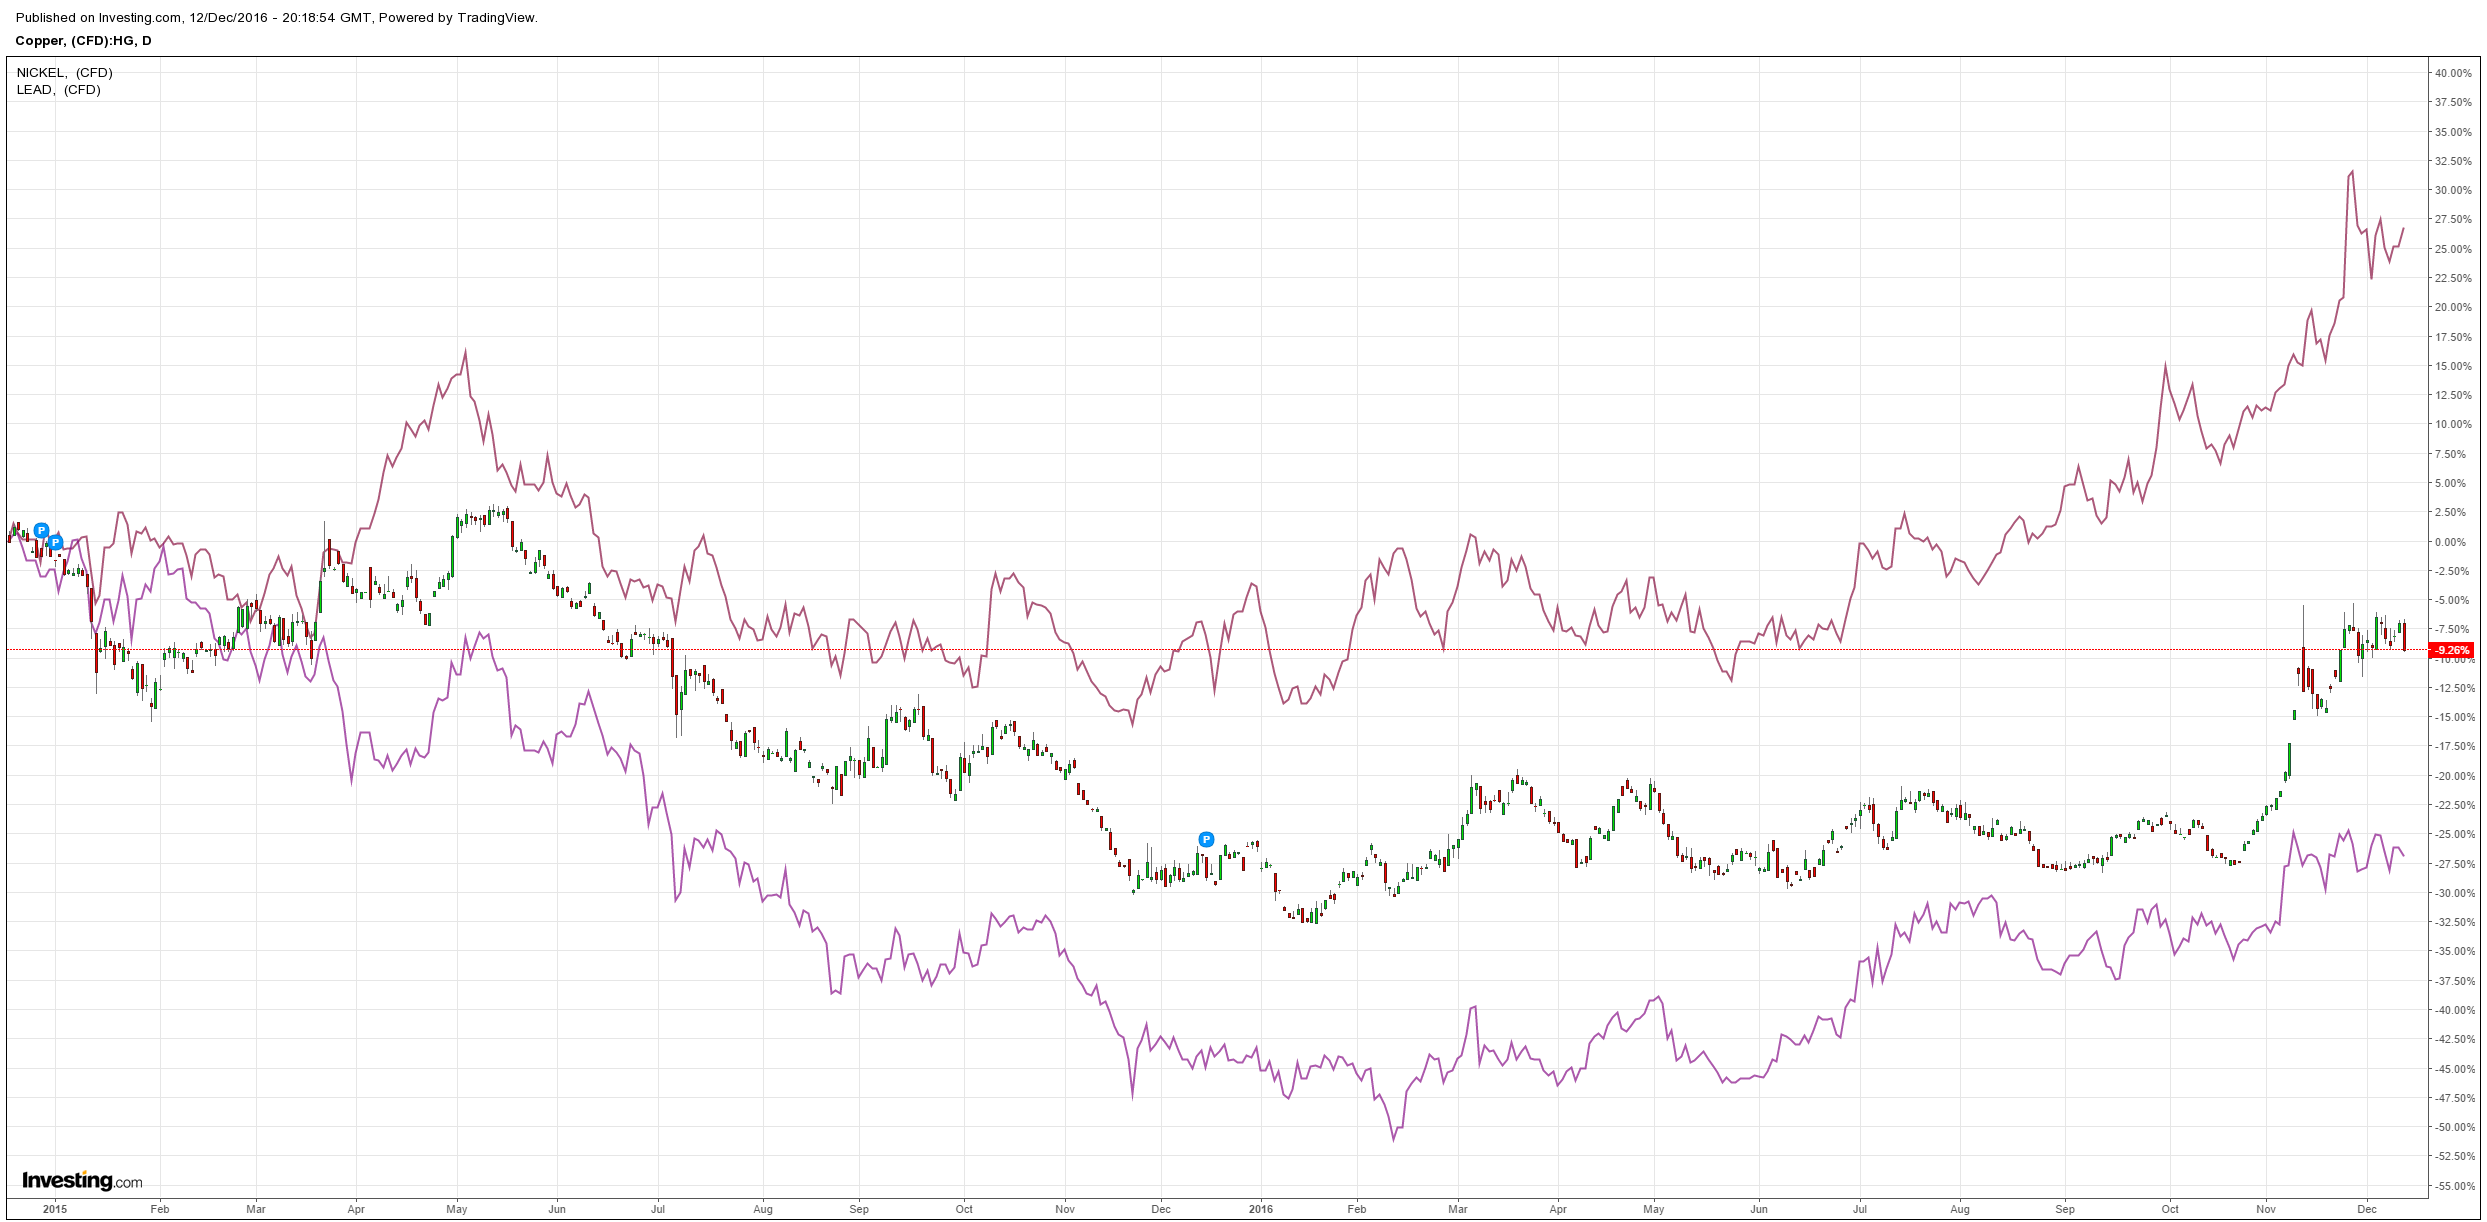
Base metals mostly fell:
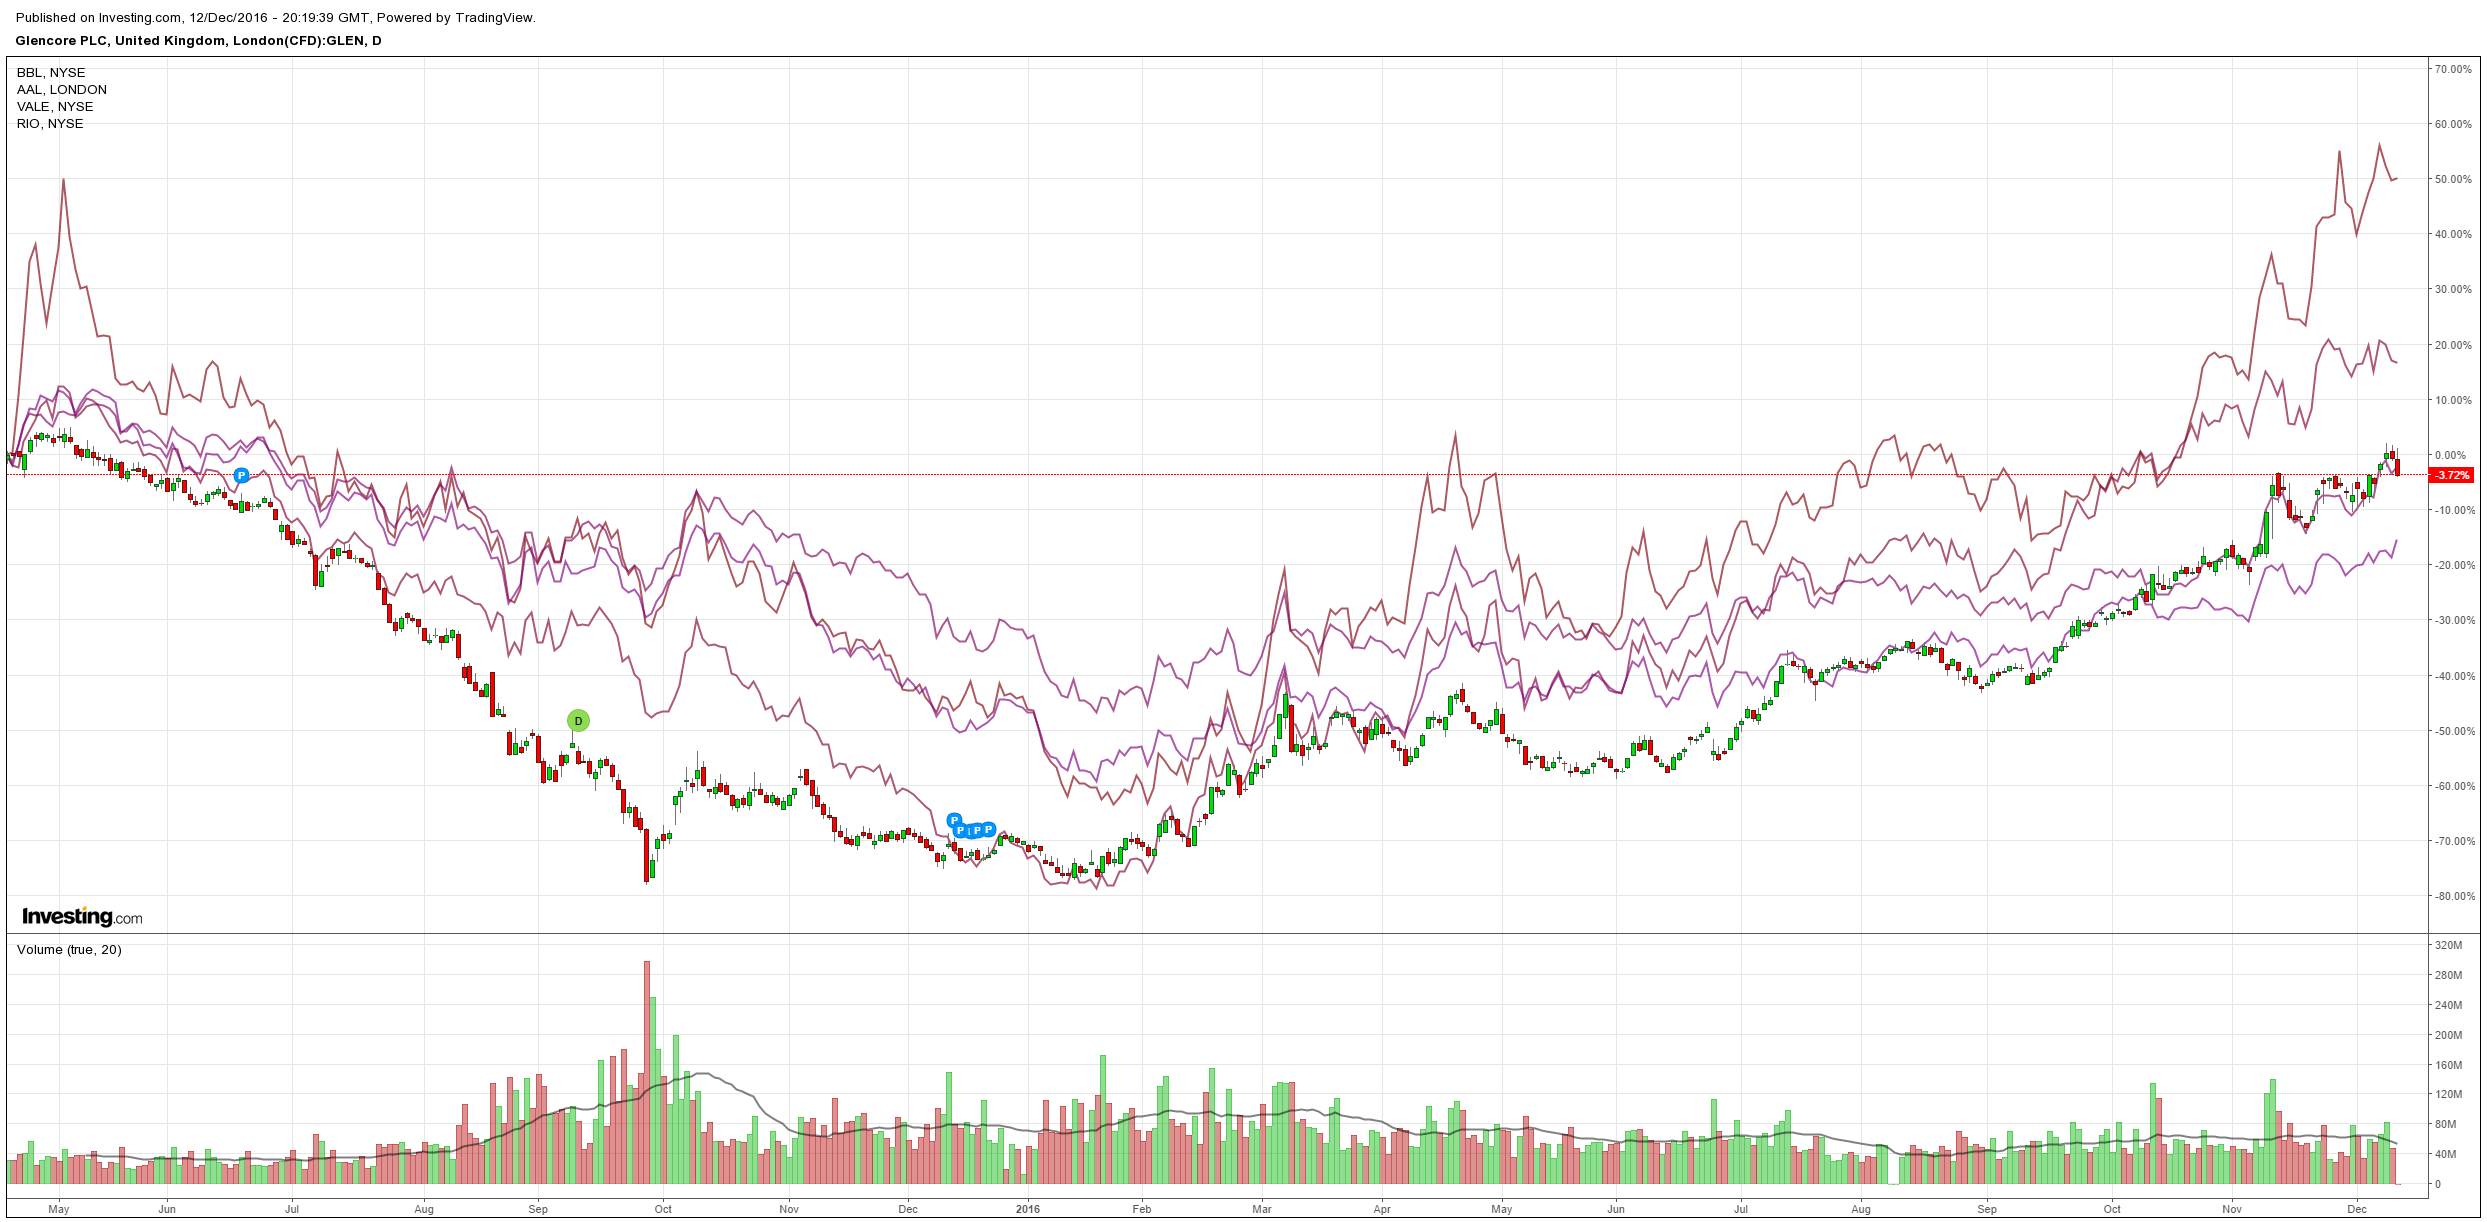
As did big miners:
Advertisement
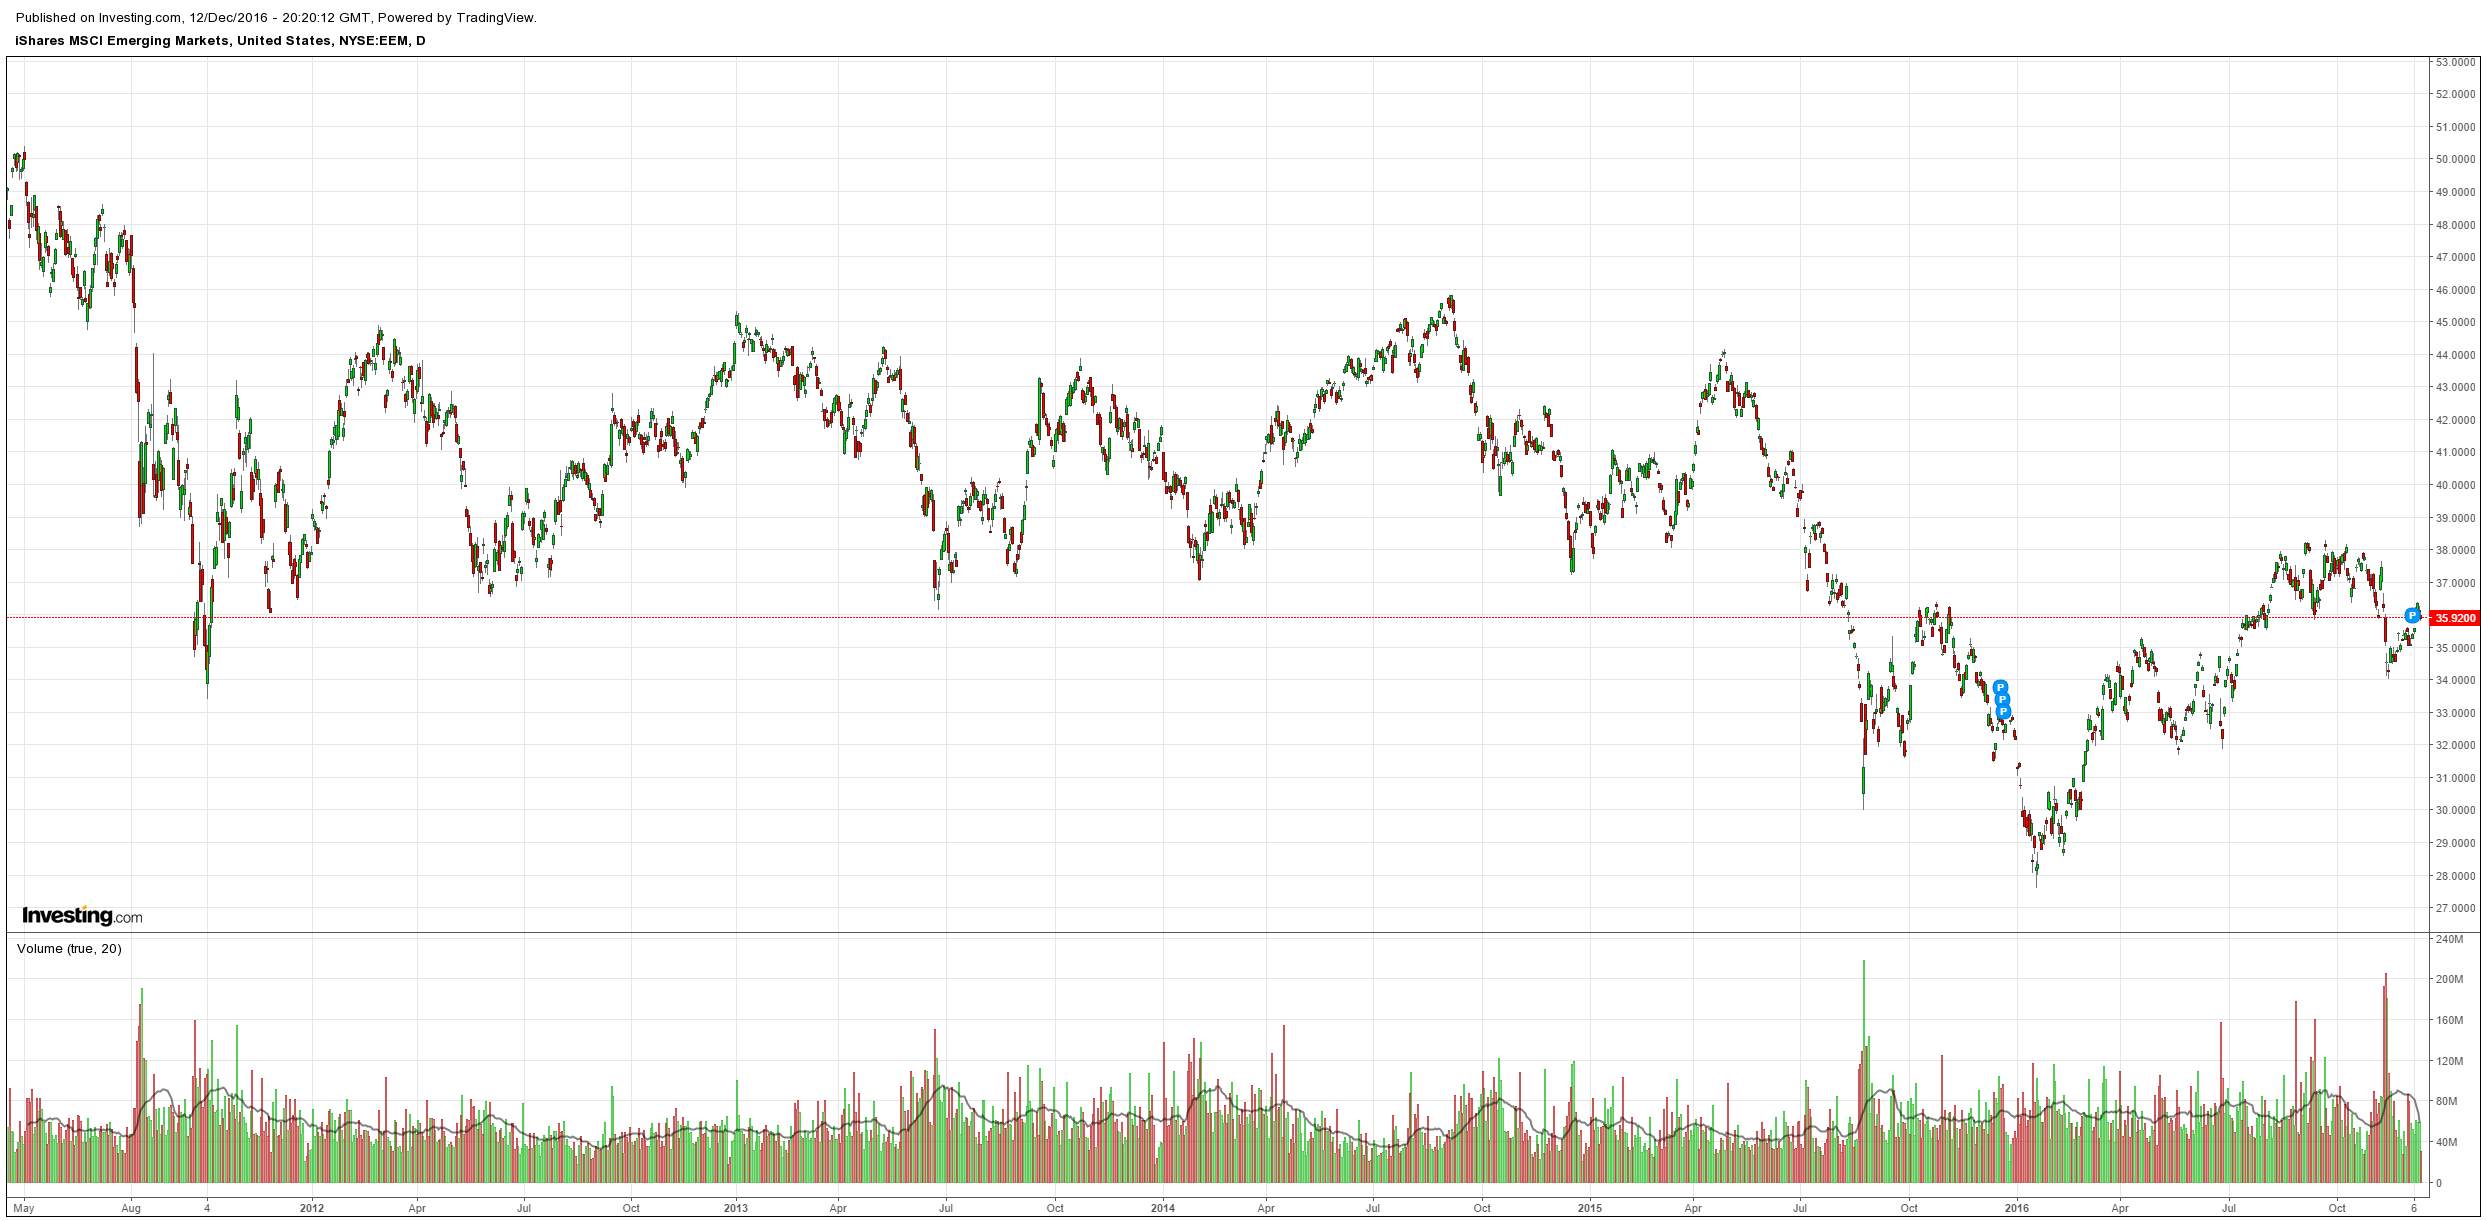
And EM stocks:
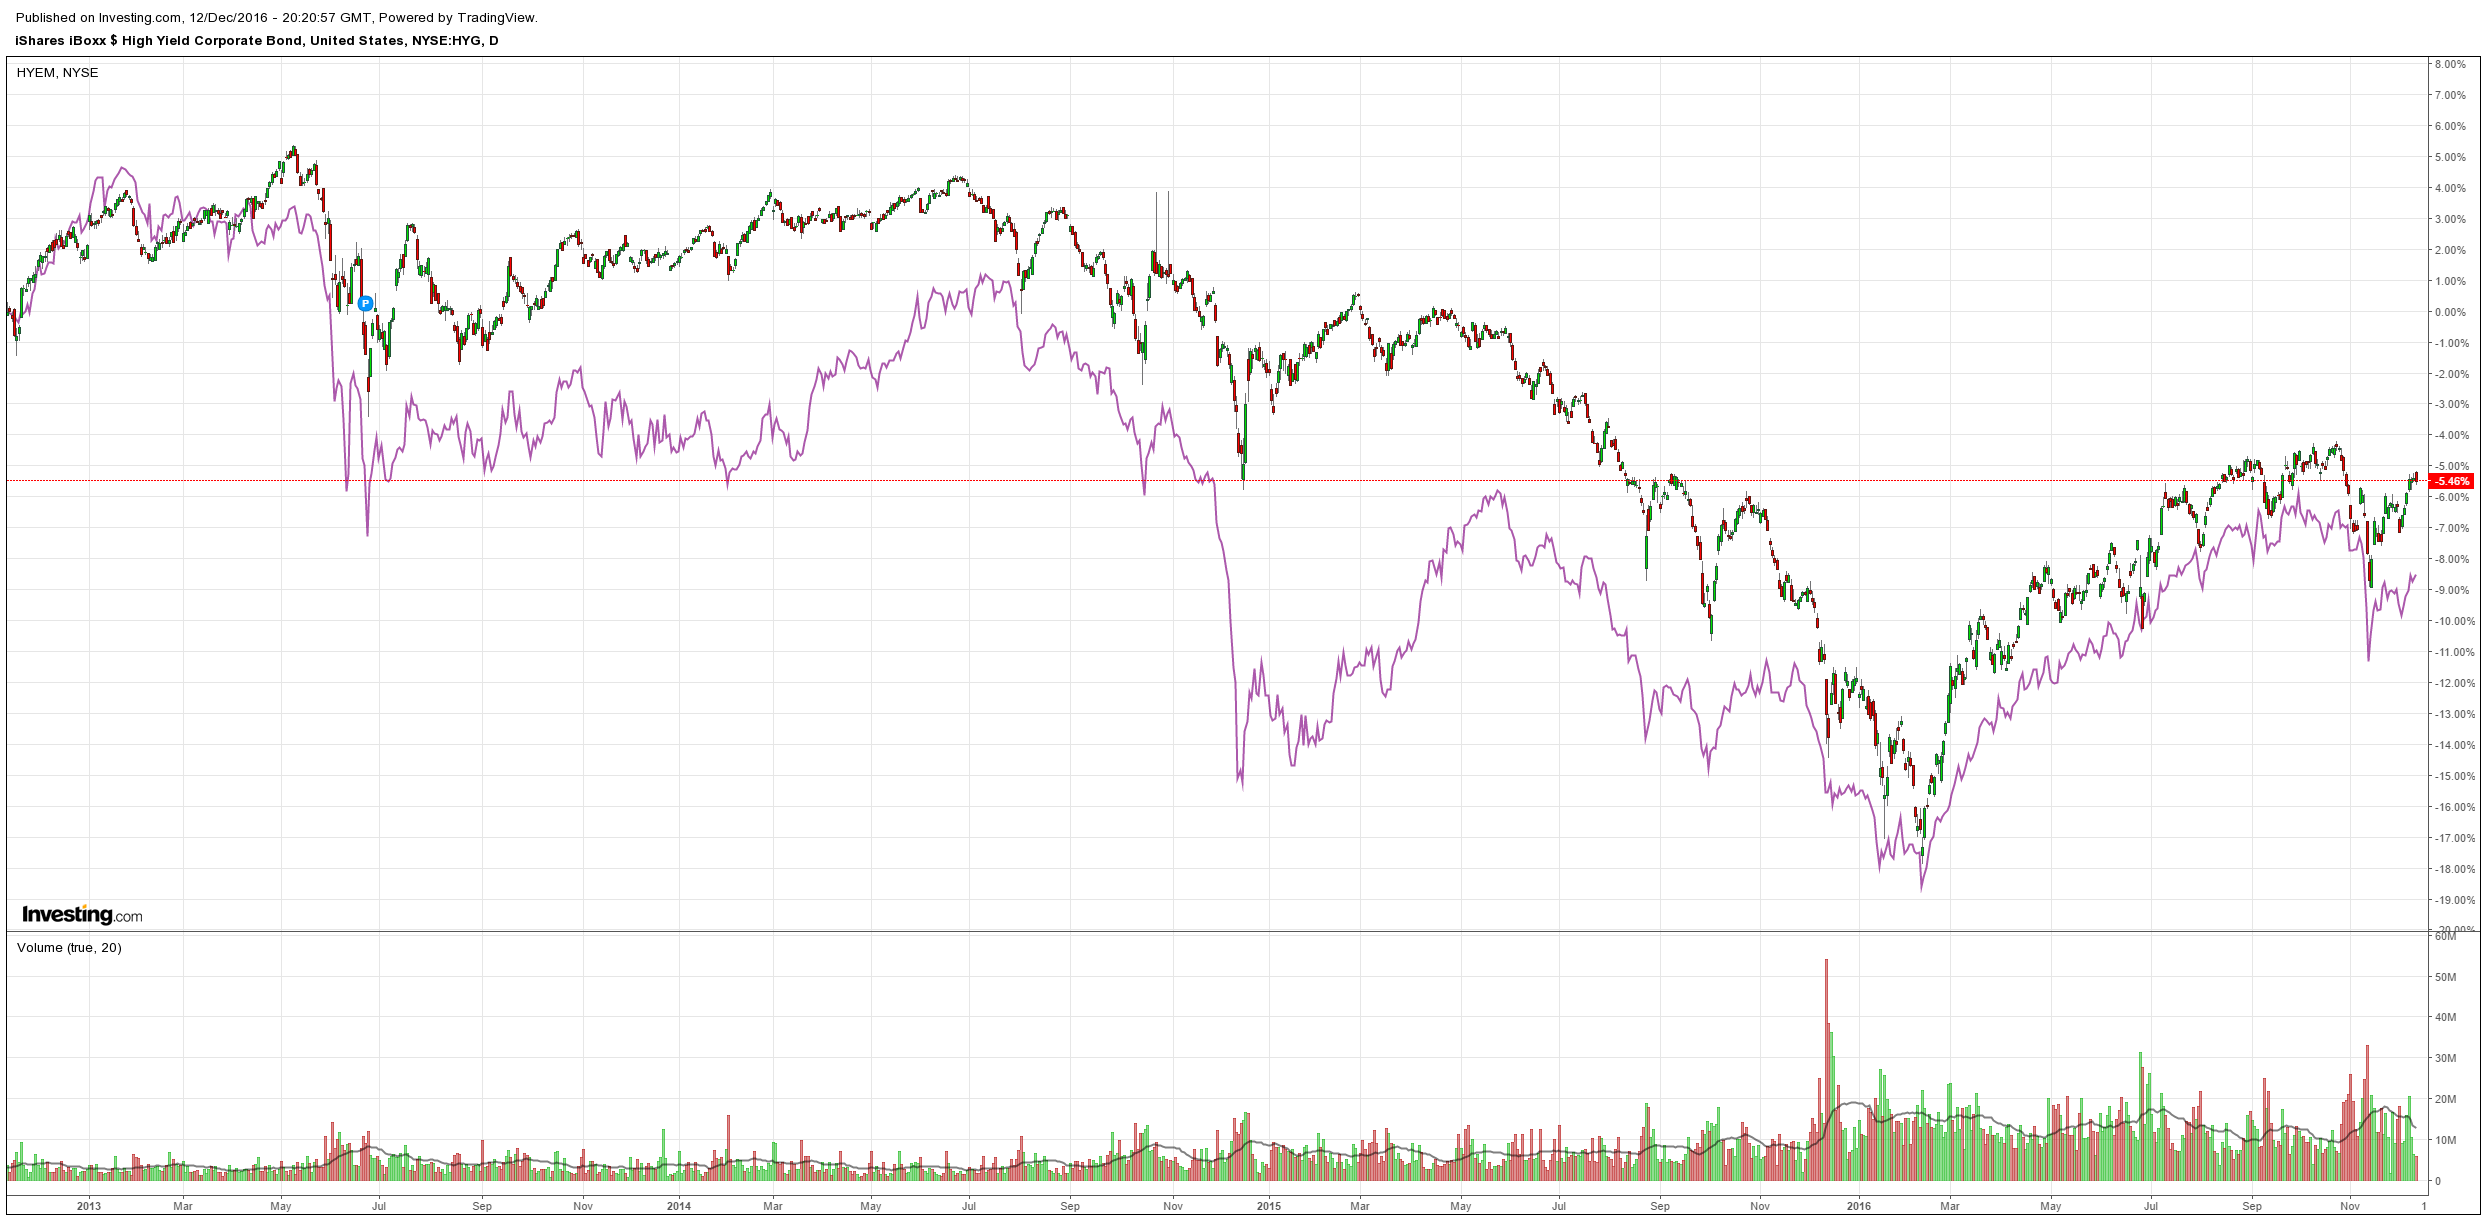
US and EM high yield were weakish:
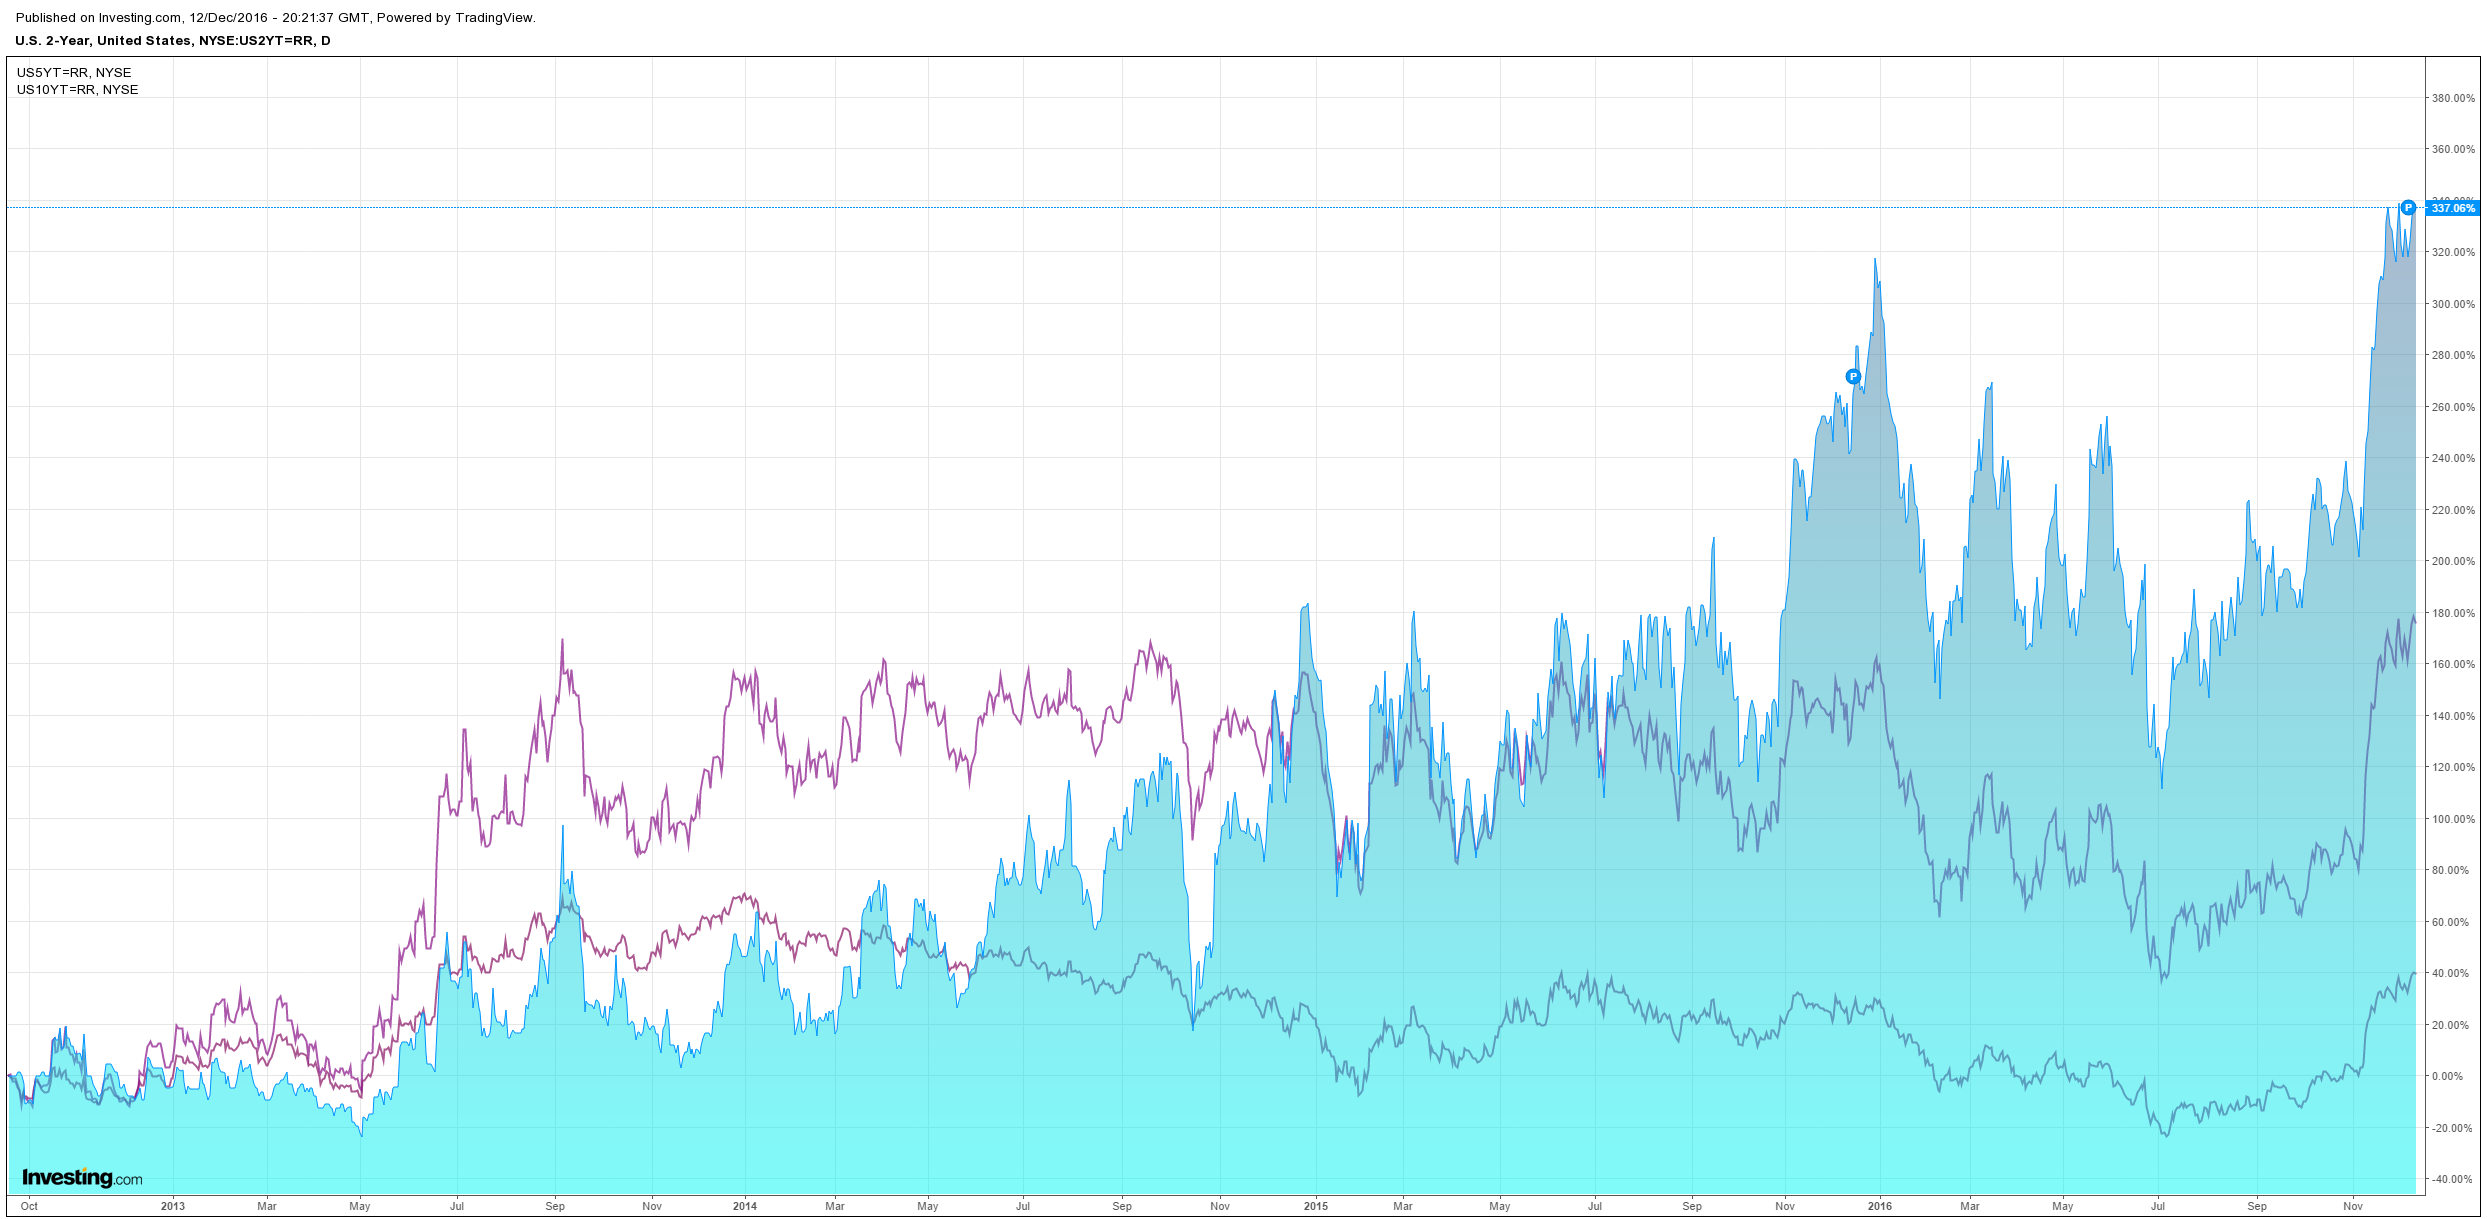
US yields tried and field to push higher:
Advertisement
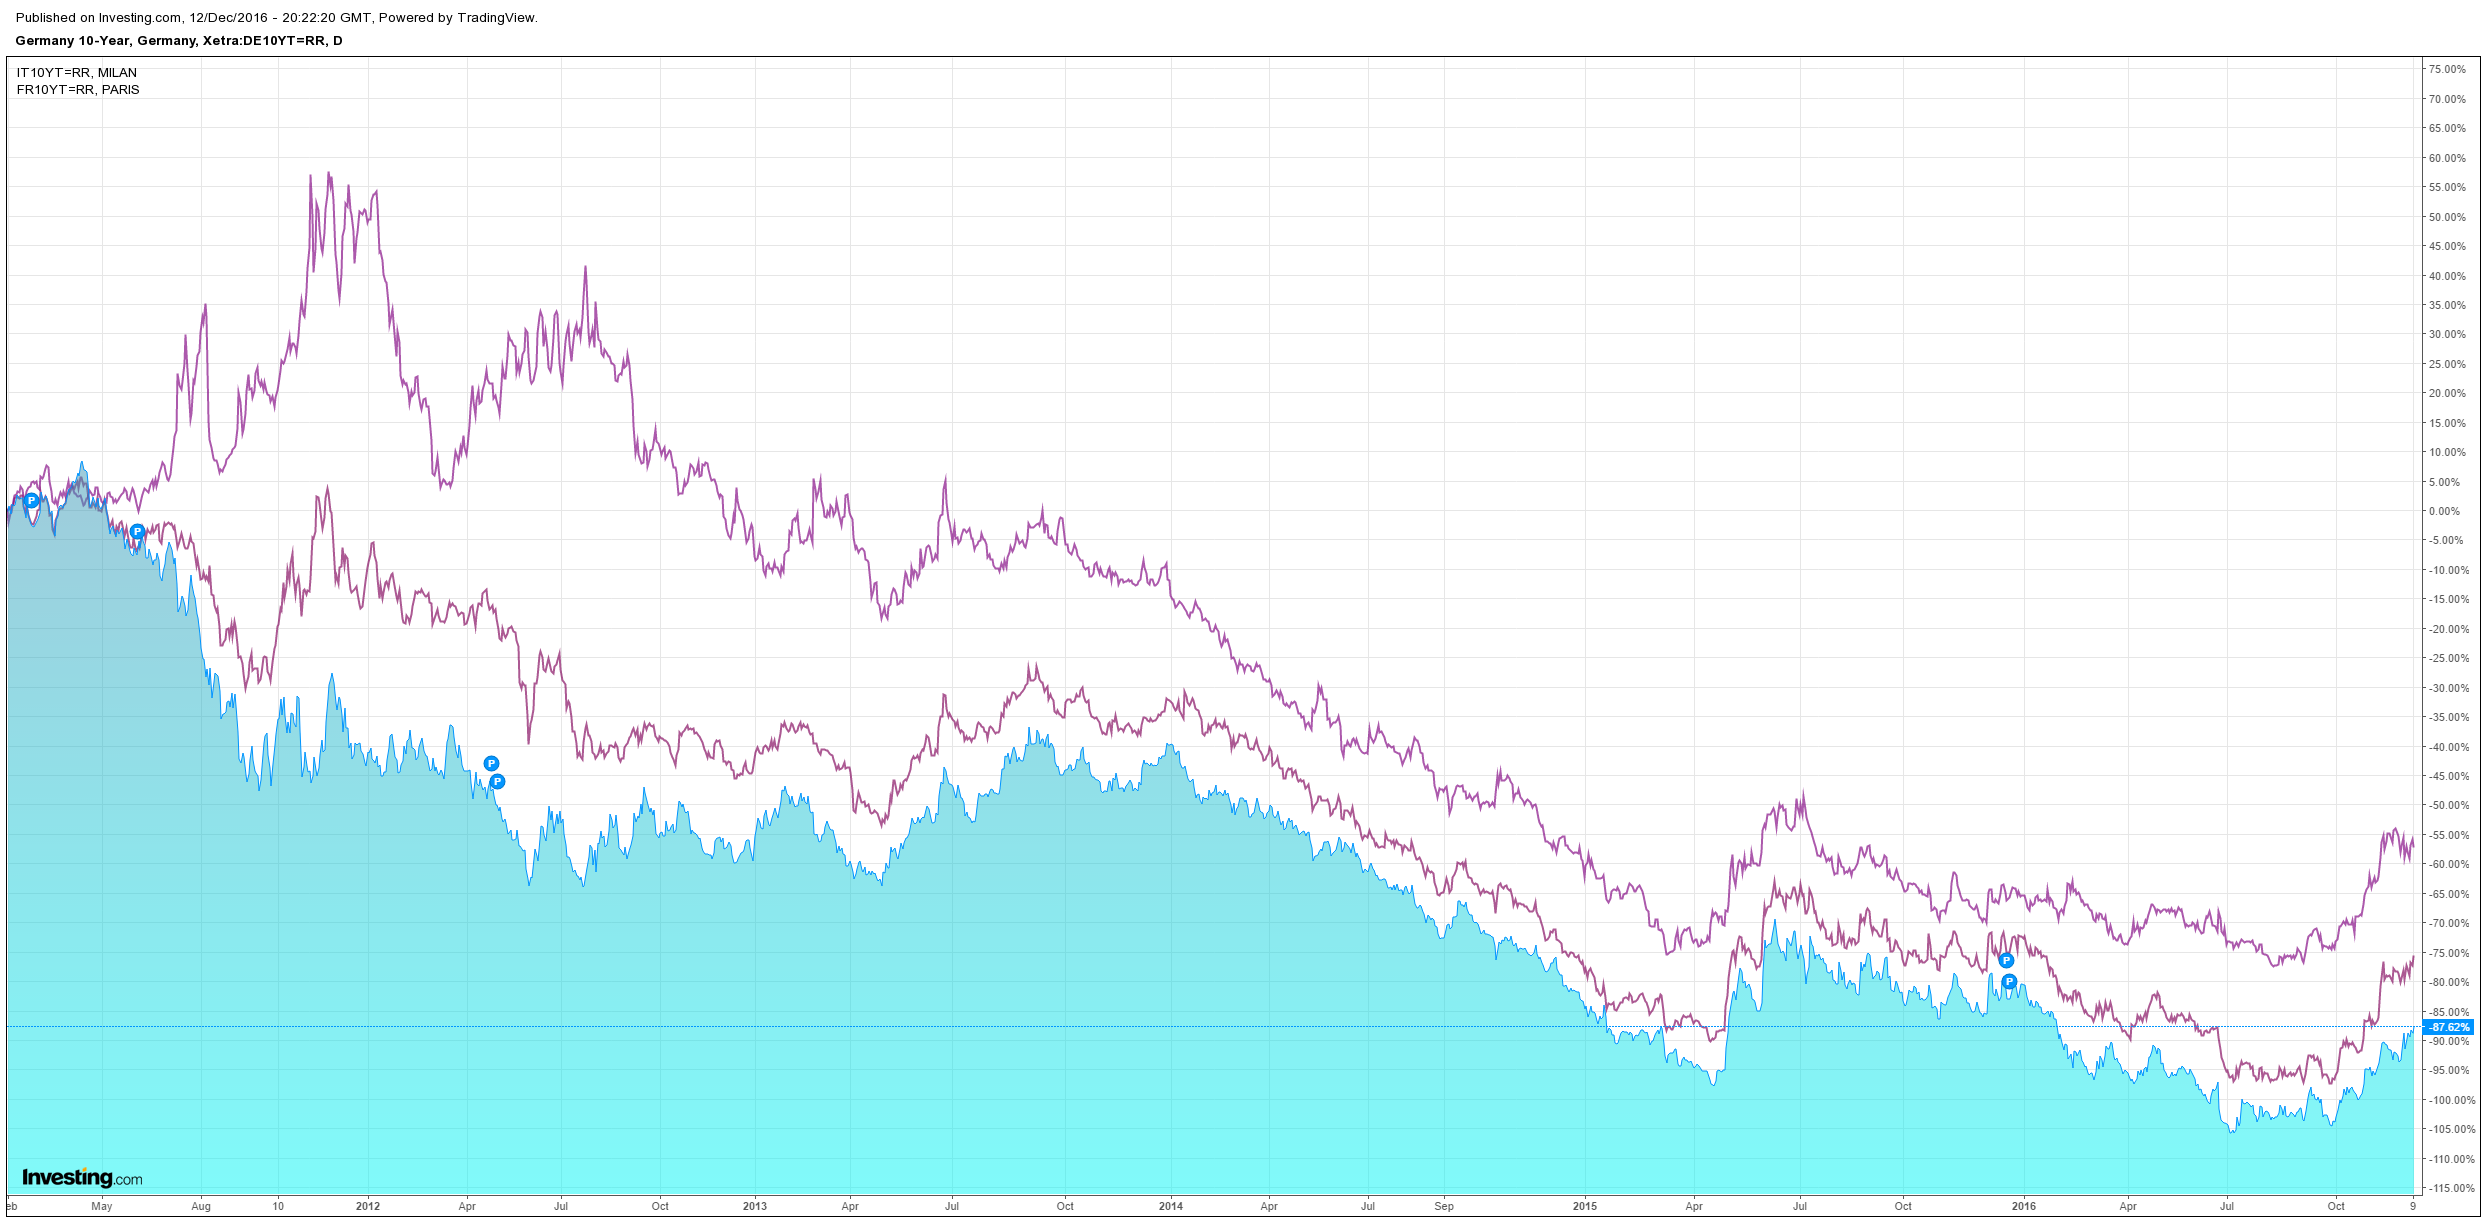
European spreads were stable:
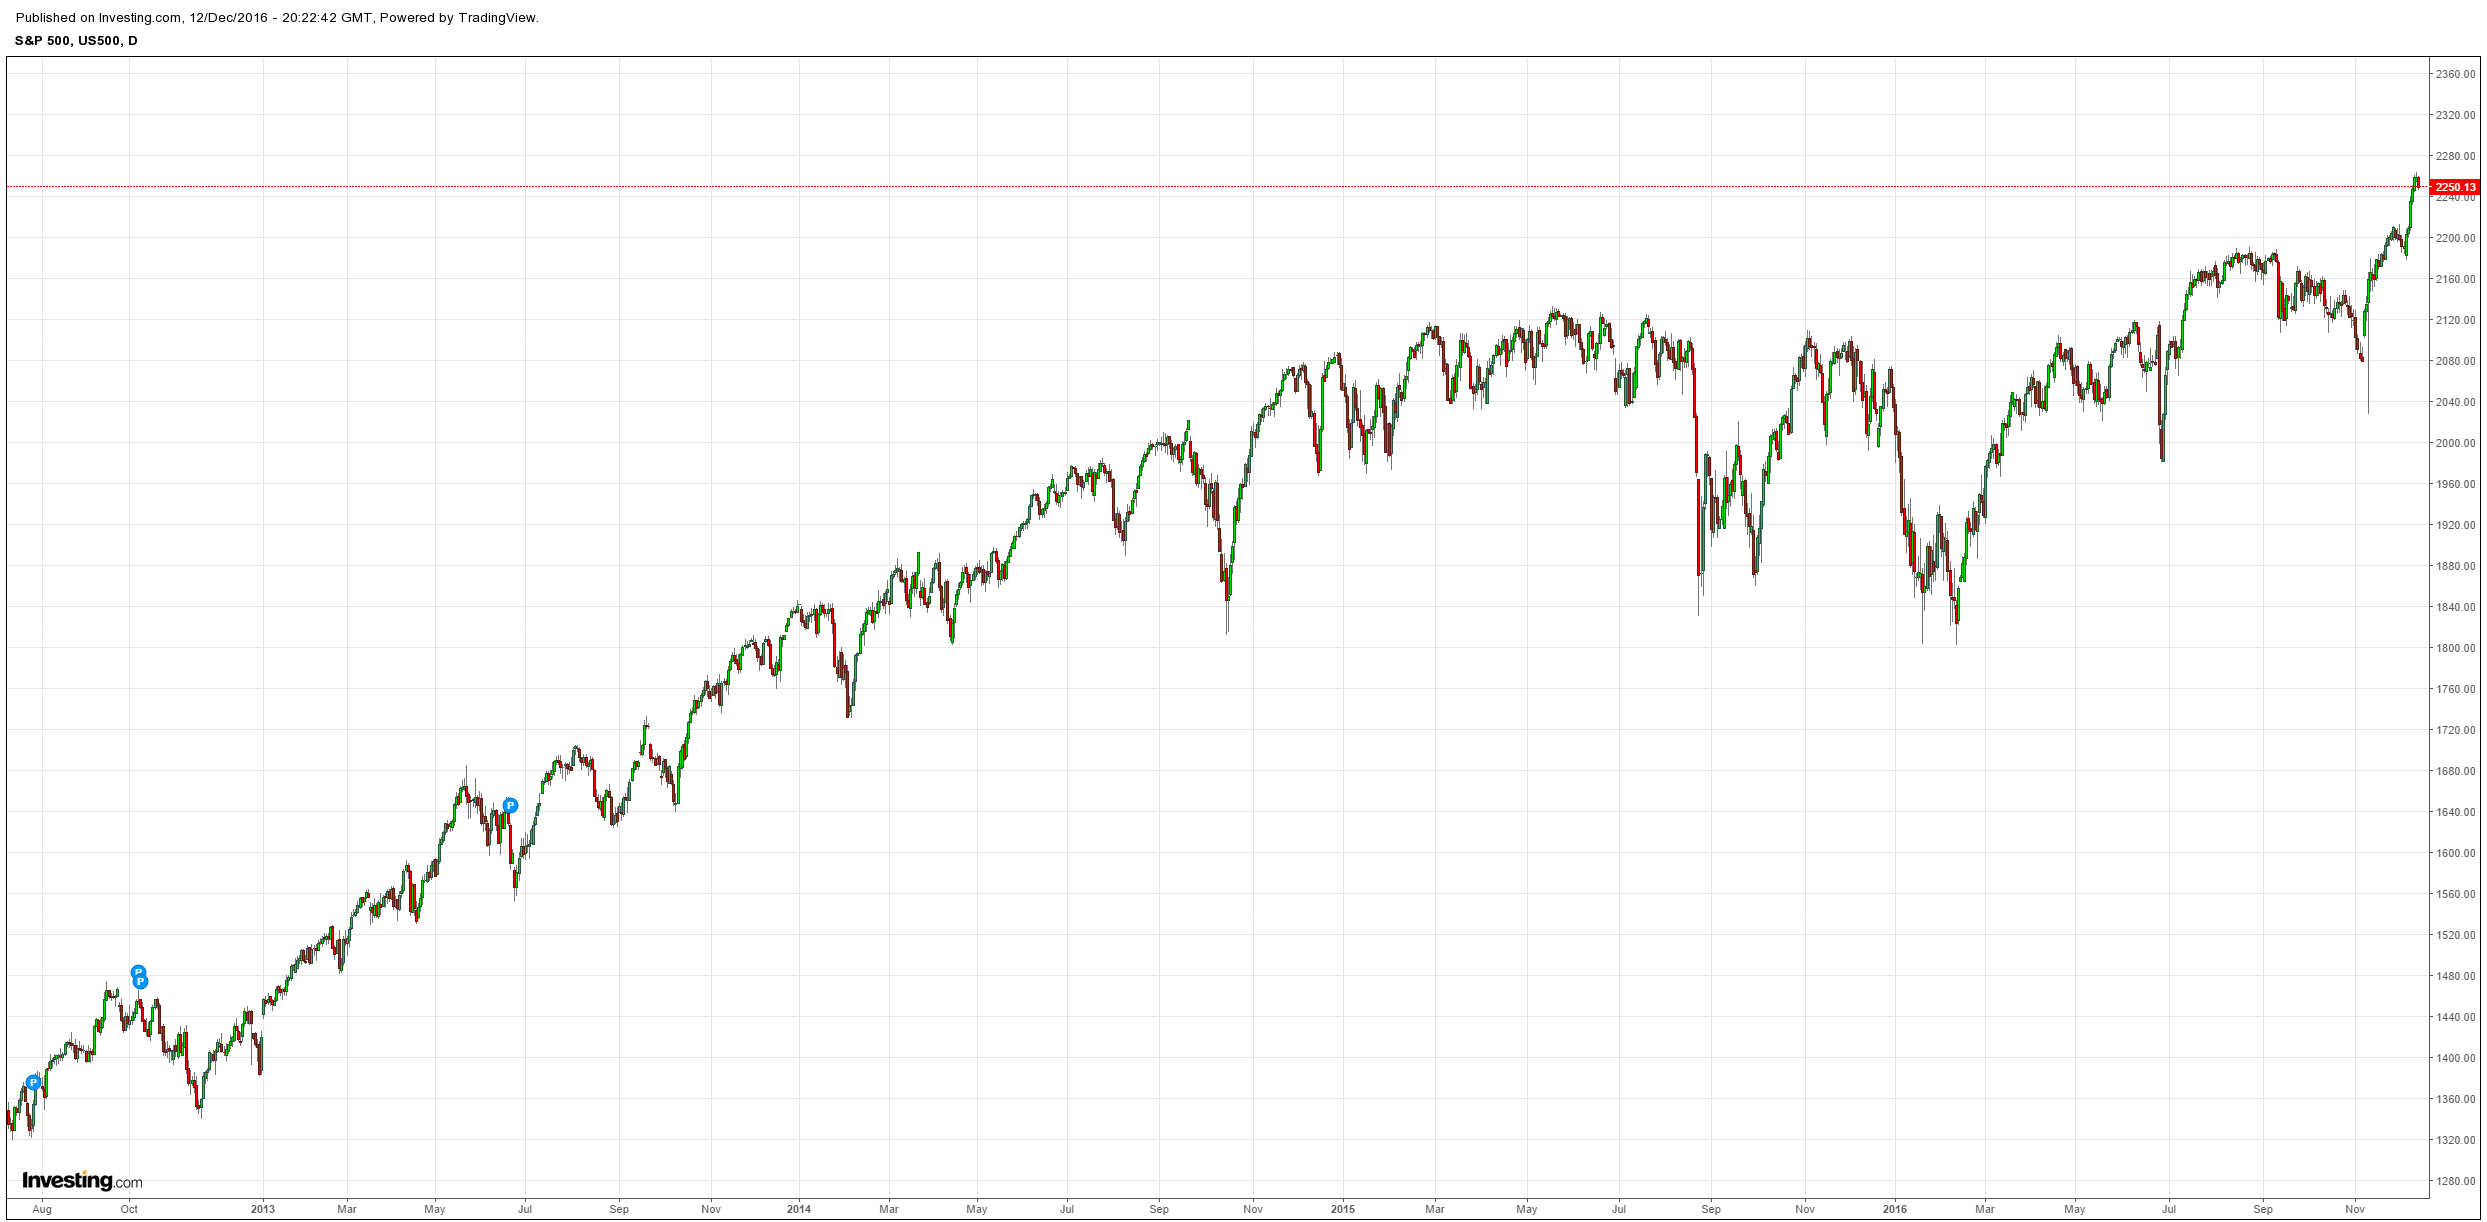
And stocks fell a little:
More from RBC today, who is calling this as well as anyone:
Advertisement
Big Picture: BOND BATTERING CONTINUES BUT SET-UP FOR JANUARY COUNTER-TREND REVERSAL
Bonds further ‘wearing it’ on multiple-fronts this morning (monster TY put block overnight, likely hedging against MTM losses being accumulated–H/T Alex Redhead) as once again, the 5+ year rates trader playbook is torn-up with weakness during the Asian session overnight—five points I’m highlighting:
Crude oil is +5% (highest levels in 17 months) after further Saudi commitment to cut output following the non-OPEC states agreement this weekend to do the same. RBC’s Chief Commodities Strategist Helima Croft is calling this “OPEC’s ‘whatever it takes’ moment,” and global developed market inflation expectations are again being ‘reset’ higher;
Front-loaded UST issuance calendar this week ahead of Fed, with 3Y and 10Y auctions Monday and 30Y on Tuesday;
Nikkei press report that 2017 BoJ issuance will set a new record, specifically highlighting plans to issue Y3T of 40Y JGBs against a reduction of sales in the front-end / belly. Accordingly, we see JGB 2s30s and 5s30s curves making new nine-month steeps;
Western financial press reports noting that the BoJ may have to reduce asset purchases by as much as 10% in light of the move already seen in US rates / the impact this is having on JGBs (FWIW, our Japan USD rates team is pointing out that no local press is talking about this tapering story—as such, we continue with status quo of the ‘policy divergence’ trade, as the Yen drop to new 10 month lows against the USD overnight);
‘Unwillingness’ to catch the falling knife from overseas real money investors (who have been “the” bid in USTs for years), voicing a preference to wait until 2017 to target ‘more attractive’ entry points for longs. This comes with domestic real money funds already being sellers as they work to shed duration. The sense is that leveraged funds will continue to press shorts on this trade which has been exceptionally profitable thus far. As such, the rates move to the upside could be magnified even further into certain illiquid year end conditions with dealer balance sheet / financing constraints.
The danger for risk assets of course is a ‘disorderly’ rates move, as noted in Friday’s “Big Picture” as one of the chief concerns with regards to potential disruptors of the “reflation trade.” VaR stress -induced deleveraging has repeatedly ‘spilled-over’ into other asset classes in every ‘taper-tantrum’ episode we’ve witnessed since ’13, especially on account of the proliferation of “short convexity”/“short correlation” strategies which have grown massively popular with the asset liability management community in the post-GFC period. When their long fixed-income portfolios come under enough stress to ‘trip’ vol targets, mechanical deleveraging occurs across their asset portfolios.
The aforementioned bond bull market of course engendered these leverage carry strategies under the façade of “low volatility” in bonds, as global rates act as the Central Bank ‘lynchpin’ for all monetary policy. This in turn suppressed volatility in equities, credit and FX as well—by design. Now that we have the Fed, the ECB and the BoJ acknowledging the limits of QE (the beginning of the end of the ‘monpol only’ regime) while at the same time,the geopolitical populist shift is agitating for a fiscal stimulus ‘lever,’ positioning / asset allocation needs to be reset for real and leveraged money, while these volatility trigger strategies too must be re-formatted against a backdrop of higher rates—which simply means volatility normalization (and within equities for example, actual thematic / factor / sector dispersion).
But well beyond certain strategy types, this is a reassessment which ALL investors HAVE to be dragged-into—because this marks a dramatic narrative shift. I have made my position on bonds evident in ‘broken-record’-fashion over the past nine months—an impossibly-crowded and lazy ‘duration long’ had been accumulated into an inflection point within the 35-year bond bull market and a ‘peak’ in CB / QE largesse hit earlier this Summer…and now we are seeing this metastasize into the next leg of the unwind / re-allocation into a world where there are now more than nascent signs of a growth- and reflation- impulse. Long-term, curves will continue to steepen, and yields will push higher—especially with the table set for continued inflation trajectory and thus, more hikes being priced-into rates expectations.
For equities, the impact is nuanced—it’s about the difference between a bond market sell-off driven by higher inflation expectations (a stocks +++) versus one driven by higher real interest rates, which is the ‘financial tightening’ downside (whether it be equity risk premium / earnings multiple driver being unwound, or the bigger picture loss of liquidity in the global economic / funding engine that comes with higher rates / higher Dollar).
But for all of the reasons noted Friday, it’s very likely we’ll see periods of violent bond rallies during this shift (‘positioning-excess’ driven—a.k.a. tactical trading opportunities)—with this set-up into January being a prime example. The issue is this: between the purely mechanical “rebalancing” that tends to occur at the world’s largest pensions at the end of Q4 / end of year—ON TOP OF the proclivity of active managers to “window dress” portfolios by adding “stuff that has worked / ‘winners’” and selling “stuff that has underperformed / ‘losers’” for optics in December, a massive signal is generated which the quant community ‘laps up.’ And this is why January has shown a tendency since the turn of the millennium to be an enormous “mean reversion” month—whether across assets or intra-asset (i.e. stock factor or sector performance).
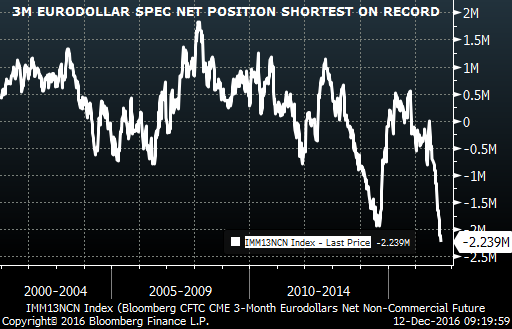
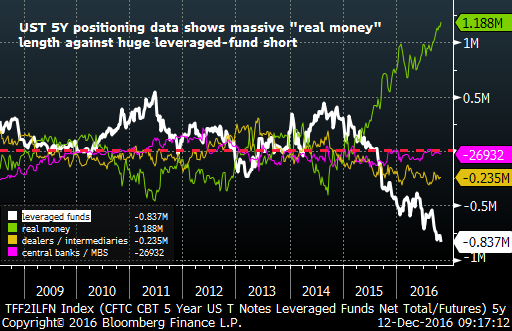
The concern is that the extent of the current bond short (record short positions in FV and Eurodollar from leveraged funds seen in Friday’s CFTC data as shown in the charts below)…
3M EURODOLLAR SPEC NET POSITION SHORTEST ON RECORD
5Y POSITIONING SHOWS RECORD LEVERAGE FUND SHORT (WHITE LINE)
… will exacerbate the already strong trend of this “January” effect (SPX on avg since 2003 -1.3% in January / -3.8% on average over the past 3 Januarys; against TLT (iShares 20+ year Treasury ETF) on avg since 2003 +5.6% / +7.2% on average over the past 3 Januarys)…especially as consensual as the ‘set-up’ is again into the start of ’17 -> “long stocks on positive ‘economic escape velocity and growth’ expectations against short USTs,” especially off the back of Fed hikes. History rhymes…and when you add in the view that overseas real money is waiting until the start of 2017 to pounce on better levels to pounce, there is certainly the kindling for a serious Treasury melt-up fire.
And again as per Friday’s note, this isn’t just a ‘bonds vs stocks’ rebalancing dynamic trade—as it too would mean that the ‘value vs growth’ or ‘cyclicals vs defensives’ trades would see significant reversion to the mean within equities, which would cause performance pain in light of the recent exposure grab there. Further moves into the end of the month are key “tells” with regards to “momentum” and “anti-beta / low vol” outperformance, which would increase the likelihood success with a January “reversal strategy” (buy bottom decile, sell top decile)—again, WHICH IF IT TRIGGERS could be a set-up for ‘low vol’ and ‘growth’ outperformance against recent ‘value’ and ‘cyclical’ leadership. A similar ‘mean-reversion’ observation could then be extrapolated into other asset classes.
The point I’m trying to make is that the LONGER-TERM story on higher rates and the rotation into a more reflationary ‘pro-growth’ allocation mix still stands (see any “RBC Big Picture” for the evidence of global developed inflation expectations, enormous trajectory of global data–especially PMIs, of ‘confidence’ and other indicators of ‘animal spirits’ accelerating etc)…BUT we are nearing that counter-trend rally—with January as ‘the chalk’ for a likely start date. Strategic vs tactical.
It stands so far as it stands, yes. Though for me it is no more than a medium term sugar hit before we head back down. A classic boom and bust cycle. Citi’s Willem Buiter has more:
In 2016, the amount of incremental monetary easing already slowed when it comes to policy rates, with average AE [advanced economy] interest rates roughly flat. Yet, the average AE policy rate ex-US still fell by 0.2pp in 2016 as seven out of the 11 AEs we track still lowered their policy rates (Australia, Euro area, Japan, New Zealand, Norway, Sweden, and the UK), with only Denmark in addition to the US raising policy rates. Furthermore, the euro area and the UK also announced large expansions in their asset purchase programmes.5 Indeed, average AE central bank balance sheets saw the largest increase relative to GDP since 2008 (they rose by roughly 4pp of GDP).
By contrast, in 2017, we expect only two AE central banks to cut policy rates (modestly, in New Zealand and Canada), while we expect one to (modestly) hike (the US; see Figure 4). We do not expect any major new asset purchase programmes to be announced in 2017. But the ECB on 8 December extended its asset purchase programme at a lower monthly pace (from €80bn/mth to €60bn/mth from Apr-17). We expect that the Riksbank will continue purchases also at a slower pace and that the BoJ will continue its asset purchases under its new yield-targeting framework. Irregular asset purchases by various central banks (usually to stabilize exchange rates) also remain likely. However, AE policy rates would remain very low, while average AE balance sheets would still expand significantly
Advertisement
AE Inflation is picking up slowly… Prior rounds of AE monetary easing were usually triggered by low inflation (and repeated undershoots of inflation relative to forecasts) or weak growth. AE headline inflation is likely to rise in the coming months and reach roughly 2% in the AE on average in the spring, the highest level since 2012 (see Figure 6). Many of the drivers behind the current uptick may well be temporary and we believe that, for now, underlying inflation in AEs remains low, particularly in the euro area and Japan. However, downside risks to AE inflation may be receding somewhat and upside risks to inflation are rising. Meanwhile, AE potential growth is running slightly above-potential growth, average unemployment in AEs is at the lowest level since September 2008 (suggesting that output gaps are no longer large) and fiscal policy is loosening across AEs…Second, the perceived costs and benefits of incremental monetary easing are changing. The ECB and the BoJ, among others, have noted that interest rate cuts and asset purchases can sometimes hurt financial sector profitability (for banks, life insurance companies and pension funds) and that such policies may therefore, under some circumstances, tighten rather than loosen monetary conditions. The BoJ argued recently that the sluggish and adaptive formation of inflation expectations implies that it is challenging for monetary policy to lift inflation quickly. Popular and political opposition to negative interest rates in particular, and perhaps also large-scale asset purchases, appear to be rising, including in Germany, Japan, the US and the UK. Operational challenges also appear to be growing, including the possibility of running out of suitable assets to buy or running up against the effective lower bound (ELB) on nominal policy rates. And as we have previously noted, concerns that monetary policy is significantly, and potentially increasingly, distorting financial markets are also on the rise.
Advertisement
…Part of the reason why monetary policy is stuck is also because it is facing operational and effectiveness challenges, especially at or near the ELB. That is, monetary stability is not purely by choice. That raises the question of how monetary policy could react when there is a need to boost aggregate demand. This is especially so as there appears to be very little willingness to consider lowering, let alone removing, the ELB. And even if the ELB were removed, the sensitivity of aggregate demand to further declines in interest rates would be in question, especially in highly leveraged economies.
It is all but given that AE central banks will enter the next downturn with continued huge balance sheets and the policy rate so close to the ELB, that an early encounter with the ELB is all but unavoidable. In pre-GFC cycles, AE central banks used to cut the policy rate by about 300-500bps – peak to trough – on average. It must be a source of concern that AE central banks are likely to enter the next downturn with their policy arsenal not significantly less impaired than it is today.
In case AE monetary policy may end up exploring new avenues, if all else fails, measures will include to lower the ELB, purchases of an even wider range of assets or lending at even longer maturities or against even wider ranges of assets as collateral. AE monetary policy therefore continues to evolve, as the example of the BoJ shows. Even though for the time being it appears that monetary policy is set for a pause, we doubt that the future of AE monetary policy will be any less exciting than its recent past.
Substitute New Zealand for Australia for further rate cuts above. The next evolution in AE monetary policy will be helicopter money to monetise the next wave of global infrastructure. But first comes the Trumpian boom and bust cycle.
David Llewellyn-Smith is Chief Strategist at the MB Fund and MB Super. David is the founding publisher and editor of MacroBusiness and was the founding publisher and global economy editor of The Diplomat, the Asia Pacific’s leading geo-politics and economics portal.
He is also a former gold trader and economic commentator at The Sydney Morning Herald, The Age, the ABC and Business Spectator. He is the co-author of The Great Crash of 2008 with Ross Garnaut and was the editor of the second Garnaut Climate Change Review.