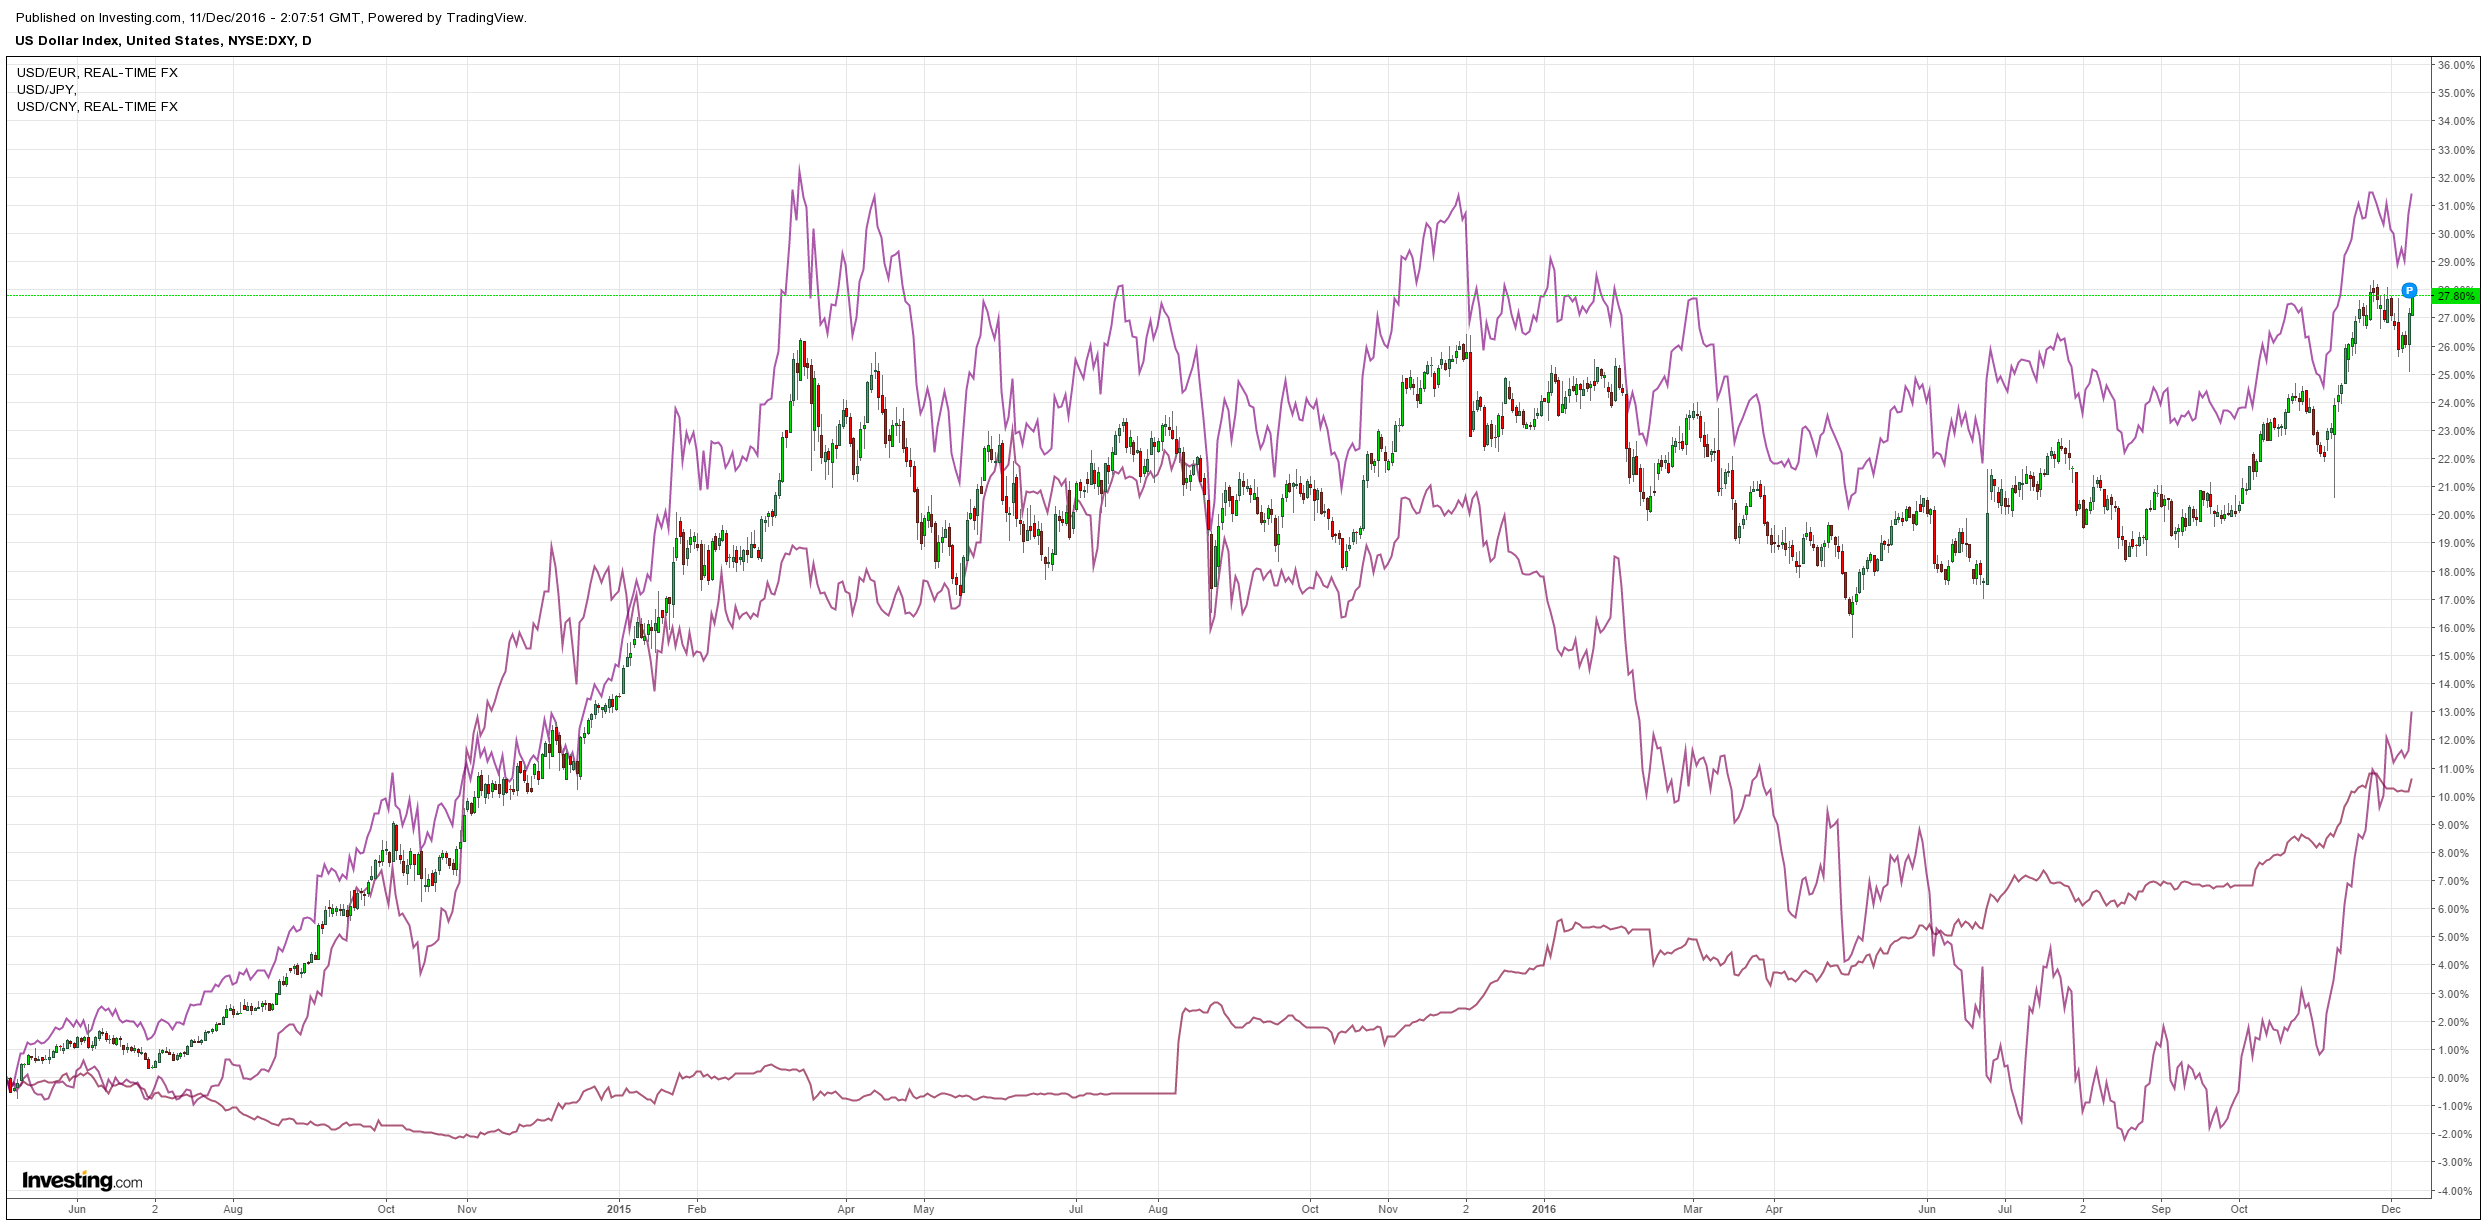
The USD roared Friday night. All other majors were crushed:
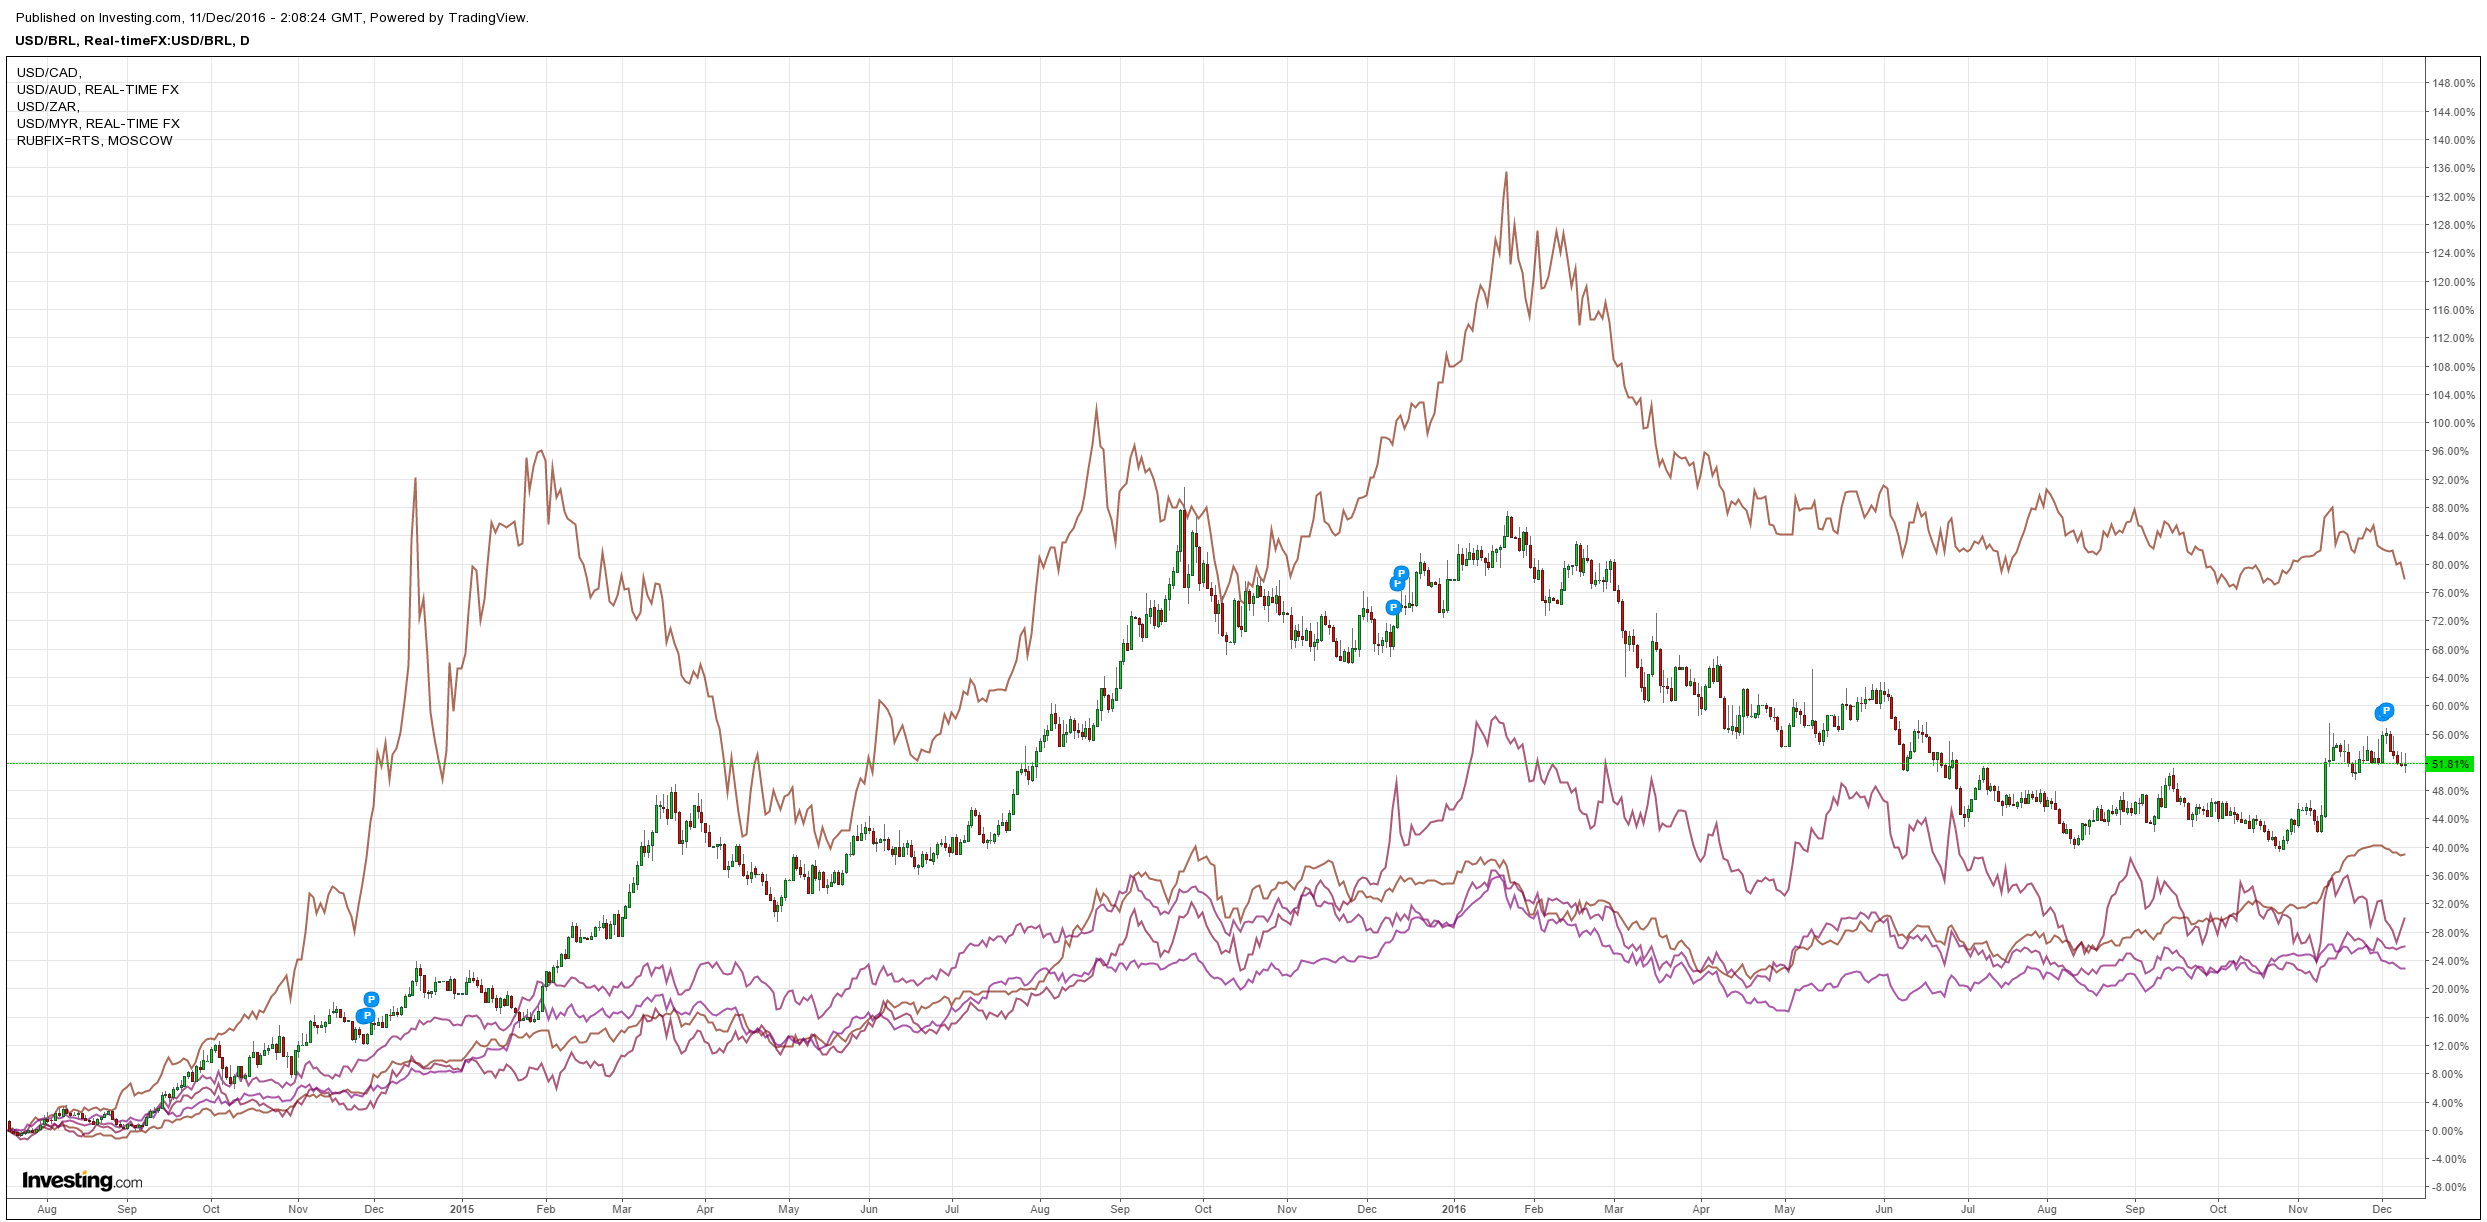
Commodity currencies were still strong:
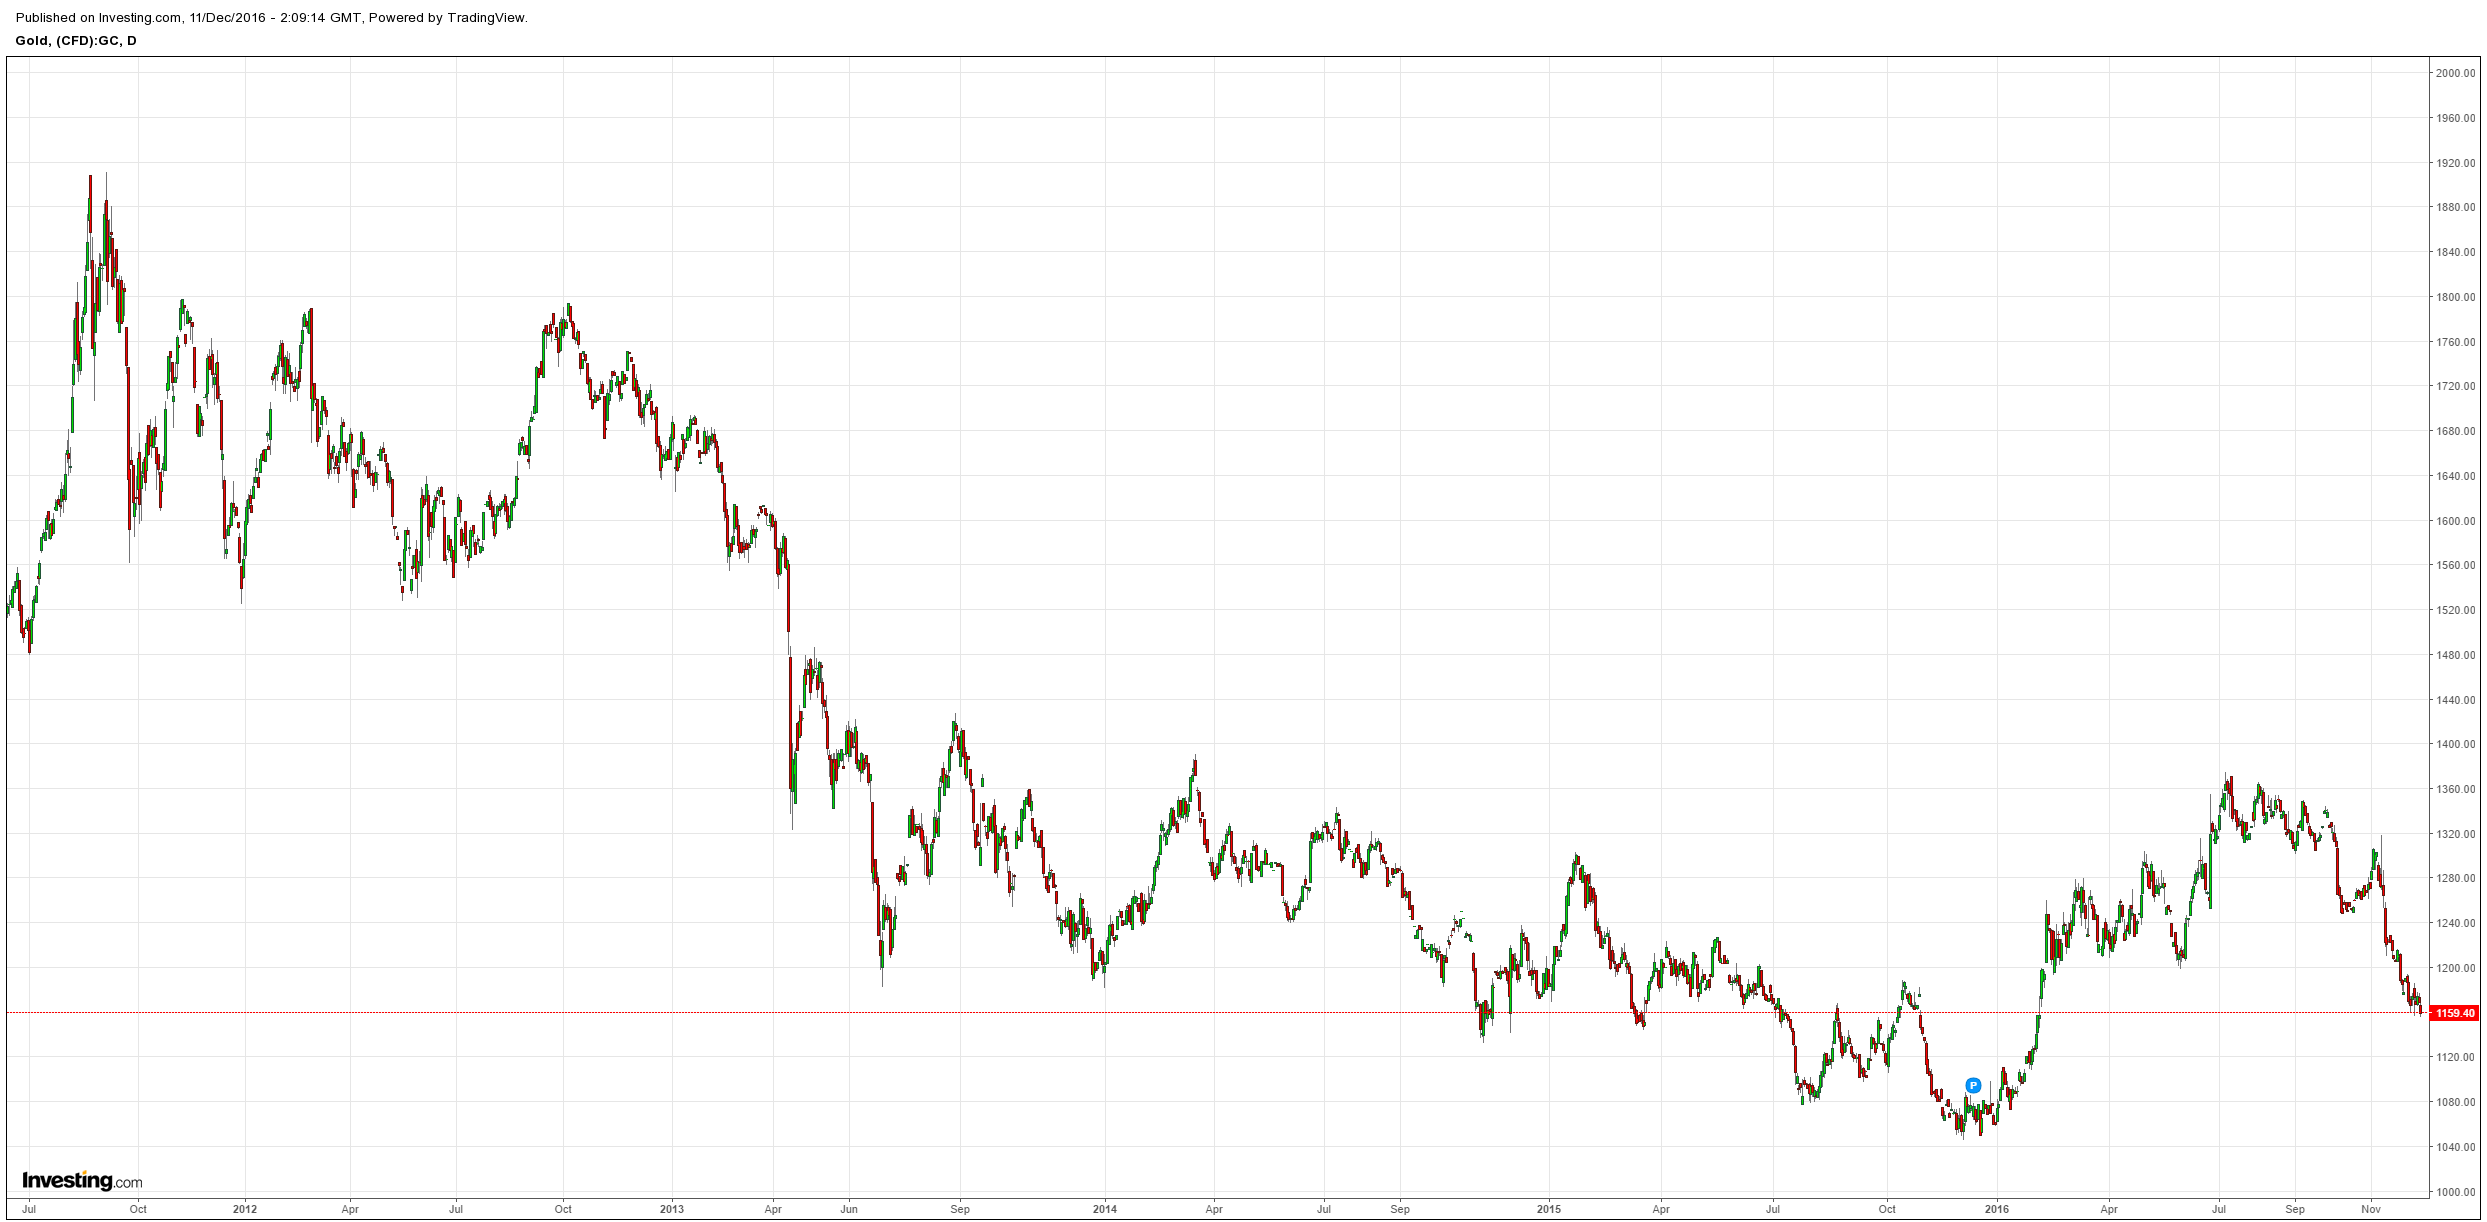
Gold is weak and looking weaker:
Advertisement
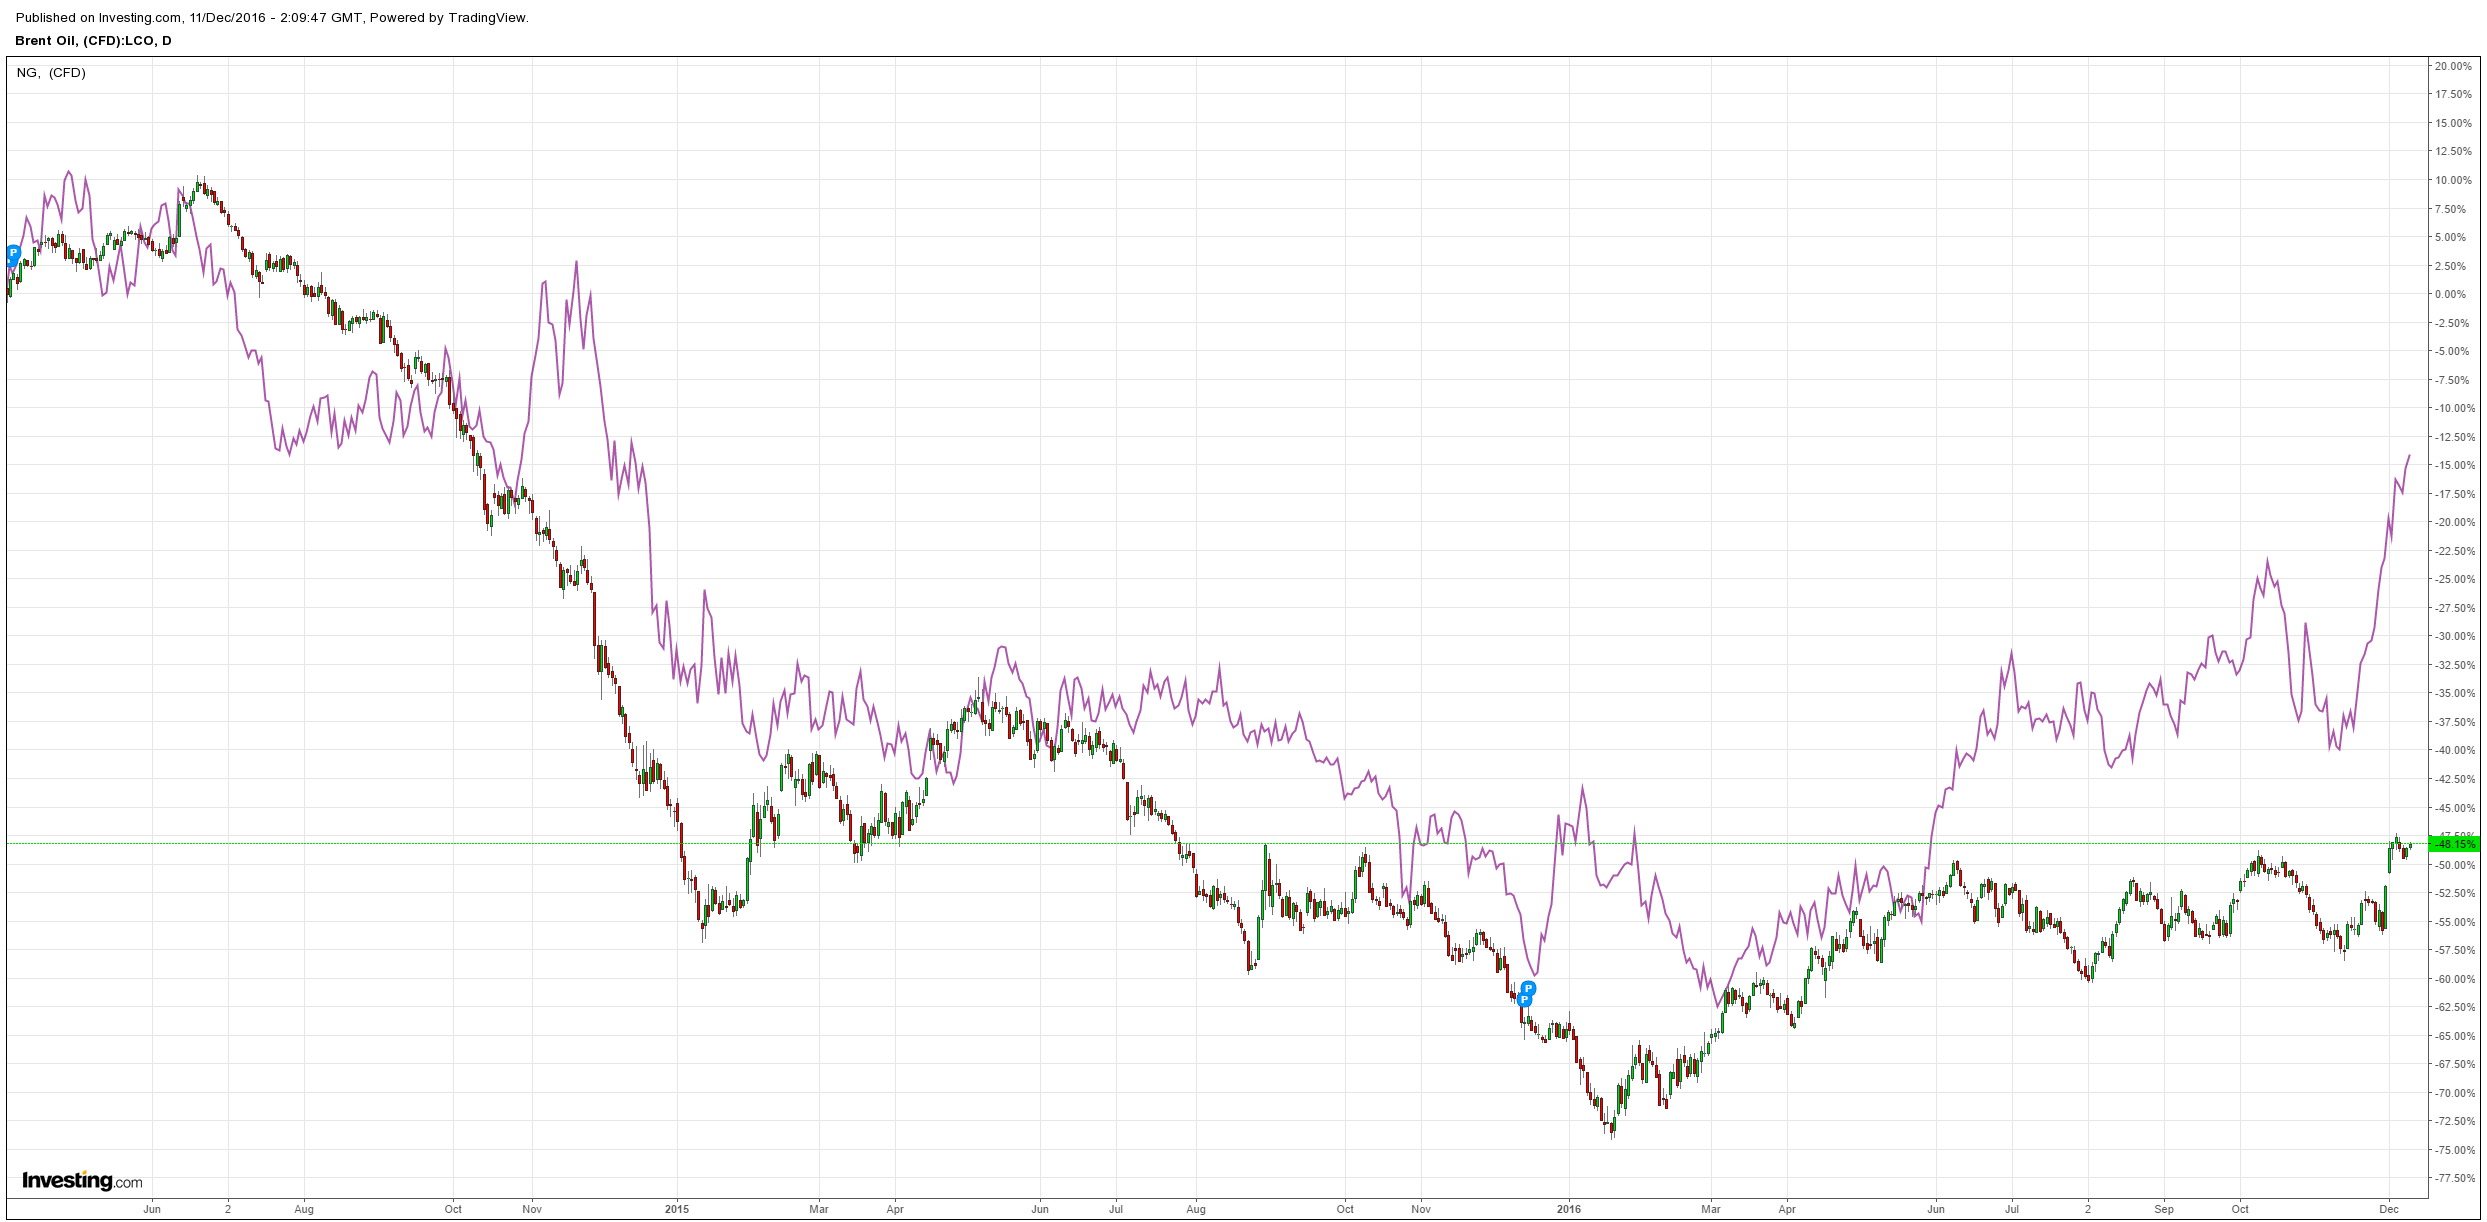
Brent went nowhere but it’ll rocket today:
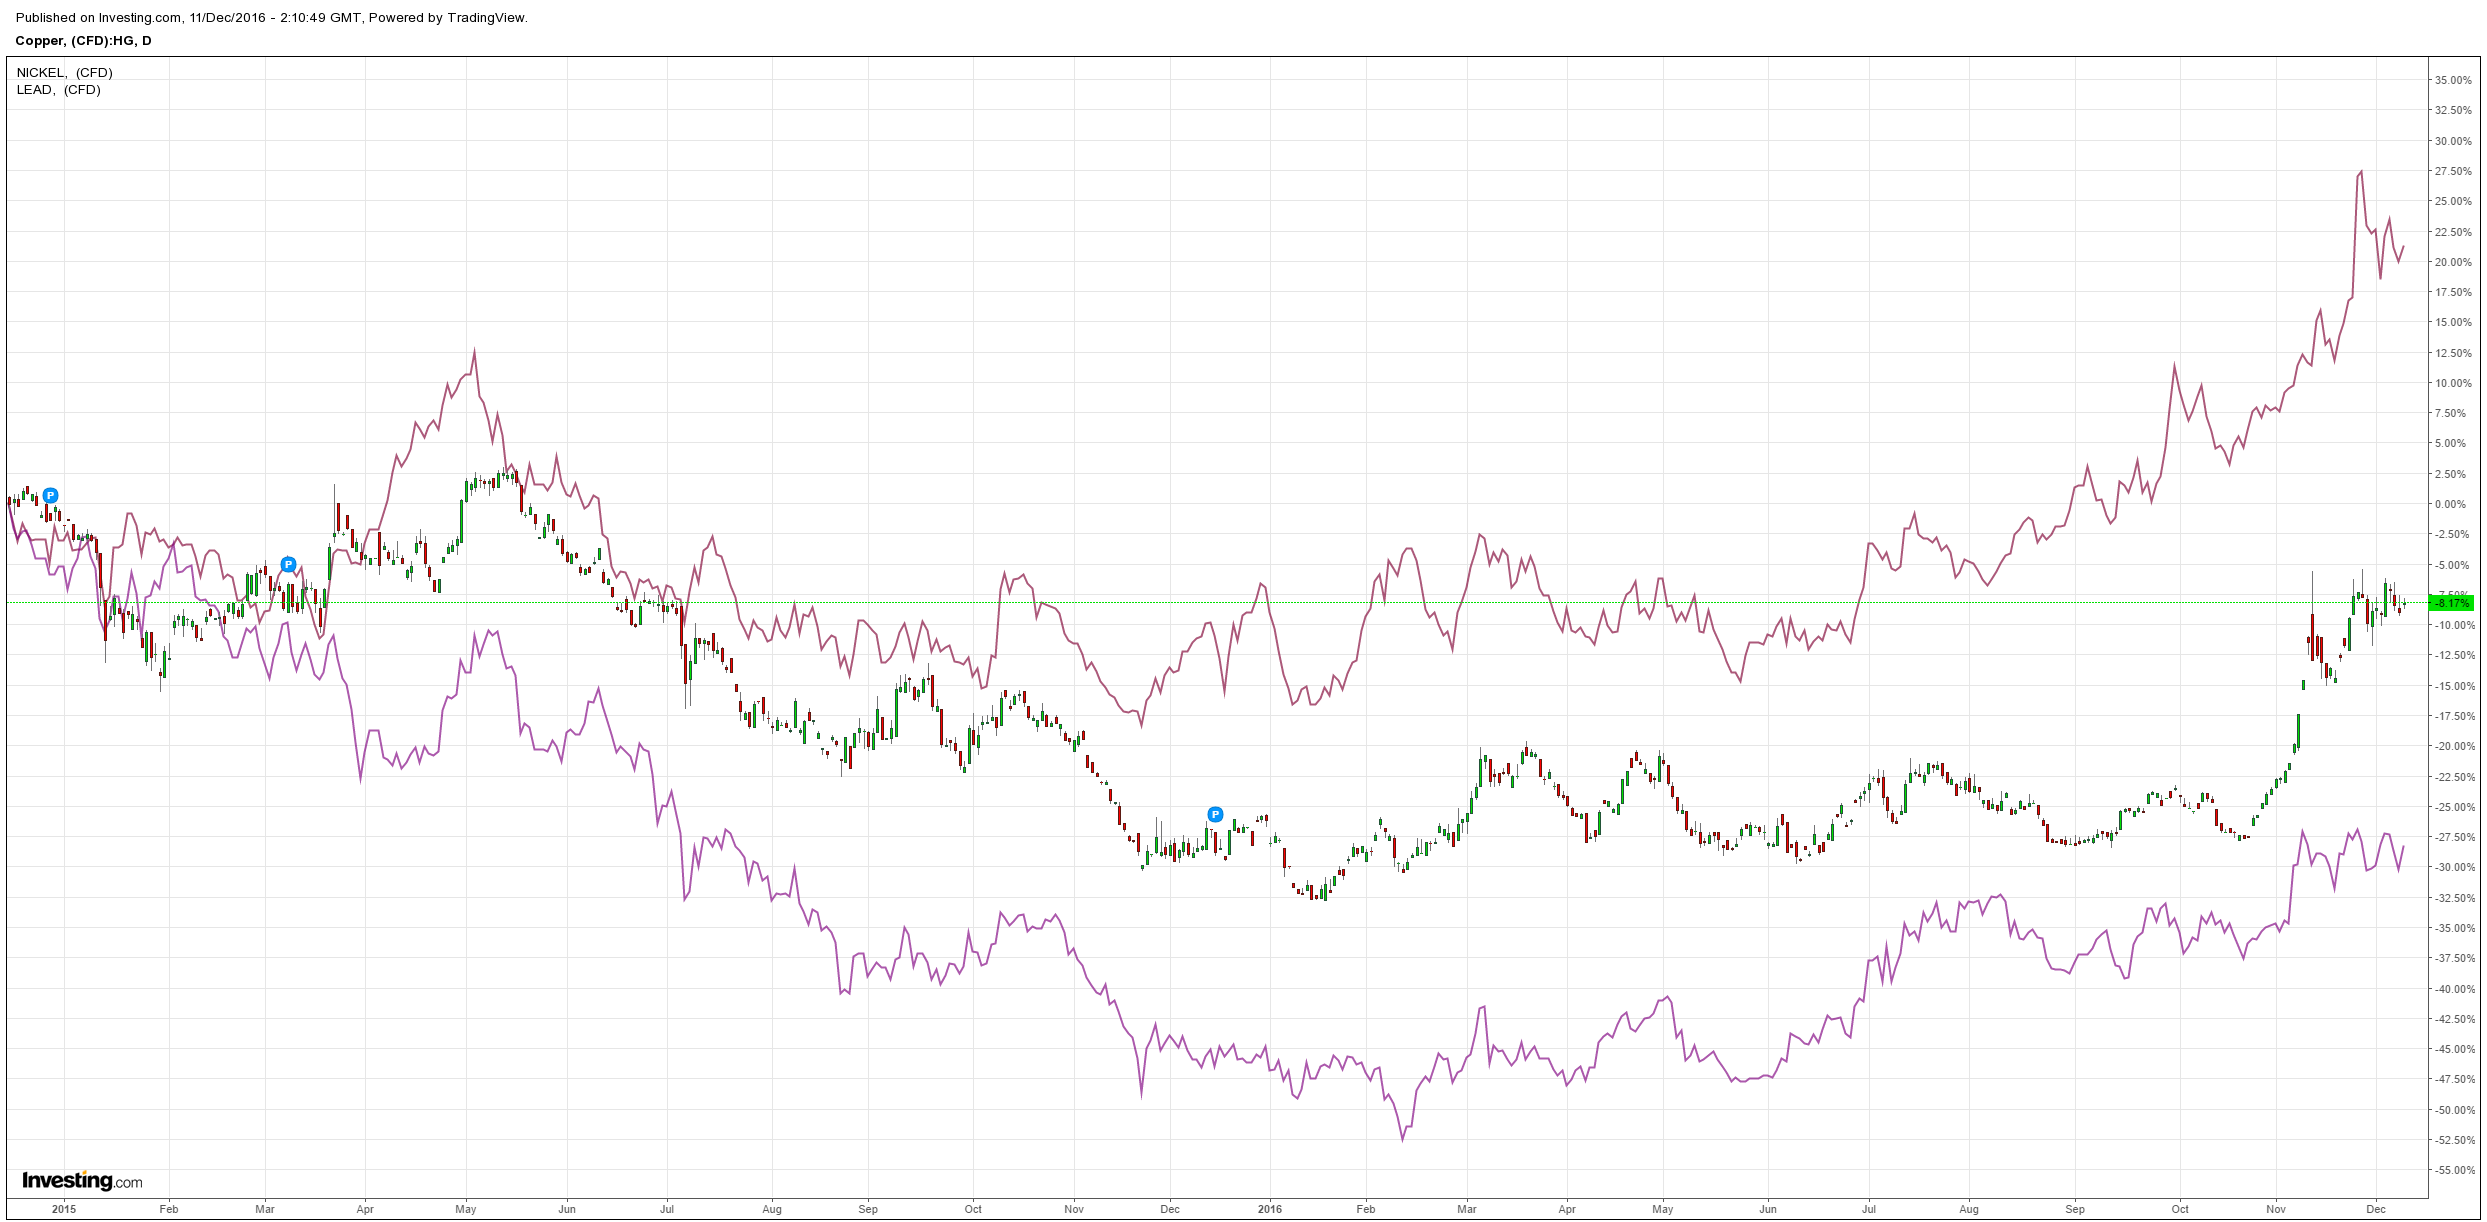
Base metals have stalled for now:
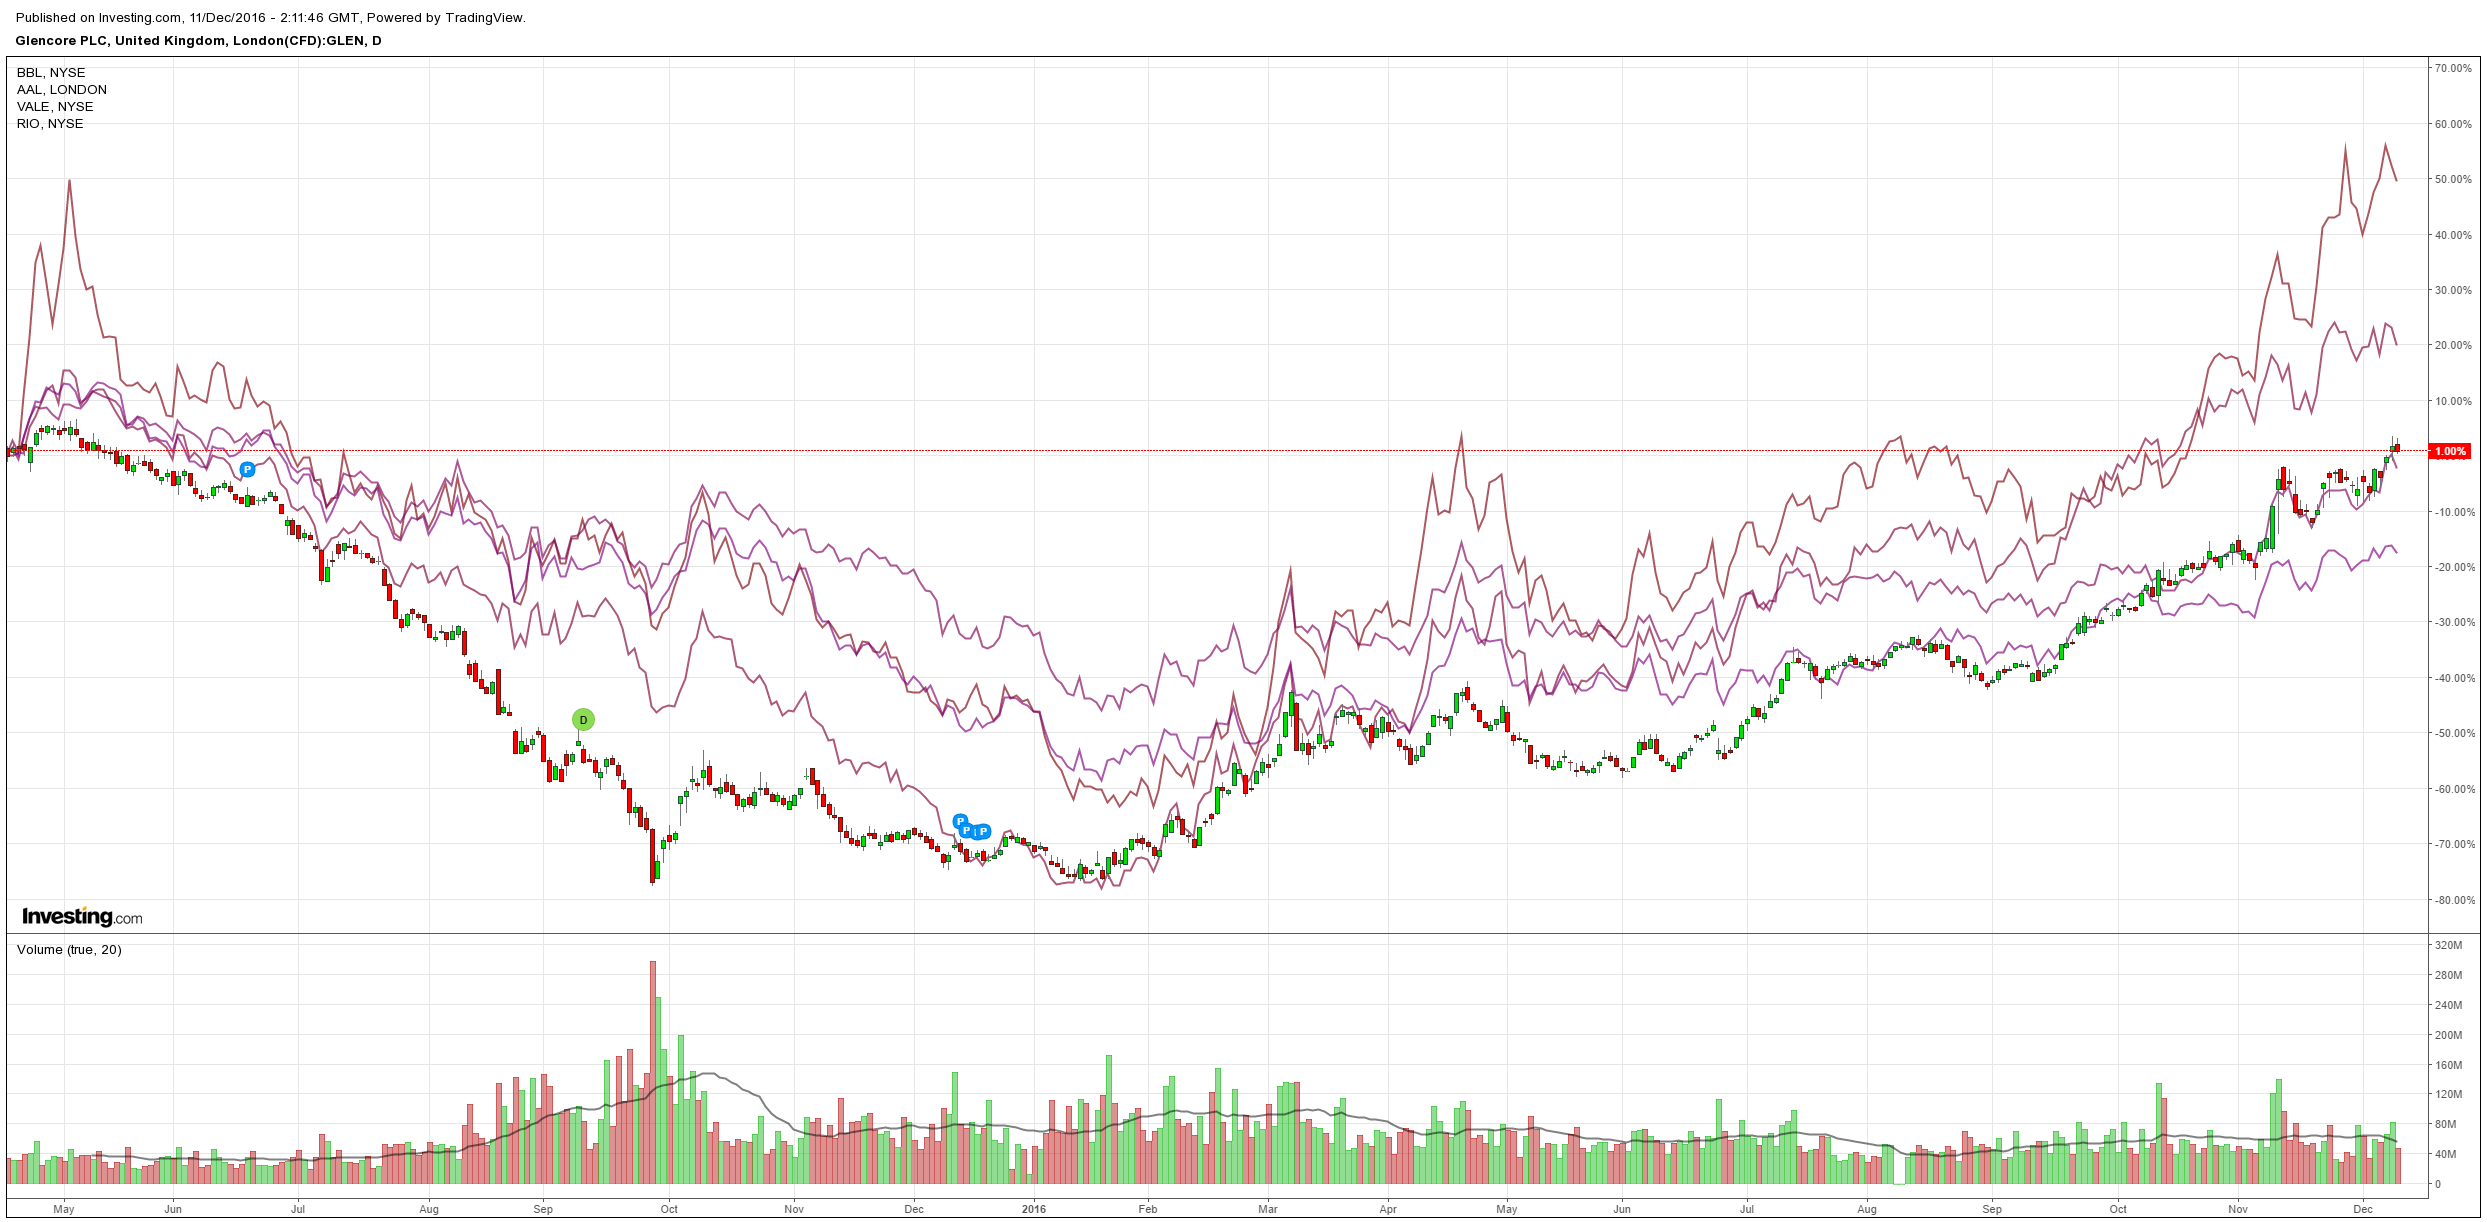
Big miners fell:
Advertisement
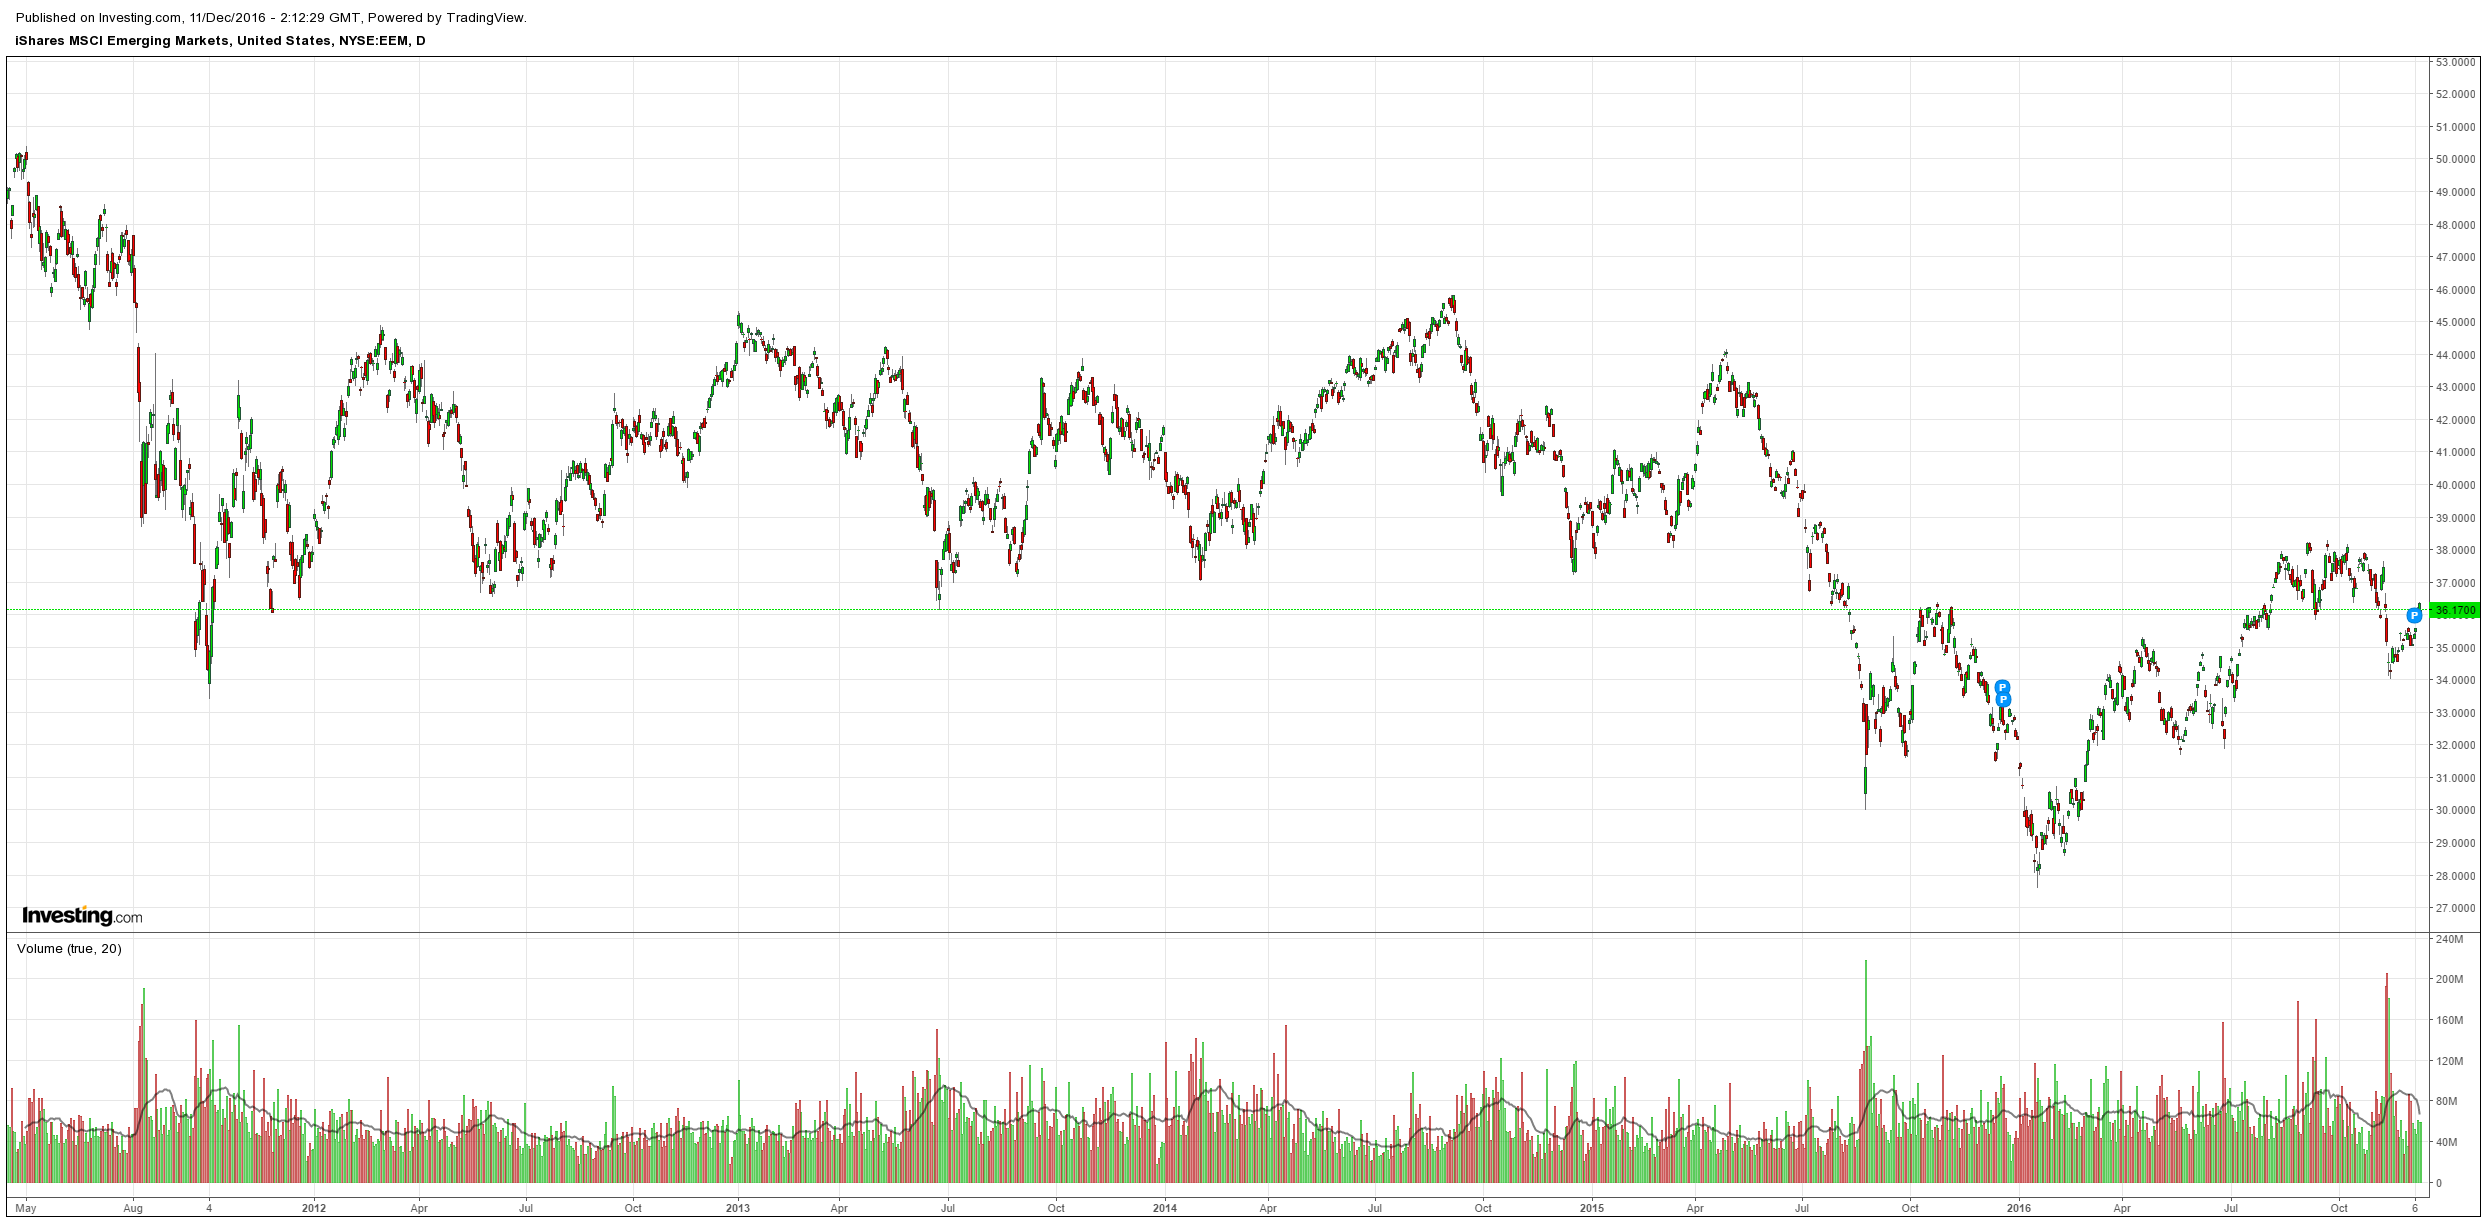
EM stocks fell:
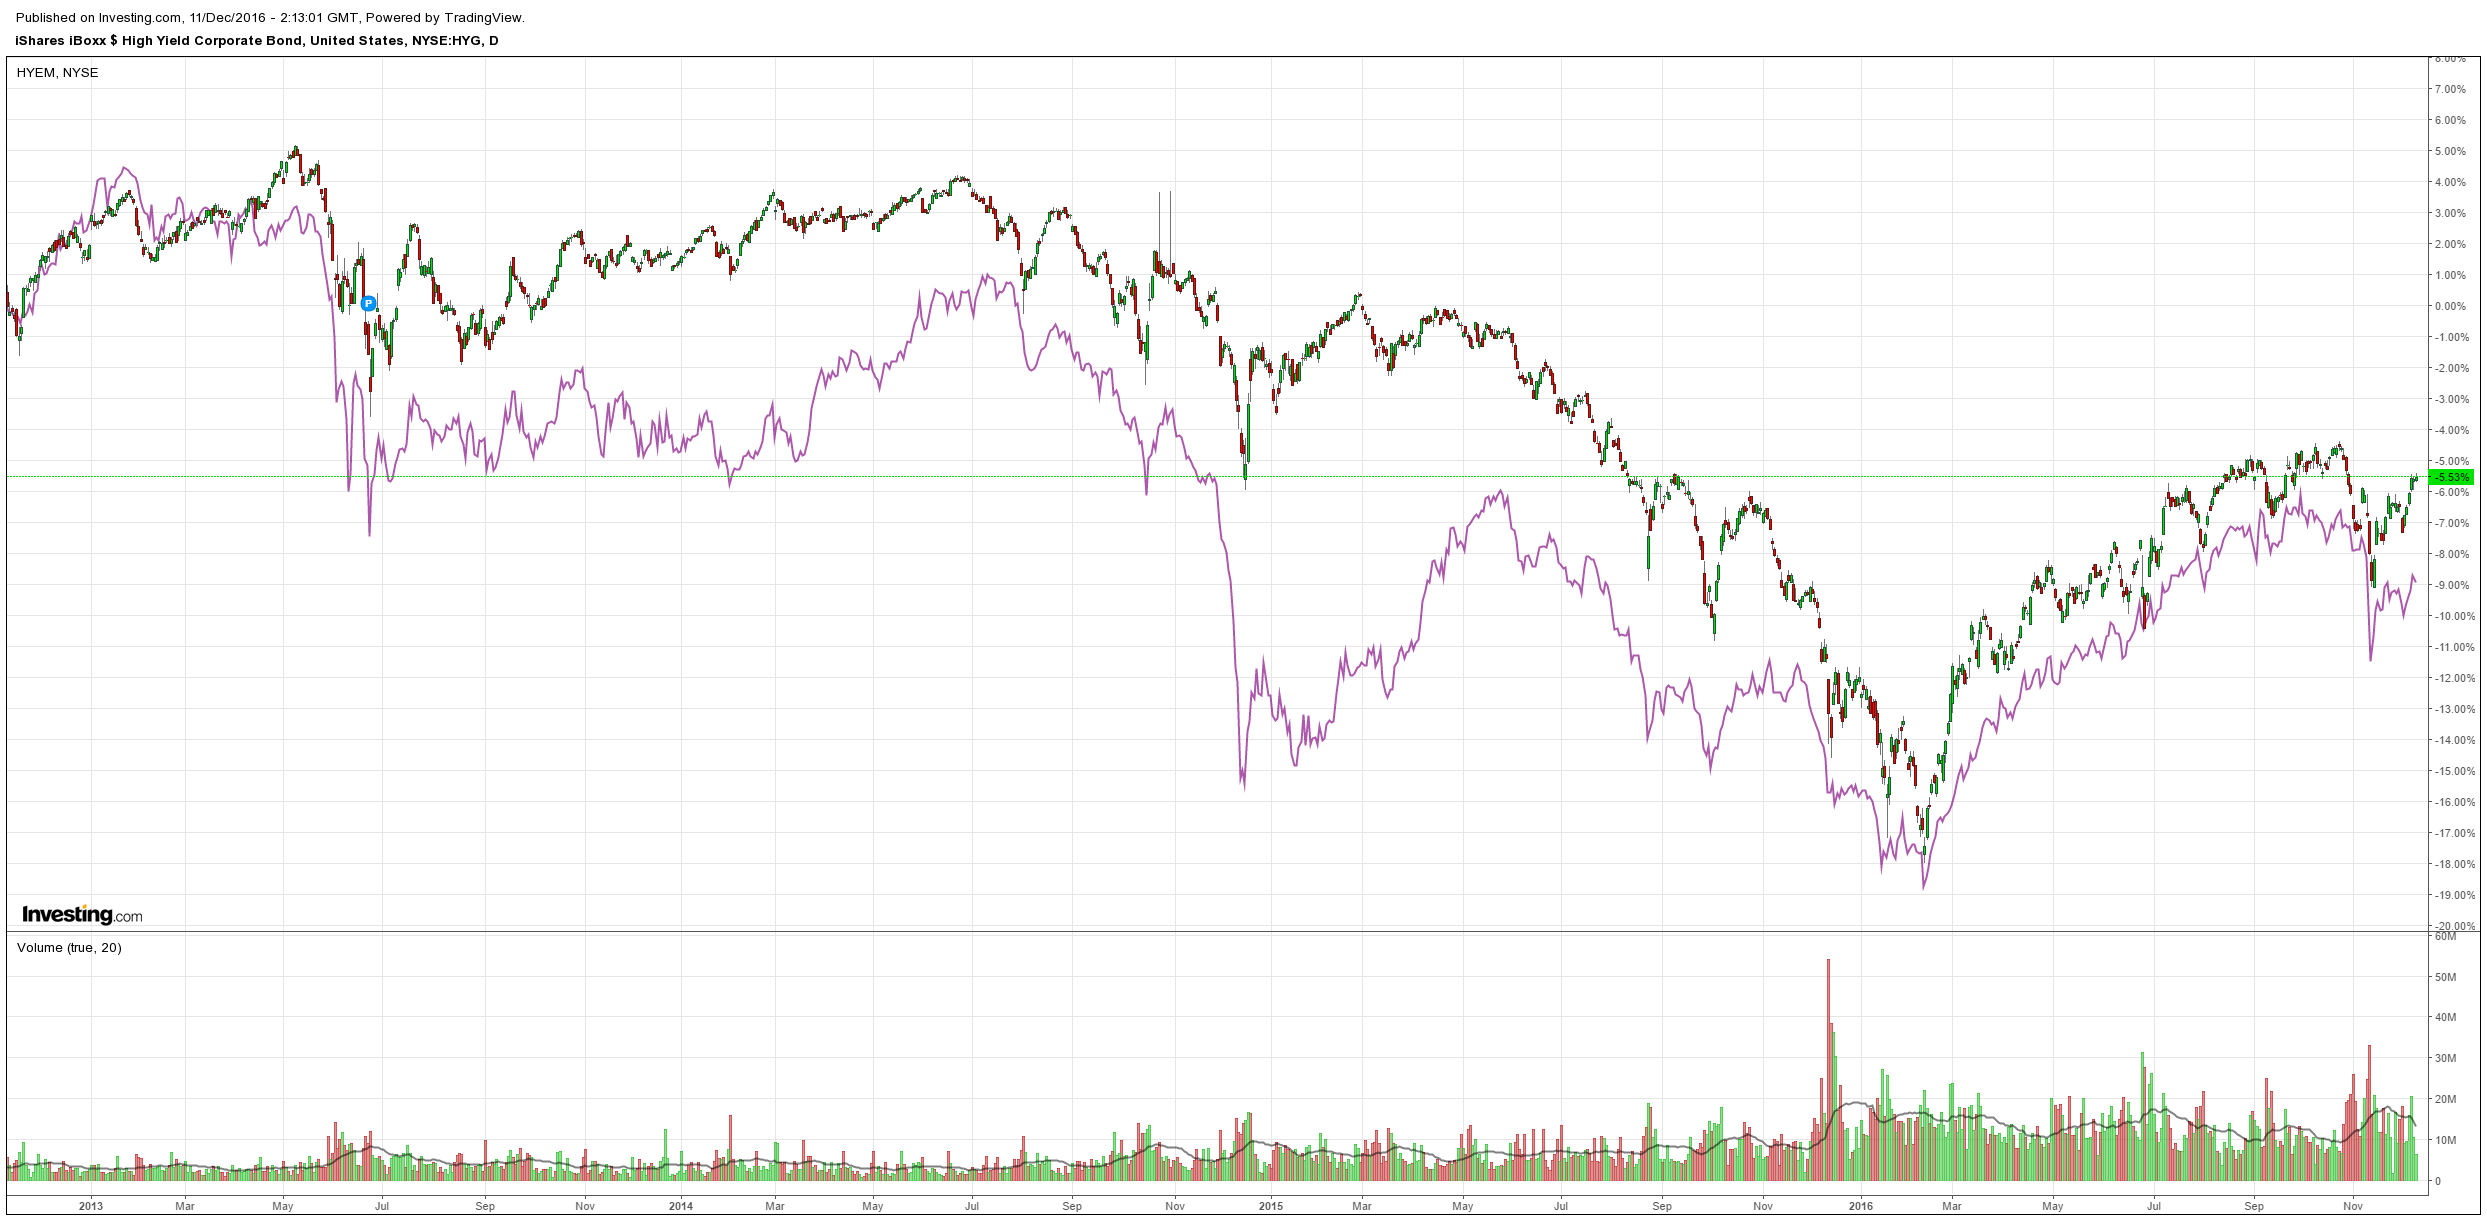
US high yield rose, EM fell:
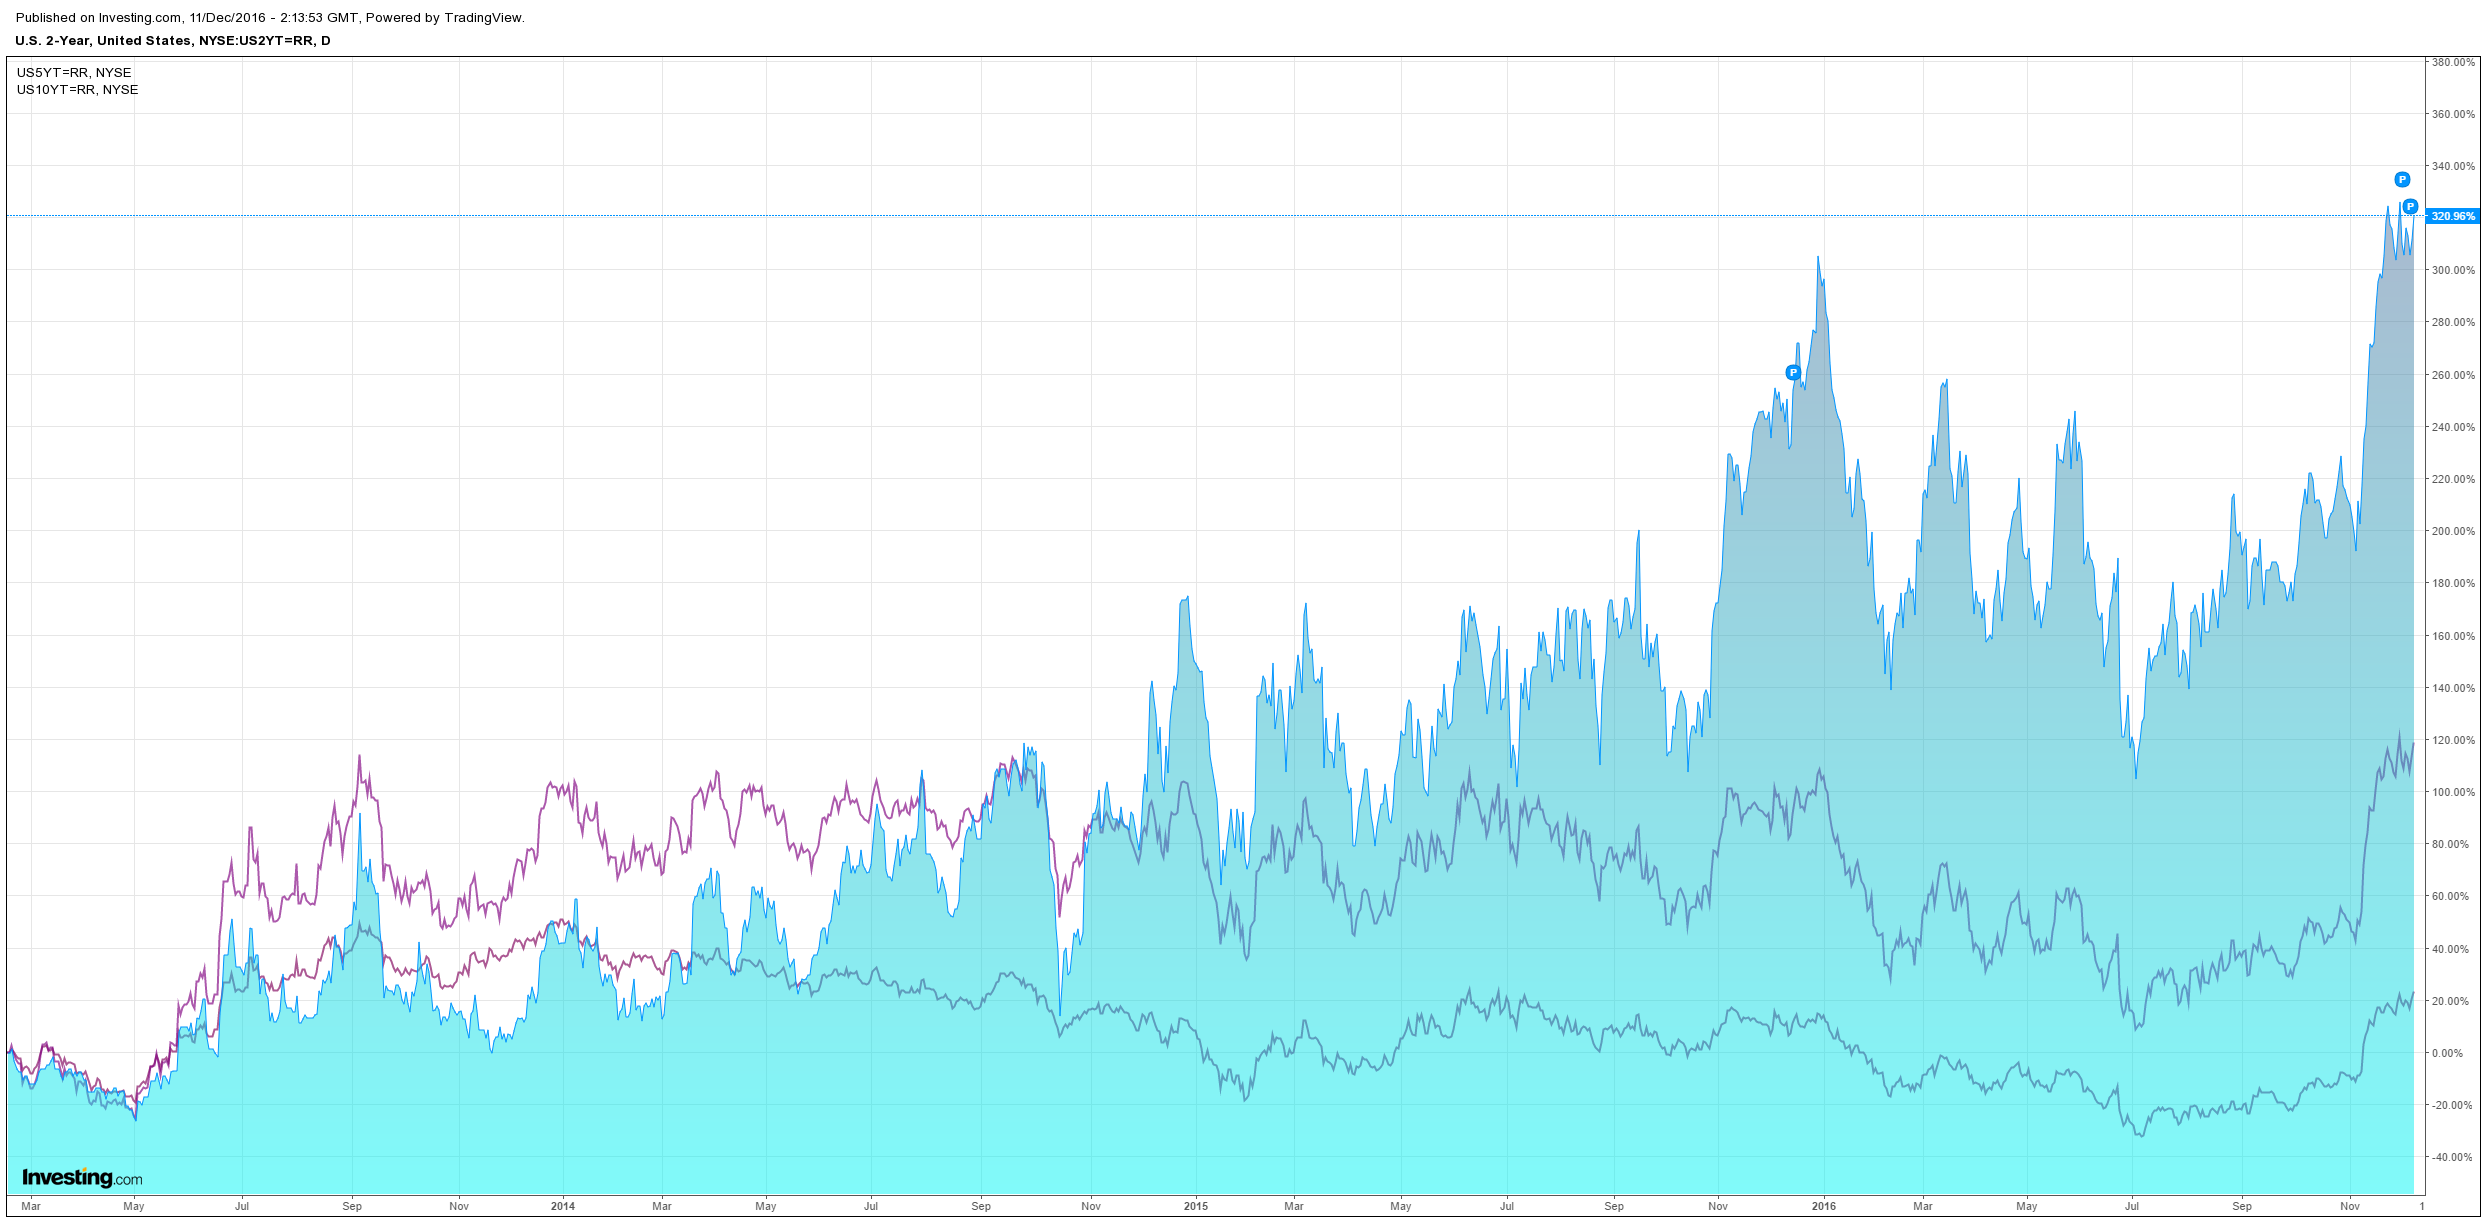
US bonds were flogged:
Advertisement
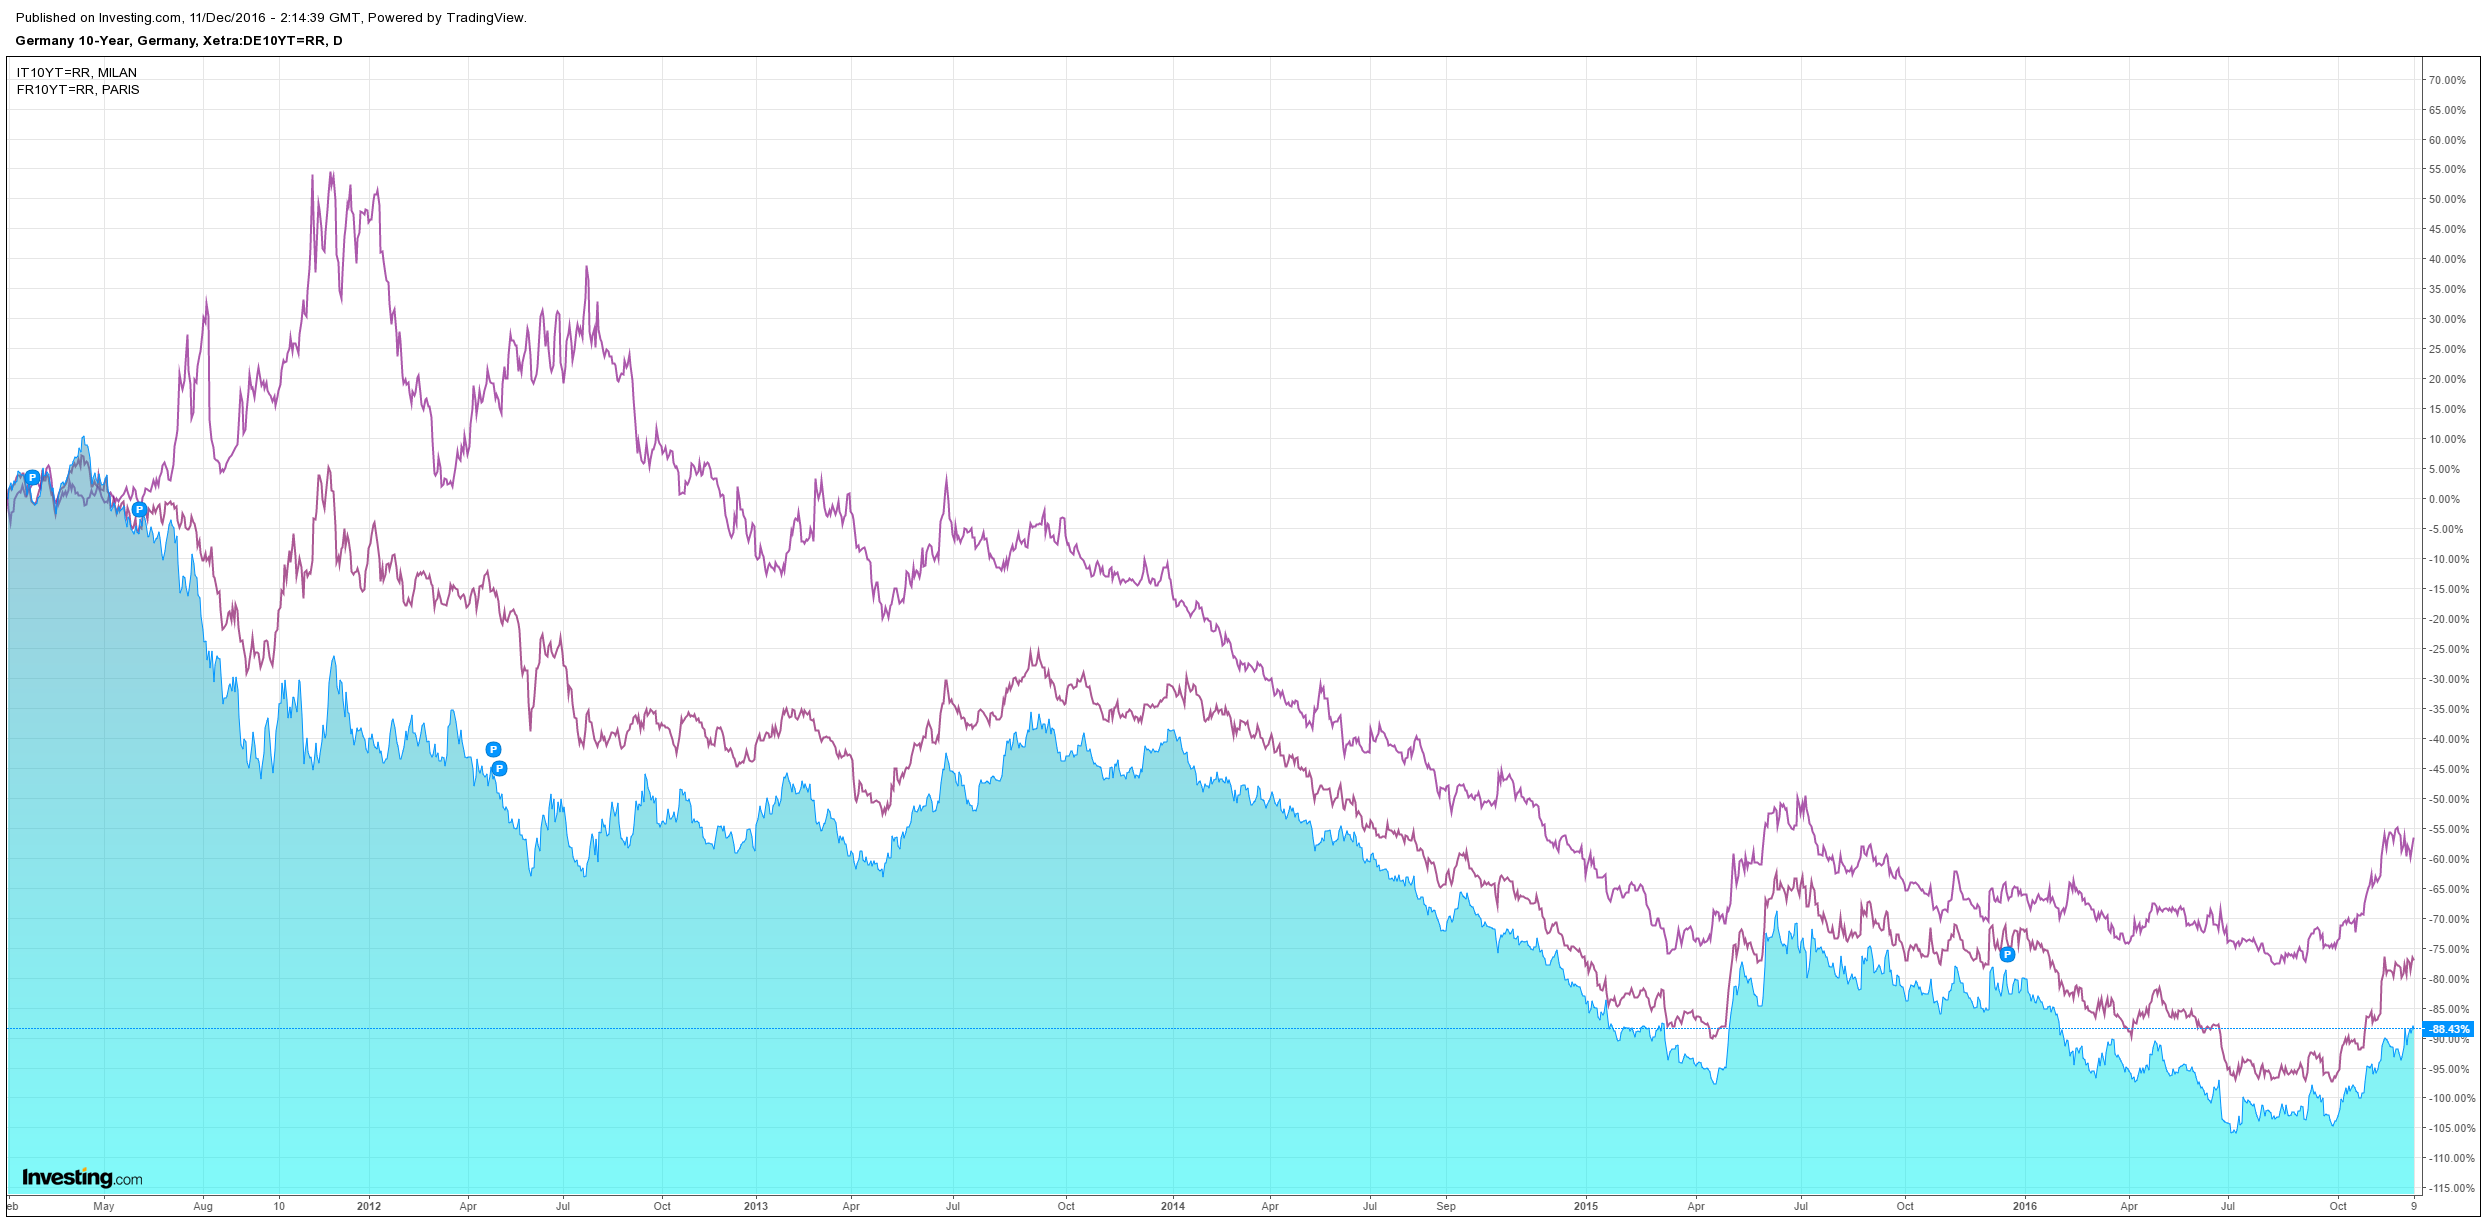
European spreads widened:
RBC has a fabulous take an where we are:
As I’ve been discussing since March, ‘price led news’ on a re-gearing first appeared in equities markets (due to the critical factor of the ‘inflation expectations’ input in the macro regime as crude pivoted off the lows thanks to the unspoken “Shanghai Accord” or “weak US Dollar policy”) in the form of nascent cyclical outperformance over defensive / low vol / ‘bond proxies’…well before any data upturn. These ‘yield plays’ had been crowded into by everybody from retail investors to real $ investors to CTA’s to risk-parity to risk control / vol target funds as the sharp deflationary slow-growth trade shook markets over the prior year and a half, in turn, seeing very stodgy ‘bond-like’ equities names suddenly picking up ‘momentum attributions.’
Obviously what has since followed—crude turning -> inflation expectations running, credit spreads reversing massively tighter, equity vol plummeting all while global rates collapsed to new all-time lows in July on account of NIRP and unprecedented QE—then saw a shock escalation upon central bank acknowledgement (BoJ in Sept) of the limits of QE and the negative consequences of perpetually flatter yield curves. Economic animal spirits kicked-up, inflation expectations / core inflation continued to run while global PMIs began printing multi-year highs (thank you, PBoC credit-pumping), US Consumer (today’s uMich at 11 yr highs) and CEO confidence skies to multiyear highs, curves steepened dramatically globally / long-end sold off, and OH YEAH, a populist takeover bent on advocating fiscal stimulus through infrastructure investment, deep tax cuts and business deregulation won the US election.
Now we are here.
I have been making the case that the ‘real data turn’ has kicked up the ‘animal spirits’ in key segments of the global economy, and that we have seen the secular lows in bond yields. The reality in markets is that a ‘status quo’ narrative of stagnation—slow growth, slow inflation—is being reset, forcing the largest investors and asset allocators in the world to reallocate their 5 year ‘lazy positioning’—AKA ‘long fixed income / duration,’ ‘long income / yield,’ ‘long secular growth and defensives’ against ‘underweight / short cyclicals’ and ‘underweight / short inflation.’ Now it’s “long equities (value over growth / low vol), long inflation, long HY, long loans, long Dollars, short duration, short EM, short gold, short correlation (eeeek).
The story I’ve been pushing here is that it “takes time to turn the Titanic,” and verbatim feedback from CIOs is confirming that they have been forced into fierce “catch-up” mode, but they can only move so fast (after some told me that they haven’t looked at banks for 5+ years; energy and industrials for 3+ years etc), let alone just taking up net exposures / drawing down on cash / getting ‘riskier’ in your asset / security mix (i.e. for US investors, stuff that is more ‘geared’ to the domestic economy like small cap). As many were waiting for a pullback that never came to ‘engage,’ it then created a situation where buyers were in fact higher.”
Clearly, the melt-up of the past two sessions (and again into today) which saw all-time highs in S&P and the most ‘new highs’ for individual US stocks in three years is an expression of this. I had a number of funds / traders tell me that they ‘threw in the towel’ over the past few days of ‘fighting it’ after they’d earlier in the month been focused on trying to ‘shut it down’ in December to protect gains…so they went out and either took up their nets or bot more equities upside (even recent laggards like EU banks and US defensives, interestingly enough) and currently feel darn-good about it, as the tape is rewarding them mightily.
The way you know there is a panic capitulation into ‘long stocks’? When both VIX and index travel higher at the same time, which has happened for two consecutive days into today (very rare–the VIX was +3% both days against positive SPX, which has only occurred twice before). The massive ‘upside reach’ with calls bot (and some puts sold) got dealers short gamma, which created a self-fulfilling rip as the higher index moves, as so too did their delta hedge requirement—forcing them to buy more futures the higher the index goes. With this huge ‘trigger,’ index skew was altered massively. As upside index vols had been so crazy low for a long time, there was a very sudden repricing of call vol, while put vols held…net / net, VIX was essentially ‘reset’ higher.
In classic ‘market finding the point of maximum pain’ form, today we are seeing a third-straight day of ‘short gamma’ behavior in equities upside grabbing.
SO WHAT DO WE THINK COULD DERAIL THIS THEN?: Mark Orsley and I have been brainstorming on a number of scenarios all week that could disrupt “the great reflation” trade (and the ‘under the hood’ rotations that have come with it, whether out of bonds into stocks, or sector / factor performance in equities). We will try to unpack some of these further over the rest of the month, but as a general list, here goes:
“Financial tightening” via higher USD and rates choking off the global economic acceleration, with potential for an especially disorderly rates move (rogue upside inflation print?) to create VaR shock spillovers into markets (as evidenced earlier this year during various “bond tantrums,” triggering “short convexity” vol strategies into deleveraging and violent macro factor rotations;
A similar rates dynamic where somewhere between the ~2.75-3.00 10Y yield level we would expect to see the ‘equity risk premium’ / ‘multiples driver’ tailwind of the QE era of perma-lower rates being ‘reset’ into a headwind…not to mention the potential negative incentive it would provide for corporate buybacks, which have been the largest source of demand for equities over the past five years.
The growing “sell the Trump inauguration” meme that is rapidly becoming a narrative amongst traders (these things have a tendency of either self-fulfill OR creating the exact opposite outcome, LOL);
Various “Trump uncertainty scenarios”:
Ongoing agitation of China, as Trump potentially names them as an FX manipulator shortly after entering office, leading to a “shot across the bow” Yuan devaluation (in conjunction with this http://on.wsj.com/2gkfCQ8 as a driver of ongoing Yuan weakness—triggering a ‘deflationary impulse’ globally) OR causing an acceleration of the PBoC’s ongoing Treasury selling against their FX reserve / outflows situation.
Threat of increasingly “anti-corporate profits” Trump (see: healthcare and Boeing tweets this week, yikes) resetting equities investors’ expectations; “Main Street versus Wall Street” stuff accelerates.
As opposed to the nearly consensually bullish ‘new tax regime’ outcomes for stocks (every percentage point of corp tax cut driving an additional ~1.30 of earnings for the S&P—thus all of the S&P target upgrades since the election), the potential utilization of the new Administration to deploy a “border-adjusted tax” system (highlighted in a super provocative note from RBC’s stud US Hardline Retail analyst Scot Ciccareli, this week garnering a ton of client attention) which could hit multiple industries’ earnings very sharply. Again, “Main Street vs Wall Street,” as the full-court press on US corporates to bring jobs back domestically whacks margins, earnings and profits (per above).
One other thing I’ve been doing a ton of work / reading on: The “January Effect”—the quant factor-reversal phenomenon (and NOT the recently false narrative on higher stocks in Jan due to investors “putting money to work” or “new year, new optimism”, which simply hasn’t held / gone backwards since the turn of the century, as quants ‘arb’d it out’).
This started as a Fama / French ‘mean reversion’ observation, with a cross-asset example being the point I’ve been making about the past three ‘December into January’ transitions all feeling quite similar: generally speaking, investors were super bullish on stocks / growth, bearish on bonds through end of Q4 into the turn of the year. Then, January happens, and there has been ‘blood in the streets’ to the tune of the past three Januarys being -3.8% for the S&P on average against TLT (UST long end) being up an astonishing +7.2% on average (over those same three Januarys)—as consensual narrative and positioning was destroyed out of the gates. What spooked me of course was how similar this year’s set-up is AGAIN looking. Gulp.
But the more in read and the more data I plotted, I saw that this goes much deeper than a simple ‘bonds : equities’ rebalancing trade. Basically, there is a dynamic where nearly all quant market neutral factor strategies underperform in January. Yin Luo (then at DB) observed something very interesting: that the outperformance of the ‘1 month reversal’ trade in January (meaning ‘buy Dec laggards / sell Dec winners’ strategy) is highly correlated to the performance of ‘momentum’ strategies in December.
This is rationalized by the “window dressing” phenomenon, as PMs like to buy outperforming stocks in December and sell underperformers in order to enhance the optics of their books to investors. Basically, this (formerly) anecdotal observation was creating a very quantitative signal to trade against in January, and that is exactly what has tended to happen. So, to take this a step further, if ‘momentum’ IS outperforming in December (as it confirms the window-dressing phenomenon is in full swing), it is very likely that the ‘January reversal’ then too is a high probability occurrence.
Adding another layer is the performance of ‘low volatility’ factor (‘anti-beta market neutral’) in December as another positive correlation with the performance of this ‘reversal strategy in January.” I would attempt to rationalize this as a potential phenomenon where some investors who are in fact outperforming might actually ‘downshift’ into “safer” names within their specialization as they do in fact look to protect gains but maintain that equities upside exposure. Again, if ‘low vol’ is performing in December, it has helped ‘set the table’ for the ‘January reversal’ strategy.
If you have both the ‘low vol’ mkt neutral strat and the ‘momentum’ mkt neut strategy working in Dec, then there is a high probability that we could in fact see January look like a major ‘mean reversion’ month, where LAGGARDS–the big ‘back half of year’ trade where ‘growth’ (tech) and defensives (bond proxies) have lagged as a source of funds, and LEADERS like value i.e. cyclicals like financials, energy and industrials have screamed higher—could in fact get flipped and reverse.
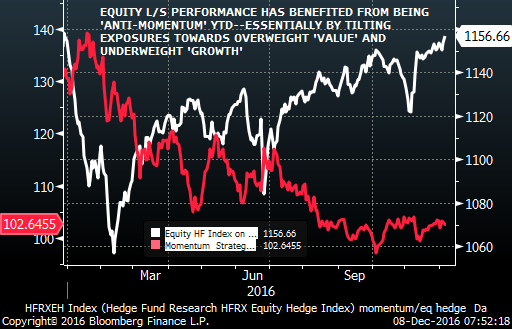
THIS IS BEYOND HUGE FOR EQUITIES INVESTORS BC MOST OF THEIR PERFORMANCE HAS COME FROM EFFECTIVELY SLAPPING ON VALUE EXPOSURE WITH GROWTH AND DEFENSIVES AS THE SOURCE OF FUNDS. This has basically made funds that are performing looking like “value market neutral” or “anti-beta market neutral.” See here:
EQUITY HF PERFORMANCE YTD SHOWS TILT TOWARDS ‘ANTI-MOMENTUM’ HAS BENEFITTED PERFORMANCE: Basically, long value against short growth and / or low vol ‘defensives.’
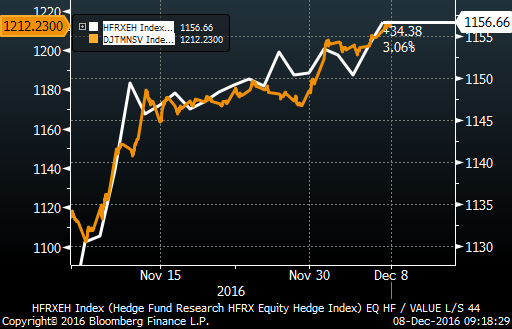
…AS SINCE THE ELECTION, L/S FUNDS ARE EFFECTIVELY RUNNING “VALUE MARKET NEUTRAL” (LONG VALUE FACTOR, SHORT GROWTH FACTOR) STRATEGIES: I’d call that some correlation.
As such, this factor strategy reversal in January could be punishing for many funds’ performance on account of the positioning rotation over the past few months.
Now for the good news: month-to-date, both Momentum L/S and Anti-Beta L/S are underperforming. But it certainly is catching my attention today that we are seeing in an ‘up’ tape LOW VOL leadership from Healthcare, Staples, Utes and Tech as the four best performing S&P sectors on the day, while at the same time, I’m seeing ‘momentum’ indicators like ‘cyclical beta’ and ‘cyclical / defensive’ pairs lagging!!!!
As a caveat, December as a month is historically ‘two-tiered’ with index performance / vol, meaning that the first half of the month has traditionally seen ‘meh’ performance, but then the back half is where we’ve gotten the big “Santa goosing”—meaning there is still significant amount of time before making any final judgements. But I will be watching this dynamic extremely closely over the next few weeks.
To that we can add a piece by Patrick Commins at the AFR (who is good because he runs their blog and so actually does some work beyond kissing hosuing booty):
Advertisement
If history is any guide, shareholders need not fear higher rates. Global equity markets have on average climbed 27 per cent during periods of rising US rates.
That piece of analysis comes from researchers at Societe Generale. And if true, investors should cheer a quarter percentage point lift by the Federal Reserve next week.
Those not convinced and keen to opt out now should keep in mind that the closing, glorious stages of bull markets have been painful to miss. Research by Bank of America-Merrill Lynch suggests that unless you can pinpoint the peak of the market within a 12-month timeframe, you are better off staying invested. That’s because some of the best returns come in the final stages of euphoria, with the gains “usually enough to offset the subsequent losses”.
Over 40 per cent of the total returns in a cycle are made in the final two years of a bull market, the analysts calculate. The lowest capital return achieved in the final 12 months of a bull market were also impressive at 11 per cent, with median returns of 21 per cent.
“These robust returns suggest the opportunity cost of selling too early is quite painful,” they point out. The gains of staying invested through the final yards of the bull run are “usually” enough to offset the subsequent losses.
But you do need to ask yourself – why will the market go up? It’s not because of higher bond yields, of course. Those serve to slow rather than hasten economic activity. No, it’s when rates are heading higher that profit growth is usually picking up at a much faster pace.
So far, we have the first but not the second.
This is a worry and will be a source of increasing stress to investors as we move into the new year, especially after the inauguration of the man investors have pinned their hopes on: US president-elect Donald Trump.
So far markets have expressed faith in the stimulatory impact of Trump’s planned tax cuts and infrastructure spending, and discounted the anti-growth measures such as trade tariffs and the mass expulsion of immigrants. There is no guarantee on this front, and the BoA-ML analysts agree that there is a not immaterial risk that economic growth in the US falls short of investors’ high hopes.
SG analyst Andrew Lapthorne, who provided that stat around global equity markets in rising US rate cycles, is worried that history is not about to repeat itself. He points out that American companies are ill-prepared to cope with a higher cost of debt. They’ve had years of enthusiastic borrowing at low rates to fund share buybacks that helped push share prices and, presumably, executive remuneration packages higher. That has left leverage levels high (see chart), and he believes it’s just a matter of time before the credit market wakes up to this ticking timebomb in corporate balance sheets.
Quite right and it will no doubt be one of the things that blows up when the Fed hikes one too many times at some point in the foreseeable future. But right now, with the weekend news from non-OPEC producers, and the US shale sector about to enter a new boom, it’s increasingly difficult to look past the US recovery story in the medium term, by which I mean a year or so out.
MB switched to selling rallies in equities right at the top, some 10% or so higher above where we are today on the ASX200. I still wouldn’t buy local shares. The mining rally is built on a Chinese forex bubble that could pop at any moment as authorities tighten.
Advertisement
However, the US rally may well have staying power through next year with:
Trumpism boosting sentiment;
Trump corporate tax cuts boosting profits 20-30%
shale entering boom II;
wage and wider inflation building from a low base.
Given I also expect a USD bull market, Aussie investors getting some exposure to that over 2017 seems a pretty good bet.
Advertisement
It looks overbought right now but buying the dips in the S&P500 through 2017 is sound.
David Llewellyn-Smith is Chief Strategist at the MB Fund and MB Super. David is the founding publisher and editor of MacroBusiness and was the founding publisher and global economy editor of The Diplomat, the Asia Pacific’s leading geo-politics and economics portal.
He is also a former gold trader and economic commentator at The Sydney Morning Herald, The Age, the ABC and Business Spectator. He is the co-author of The Great Crash of 2008 with Ross Garnaut and was the editor of the second Garnaut Climate Change Review.