Over the past year we have heard the argument over and over again from the Coalition and the property lobby that two-thirds of negative gearers earn below $80,000, hence negative gearing is primarily a middle class affair.
My standard counter argument is that the “taxable income” figures used by the Coalition and the Property lobby to perpetuate this myth is what is left after deductions like negative gearing have been applied. Hence, it is wrong to simply claim that those earning below $80,000 are the primary users of negative gearing, since their taxable incomes have been reduced by negative gearing.
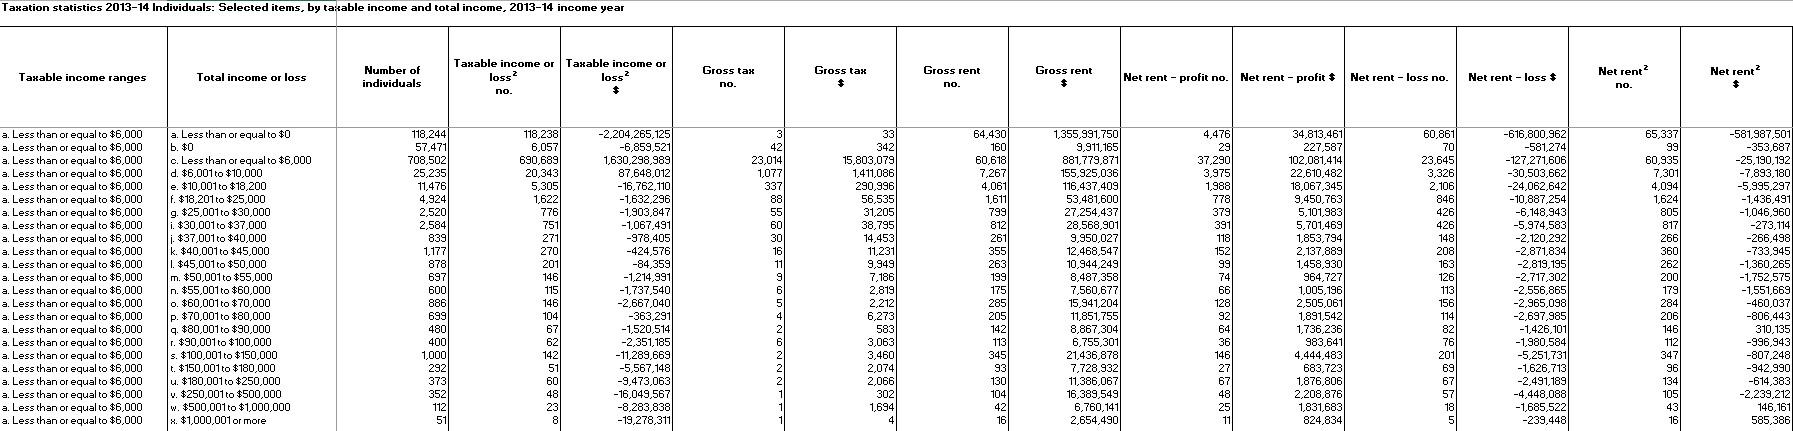
Today, Fairfax’s Peter Martin has shone a light on the problems with using “taxable income” for these types of analysis, noting that there were some 56 people that earned over one million dollars in total income that managed to reduce their taxable incomes by so much that they paid little or no tax:
Advertisement
Paying tax has become optional for 56 of Australia’s highest earners. Newly-released tax statistics show each of the 56 paid next to no income tax in 2013–14, not even the Medicare Levy, even though each earned more than $1 million…
Combined, the 56 earned $128.6 million, around $2.3 million each…
Each of the 56 managed to drive their taxable incomes down below the $18,200 tax-free threshold. Fifty-one managed to drive their taxable incomes down below $6000. Forty-three reported taxable incomes of zero. Eight reported combined losses of $19.3 million…
Another 117 high earners taking home between $500,000 and $1 million managed to drive their taxable incomes below the $18,200 tax-free threshold, paying no tax…
Another 2305 Australians earning between $100,000 and $500,000 succeeded in bringing their taxable incomes below the tax-free threshold in order to pay no tax.
The data that Peter Martin refers to is shown in all its hideous glory in the below ATO table (click twice to enlarge):
Advertisement
Note that many of these individuals also owned negatively geared investment properties.
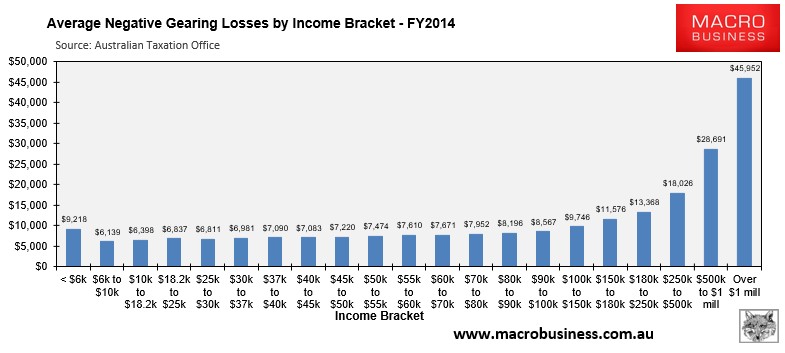
And for further proof of the ridiculousness of using “taxable income” for negative gearing analysis, check out the next chart showing the average negatively geared rental losses claimed by investors in each taxable income band:
Advertisement
According to the ATO, there were 93,309 people that earned less than $6,000 in “taxable income” that claimed an average negative gearing loss of $9,218!
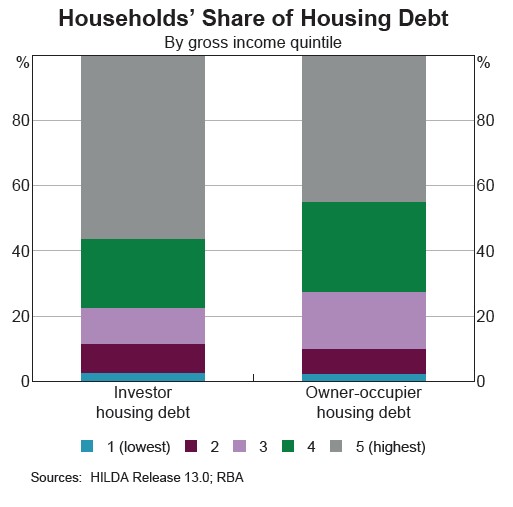
For these reasons, it is better to look at total income when comparing property investors for policy purposes. And this data shows that nearly 80% of investment property debt is held by the top 40% of income earners, according to the RBA:
While the incidence of property investment increases with the level of income, the Household, Income and Labour Dynamics in Australia (HILDA) Survey also suggests that most investor households are in the top two income quintiles. These households hold nearly 80 per cent of all investor housing debt…
Leith van Onselen is Chief Economist at the MB Fund and MB Super. He is also a co-founder of MacroBusiness.
Leith has previously worked at the Australian Treasury, Victorian Treasury and Goldman Sachs.