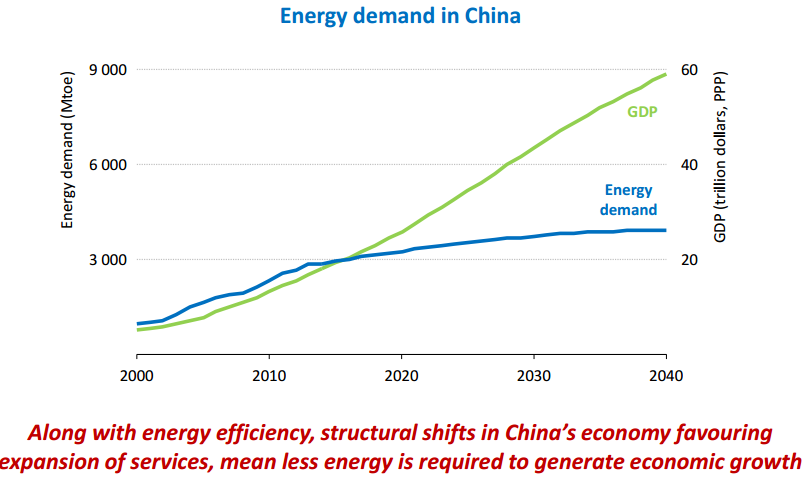
World energy demand grows in all WEO scenarios, but government policies play a powerful role in dictating the pace of the growth and the degree to which greenhouse-gas emissions follow the same path. In the New Policies Scenario (the central scenario), energy demand grows by nearly one-third between 2013 and 2040, with all of the net growth coming from non-OECD countries and OECD demand ending 3% lower. The links between global economic growth, energy demand and energy-related emissions weaken: some markets (such as China) undergo structural change in their economies, others reach a saturation point in demand for energy services, and all adopt more energy efficient technologies. As the largest source of global GHG emissions, the energy sector must be central to efforts to tackle climate change but, despite signs that a low-carbon transition is underway, energy-related CO2 emissions are projected to be 16% higher by 2040.
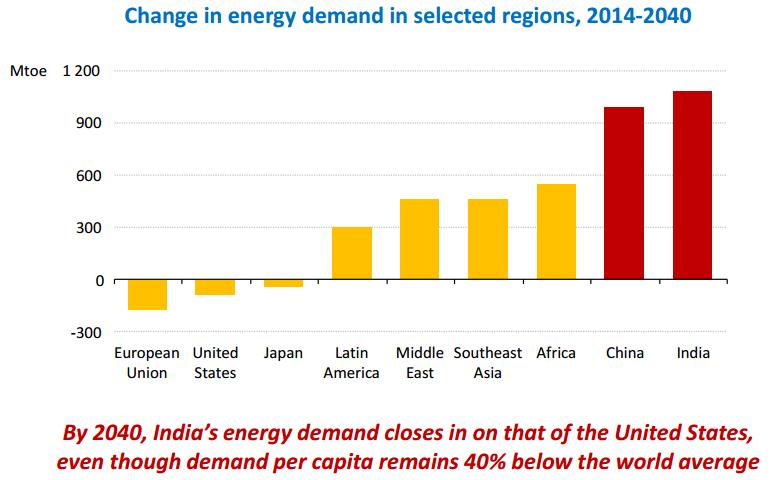
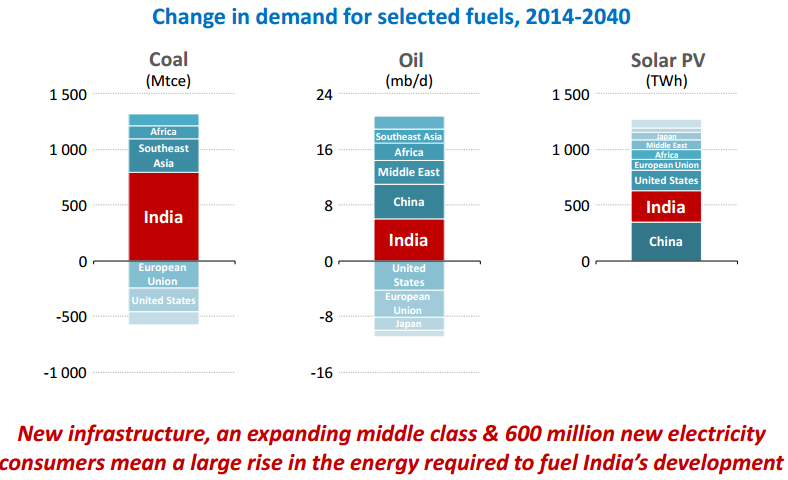
The single largest energy demand growth story of recent decades is near its end; coal use in China reaches a plateau, close to today’s levels, as the country’s economy rebalances and industrial coal demand falls. The largest oil consumer – the United States – experiences one of the world’s largest reductions in demand from 2013 to 2040 (along with the European Union), declining by around 4 million barrels per day (mb/d), and returning to levels last observed in the 1960s. Broad-based growth in global natural gas demand (up 47%) is led by China and the Middle East. By 2040, oil and coal collectively relinquish 9% of the global energy mix, with renewables growing by five percentage points and gas and nuclear each growing by two.
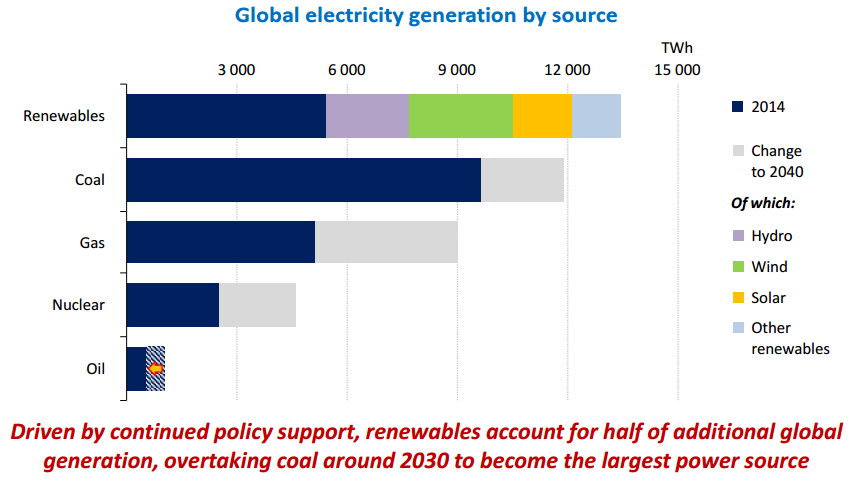
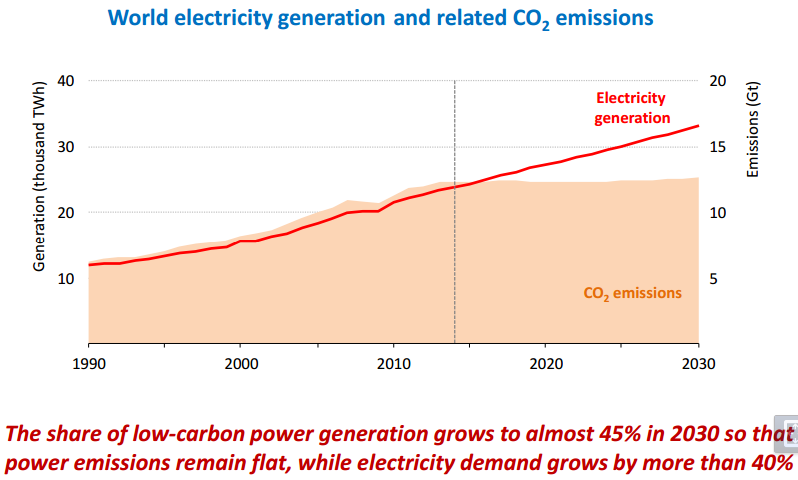
The world’s appetite for electricity lifts demand by more than 70% by 2040, and there is a concerted effort to reduce the environmental consequences of power generation. Renewables overtake coal as the largest source of electricity by the early-2030s and account for more than half of all growth over the period to 2040. Renewables-based generation reaches 50% in the European Union by 2040, around 30% in China and Japan, and above 25% in the United States and India. Coal’s share of total electricity generation drops to 30% in 2040, and the output from inefficient sub-critical plants declines by 45%. Around 550 million people in the world remain without any access to electricity in 2040 – the majority of them in sub-Saharan Africa.
The oil market is in unfamiliar territory: facing a well-supplied market and lower prices, producers have cut operating costs and investment plans. The absence of an OPEC production cut in response to lower oil prices shifted the onus of finding demand-supply equilibrium onto the broader market. In the New Policies Scenario, oil production grows by 12% from 2014, to over 100 mb/d in 2040, led by non-OPEC countries initially (to around 2020) and OPEC later on. Coal supply grew faster than any other major fuel in the last decade, but is the slowest-growing fuel in the decades to come, with global production increasing by around 10% by 2040. Lower natural gas prices are making it more challenging for those planning long-term investments in new capital-intensive projects. However, world natural gas production is not derailed in the longer term, and reaches nearly 5.2 trillion cubic metres (tcm) by 2040.
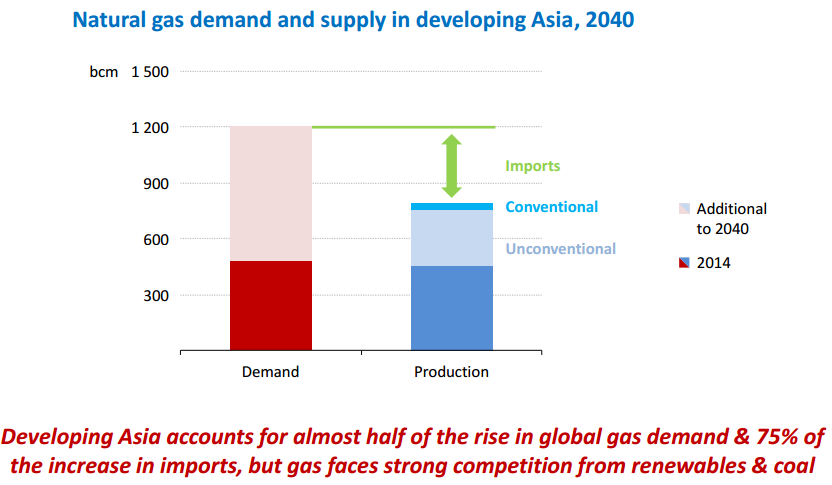
Energy trade relationships continue to be rewritten, with Asia the final destination for 80% of regionally traded coal, 75% of oil and 60% of natural gas in 2040. China becomes the world’s largest oil importer before 2020 and India the second-largest oil importer around 2035. Middle East oil exports accelerate after 2020 and natural gas exports rebound after 2025. North American natural gas exports are around 85 billion cubic metres (bcm) by 2025 and the region is self-sufficient in oil by the mid-2020s. Natural gas imports into the European Union grow by 30%, but sources of supply also diversify.
World energy sector investment totals $68 trillion from 2015 to 2040, of which 37% is in oil and gas supply, 29% in power supply and 32% in end-use efficiency. Of the power generation capacity investment in the New Policies Scenario, more than 60% goes to renewables, led by China, the European Union, the United States and India. While often less prominently discussed, energy efficiency investment (led by transport and the buildings sectors) is no less important in scale than other parts of the energy system.
Fossil-fuel subsidies were around $490 billion in 2014, but would have been $610 billion without reforms that have been enacted since 2009. Recent changes prove that fossil-fuel subsidy reform is possible: low oil prices give net importers the room to reform, and reinforce the need for exporters to do so. The energy sector and climate change in the run-up to COP21
The world is moving towards a crucial climate meeting in Paris in December 2015 (COP21). As the largest source of greenhouse-gas (GHG) emissions, the energy sector must be at the heart of global action to tackle climate change. In advance of the meeting, over 150 countries – representing 90% of global economic activity and nearly 90% of energy-related GHG emissions – have submitted pledges to reduce emissions. Around half of these submissions include explicit energy-focused targets, either alongside a GHG emissions target or as a stand-alone goal. The most common energy-related measures are those that target increased renewables deployment (40% of submissions) or improved energy efficiency (one-third of submissions).
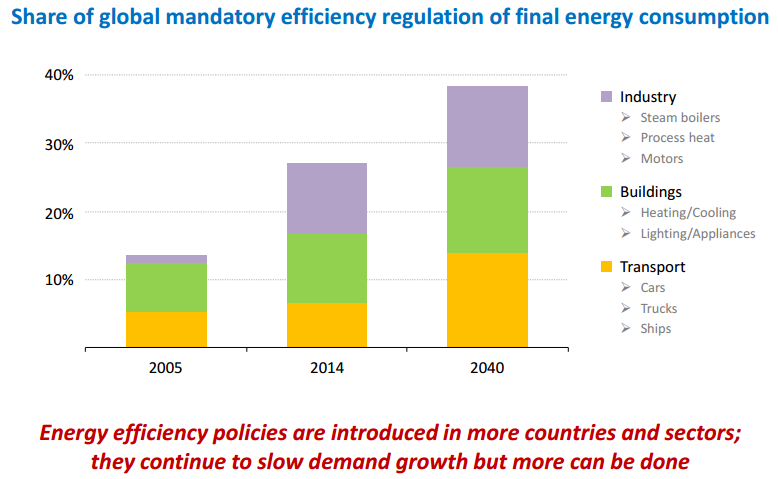
An energy sector transition is underway in many parts of the world. Policies to support the transition are increasingly being adopted, the US Clean Power Plan and China’s newly announced carbon trading scheme to take effect in 2017 being among the most recent. Supportive policies led to the installation of a recordhigh 130 GW of renewables capacity in the power sector in 2014; collectively, renewables secured their position as the second-largest source of electricity, behind coal. Energy efficiency improvements helped restrain the growth in final energy demand in 2014 to just one-third of the level it would otherwise have been. The coverage of energy efficiency regulations in industry, buildings and transport has nearly doubled, rising from 14% of the world’s energy consumption in 2005 to 27% in 2014.
In the New Policies Scenario (the central scenario of WEO-2015), the cautious implementation of new and announced policies, including the energy sector components of the climate pledges, supports the greater adoption of low-carbon technologies and improved energy efficiency. Energy demand grows at 1.0% per year to 2040, about half the average annual rate since 1990, thanks to increased energy efficiency in enduses and structural changes to the economy. The power sector decarbonises more quickly than ever before: CO2 emissions from power generation grow at only one-fifth the rate at which power output rises to 2040, breaking a longstanding one-for-one relationship. The deployment of renewables, which totals 3 600 GW from 2015-2040, is greater than for all other types of power plant combined as non-hydro (mostly wind and solar) become increasingly competitive.
Despite positive progress, efforts are not yet enough to move the world onto a pathway consistent with the 2 °C climate goal. In the New Policies Scenario, energy-related CO2 emissions increase to 36.7 Gt in 2040, 16% higher than in 2013. Having increased by 2.4% per year since 2000, these emissions are now projected to increase at the much more modest rate of 0.6% per year for the rest of this decade, and 0.5% per year in the 2020s and 2030s. Full implementation of the unconditional pledges made for COP21 by more than 150 countries by mid-October 2015 would require cumulative investment of $13.5 trillion in low carbon technologies and energy efficiency until 2030.
Lower oil prices require stronger policy efforts, so as not to hold back the energy sector transformation. Lower prices have facilitated some positive policy shifts, such as the reform to fossil-fuel consumption subsidies in India, Indonesia and elsewhere (global fossil-fuel subsidies were around $490 billion in 2014, but would have been around $610 billion without reforms enacted since 2009). However, if lower prices prevail for a prolonged period, they could discourage $800 billion of energy efficiency investments through to 2040. Without additional policy efforts, low oil prices could lock in a less efficient and less climate-friendly capital stock that leads to higher long-term emissions.
The energy sector in all countries can do more to restrain and reduce their GHG emissions. In Energy and Climate Change, a WEO special report released in June 2015, the IEA highlighted how just five energy sector measures (relying only on proven technologies and policies) could help achieve an early peak in total energy-related GHG emissions, at no net economic cost. These measures, which were presented as a “Bridge Strategy” and intended to be a bridge to further action, include: improving energy efficiency in the industry, buildings and transport sectors; phasing out the use of the least-efficient coal-fired power plants; further boosting investment in renewables-based power generation technologies (to $400 billion in 2030); gradually phasing out fossil fuel subsidies; and reducing methane emissions from oil and gas production.
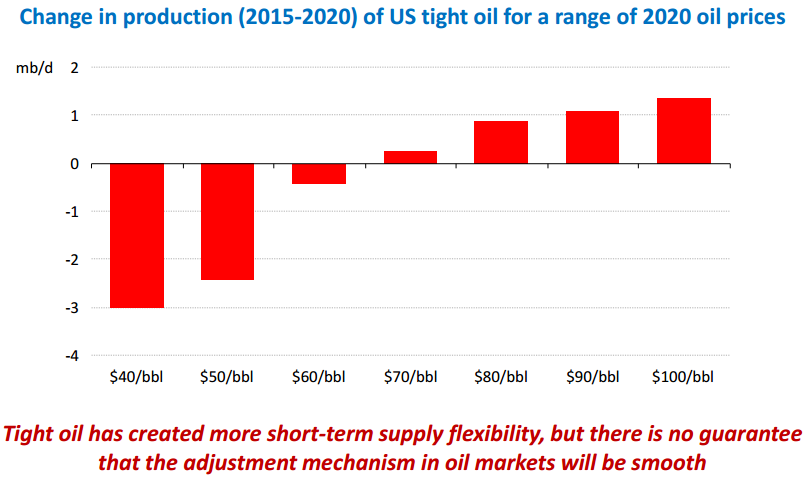
The plunge in oil prices has set in motion the forces that will lead the market to rebalance, via higher demand and lower growth in supply. This may take some time, as oil consumers are not reacting as quickly to changes in price as they have in the past. Although the rise of tight oil has created scope for more shortterm flexibility on the supply side, there is still a significant time lag in the response of most sources of production to a change in price.
In the New Polices Scenario, demand initially grows at an average of 900 kb/d per year until 2020, but this subsequently slows, with global demand reaching 103.5 mb/d in 2040, up nearly 13 mb/d on 2014 levels. By 2040 OECD consumption has fallen by 11 mb/d but this is almost exactly cancelled out by the twin pillars of demand growth: India and China (up 6 mb/d and 5 mb/d respectively). Elsewhere the Middle East sees oil demand climb by 3.5 mb/d, other non-OECD Asian countries by 2.7 mb/d, and Africa by 2.5 mb/d. The transport and petrochemicals sectors add 16.5 mb/d to 2040, offset only partially by slight reductions in the power sector and use in buildings. Oil demand for aviation grows faster than any other sector, with the industry’s goal of carbon-neutral growth post-2020 out of reach without offsets from other sectors.
OPEC’s decision to maintain its production target has forced non-OPEC producers into the front line of the market rebalancing. Cuts of more than 20% in upstream investment by many oil companies in 2015 have been compensated only in part by a fall in supplies and services costs. This negatively affects the mediumterm outlooks for production from numerous non-OPEC countries, including Brazil, Russia and Canada. Within OPEC, output growth is led by Iraq and Iran, although both face distinct challenges to mobilise the necessary investment. The possibility of sanctions relief in Iran raises long-term projected output up to 5.4 mb/d, while Iraqi production more than doubles to nearly 8 mb/d by 2040.
The short investment cycle of US tight oil and its ability to respond quickly to price signals are changing the way that the oil market operates. The plunge in prices means US tight oil production is now stumbling: if prices out to 2020 remain under $60/bbl, without a rapid evolution in drilling efficiency and technology learning, tight oil production in the United States will likely see a substantial decline in output. However, with tighter markets leading to higher mid-term prices in the New Policies Scenario ($80/bbl in 2020) US tight oil ultimately resumes its upward march, growing by 1.5 mb/d by 2020 to over 5 mb/d.
But the prospect of oil prices remaining low for an extended period cannot be ruled out. In the Low Oil Price Scenario, a new oil market equilibrium emerges at prices in a $50-60/bbl range that last until well into the 2020s before edging higher to $85/bbl in 2040. Key assumptions to bring this scenario about are: sluggish near-term economic growth; a stable Middle East in which key producers look to increase their share of the market; and resilient performance from key non-OPEC producers, particularly US tight oil.
Lower prices stimulate oil use and diminish the case for efficiency investments and switching to alternative fuels. In the Low Oil Price Scenario, demand is pushed up to over 107 mb/d by 2040, nearly 4 mb/d higher than in the New Policies Scenario, with most of the incremental demand coming from transport. While oil consumers and importers benefit economically, the consequent rise in dependence on supply from the Middle East may raise concerns over oil security. Oil producers and exporters are worse off, as the volume gains from higher output are more than offset by the effect of lower prices. Some $800 billion in energy efficiency investments from the New Policies Scenario fail to materialise over the period to 2040. Without additional policy efforts, low oil prices could lock in a less efficient and less climate-friendly capital stock that leads to higher long-term emissions.
The strains that the sustained low price would put on the fiscal balances of key OPEC producers make a Low Oil Price Scenario look increasingly unlikely the further it is extended into the future. By stimulating demand and choking off supply, the Low Oil Price Scenario ultimately contains the seeds of its own demise: indeed, the longer the oil price remains low, the greater the risk of a marked correction and large price upswing in the future.
Interfax has a summation of the coal and gas implications:
“The Energy Outlooks often headline the more politically relevant elements of their reports – this year it is COP21, while last year security of supply issues dominated because of the tensions between Russia and Ukraine,” Nick White, principal consultant at MGM Energy, toldInterfax.
With climate change high on the political agenda and European IOCs pushing for carbon pricing, the IEA has pared back its predictions for fossil fuel growth.
Global coal consumption will grow by 10% to 2040, according to the outlook. This is 5% less than the IEA forecast last year and is the biggest reduction in fossil fuel growth in the report. Coal’s share of the global electricity mix is set to fall from 41% at present to 30% in 2040.
Global oil consumption is expected to hit 103.5 million barrels per day in 2040, a drop of just 500,000 barrels per day from the 2014 report. Despite the low price, demand is subdued and the current glut will only be absorbed by 2020, by which time the price will be $80 per barrel, according to the IEA. The agency has suggested oil prices could stay lower for longer, but that this scenario is ultimately limited by the ability of OPEC members to sustain low oil prices without being destabilised.
The outlook for gas was revised down from growth of “more than half” in 2014, to “almost 50%” in the 2015 report. Growth of 50% is equivalent to global gas consumption of around 5 trillion cubic metres in 2040 and is not dissimilar to the agency’s forecast of 5.1 tcm by 2035 in its Golden Age of Gas special report in 2011.
The outlook is bullish on renewables, where the IEA expects capacity to grow by 8.3 PW. This would be more than half of the increase in total power generation capacity to 2040 and more than estimated by the IEA last year.
The fact that gas prices are linked to oil puts gas at a disadvantage, according to White. Under low oil prices it is difficult to justify investment in expensive gas transport infrastructure, while high prices leave gas uncompetitive with coal in the power sector.
Gas must ultimately decouple from oil prices and needs carbon pricing to ensure demand growth, according to analysts.
“On gas, although the observation is made that growth is the strongest of all the fossil fuels, there is little evidence in the specifics to support this,” Howard Rogers, director of the natural gas research programme at the Oxford Institute for Energy Studies, told Interfax.
“If COP21 fails to establish a global carbon price […] countries will continue to grow coal consumption rapidly, but may atone for this ‘sin’ by paying for renewables, [although] at a pace and scale too slow to be effective,” Rogers added.
The global energy mix forecast by the IEA would put the world on a path for more than 2C warming and the outlook suggests COP21 would need to establish a framework to secure stronger commitments to reduce greenhouse gases.
Gas faces competition not only from other fossil fuels, but also from renewable technologies.
“The expensive cost of gas conversion and transportation of LNG for export means this fuel source is under threat in a world of continued technological and cost improvements in renewable energy and energy efficiency,” Tim Buckley, director of energy finance studies in Australasia for the Institute of Energy Economics and Financial Analysis, told Interfax.
Advertisement
That’s my reading of the document, a bar-belled energy future of worse and better with India driving a lot of both. That leaves Australia struggling because we bet on the middle with higher quality coal and transitional gas.
If I were to add my own forecasts I’d say that the IEA is too bullish on the Chinese and India growth outlooks and therefore energy demand, which will be less strong than it assumes. That will lower carbon output but also slow the transition to lower carbon energies as a decades long market share battle rages around low prices. In that environment policy choices will be the swing factor.
Of course this is a subject so enormous that these are no more than policy guides. But that is the WEO outlook’s most important contribution. It is adding momentum to the de-carbonisation movement in a significant way and Australia remains poorly positioned for that.
David Llewellyn-Smith is Chief Strategist at the MB Fund and MB Super. David is the founding publisher and editor of MacroBusiness and was the founding publisher and global economy editor of The Diplomat, the Asia Pacific's leading geo-politics and economics portal.
He is also a former gold trader and economic commentator at The Sydney Morning Herald, The Age, the ABC and Business Spectator. He is the co-author of The Great Crash of 2008 with Ross Garnaut and was the editor of the second Garnaut Climate Change Review.