
Welcome to MB’s penultimate special report for 2014. It is for paid subscribers (not trialees) so get yourself a sub today and Merry Christmas!
——————————————————-
Six years on from the Global Financial Crisis (GFC), the global business cycle is slowly putting some distance between itself and a brush with depression. Europe has stabilised at low levels of growth. The United States is building upon its deleveraging and energy revolution to be reaching for almost “normal” levels of output. China, which powered much of the globe for the first few years out of the crisis, has embarked upon its own transformation, from export and building dynamo, to innovation, services and consumption powerhouse.
Things could have been far worse for the world.
The recovery can perhaps be most easily understood as developing in two phases. The first was characterised by massive monetary intervention and a bond bull market in the US (and Europe once it worked out that was it’s only course). In the emerging markets, the opposite was the case, with China driving an equally large investment and building boom which authorities spent much of their time trying to rein in once it was unleashed. Thus interest rates rose across emerging market economies even as they fell in the West, until late 2011.
The second phase began in 2012 when China and emerging economy tightening succeeded in slowing their economies and they began to loosen policy slowly. Fortuitously, this coincided with better recovery in the US (and later Europe), driven by some releveraging and the US shale oil revolution. Bond yields began to rise in anticipation of interest rates coming off their super low levels.
Australia’s economy has tracked these larger phases. It weathered the GFC storm remarkably well and prospered in the first phase of the global recovery as Chinese building boomed. The flow-on commodity price spikes affected just about everything. In its early phases it was the bulk commodities of coal and iron ore that surged. Later, it was soft commodities that took flight. And finally, it was gas and LNG exports that rose powerfully.
After 2011, Australia’s fortunes changed as China slowed. The prices for all of its key commodity exports began to fall and growth began to struggle. Local interest rates fell and so did the Australian dollar, slowly. Housing took off but hasn’t managed to offset the commodity price downdraft.
This arm-wrestle will determine what lies ahead for the Australian economy and assets.
The mining “super cycle”
To understand how the two phases of global recovery will play out for the next few years in Australia, we need to look at the two halves of resources versus housing in greater detail.
A commodities boom so large and enduring as the one we’ve just lived through – a super cycle – requires unique circumstances. Most commodity booms of the past – be it the 1890s gold rushes or the 1970s Japanese construction bubble – are built upon large demand shocks as new economies enter the global trading system.
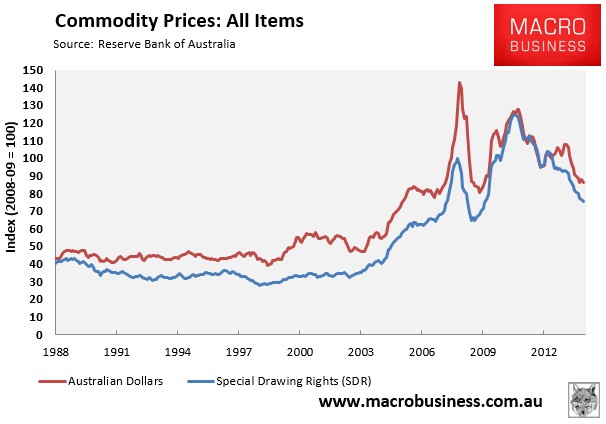
That was the case again this time, with the exceptional rise of Chinese development in the early millennium adding 300 million new consumers to the global economy in record time. As they urbanised, new dwellings, commercial centres, buildings and infrastructure required enormous quantities of raw materials and energy. Commodity markets are inelastic – they take time to respond – so a demand shock results in rising prices:
The fundamentals of supply and demand were only the the first leg of the boom. What made this commodities price spike unique, uniquely huge that is, were two subsequent drivers.
The first was the accelerated decline of the US economy post-GFC. That may seem counter-intuitive but a weak US economy meant very accommodative monetary policy and therefore a falling US dollar, and because the US dollar is one half of 95% of global currency transactions, and commodities are priced in US dollars, that added a monetary tailwind to commodities.
Never one to miss out on leveraging a good story, global markets seized upon the trend to produce the second unusual dimension to the commodity price boom, financialisation. Under pressure from US regulators to reduce returns in traditional banking activities following the GFC, banks turned to commodity trading as an offset, introducing all manner of derivative products designed to enable investors to join the commodities rush.
Most of these products – whether ETFs, funds or futures – were nothing more than hoarding strategies dressed up in virtual new clothes. They pulled commodities off the market in the hope of higher futures prices and capital gains. It was a self-fulfilling super-cycle of hunger for “real assets” that drove prices mad.
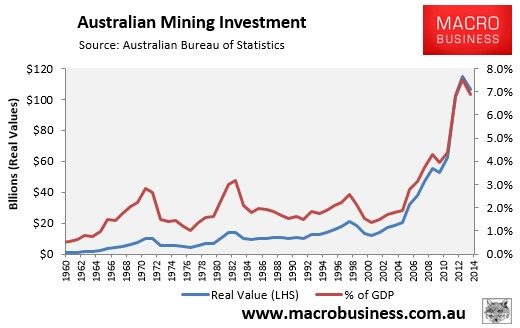
However, capitalism is not so easily duped. As any kindergarten economist can tell you, higher prices always provoke a supply response, and prices were so high for so long, that the response proved to be of an epic magnitude. It happened globally, but in Australia’s case investment in supply for iron ore, coal, gold and LNG headed for the moon:
The boom reverses
It was thought by many Australian officials, miners and markets that this commodity “super cycle” was a permanently high plateau for prices. The argument was based on the notion that China had decades yet to urbanise and so elites urged the nation to embrace “structural change” in the economy to a higher resources dependency.
That has proven to be a fateful mistake as the world moves into the second phase of post-GFC recovery. China’s post-GFC growth was driven in some large part by capital mis-allocation, resulting in phenomenal oversupply in areas of real estate, very high risk growth in shadow banking, a collapse in productivity growth and now a push by authorities to rebalance the economic structure away from building towards innovation, consumption and services, to prevent a debt crisis. The days of China’s super-charged GDP growth are unexpectedly over.
All of these trends are very obvious in its primary growth drivers:
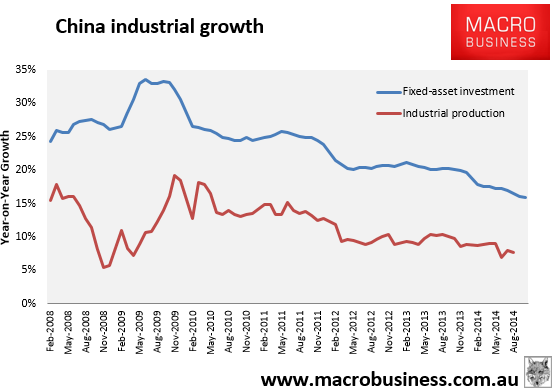
The result then is that global capitalism has responded to towering commodity prices with a massive supply surge just as China has slowed unexpectedly and will continue to do so, especially in those areas of the economy that are commodity-intensive. As result, massive oversupply has appeared in coal, iron ore and oil markets.
For Australia that has meant big price falls in all of its key commodity exports since late 2011, with iron ore down 63%, thermal coal down 68%, coking coal down 63% and LNG down 48%.
But that’s not the end of the story. Prices are still falling in all commodities except coking coal and the two most important – iron ore and LNG – are both headed for much greater falls yet as oversupply has only just arrived and will get much worse.
The production surpluses in the two coals that have driven down prices by two-thirds are around 7-8% of the total seaborne market. That’s also roughly the size of the current iron ore surplus. But the iron ore production boom has another three years to run and the prospective surplus is huge:
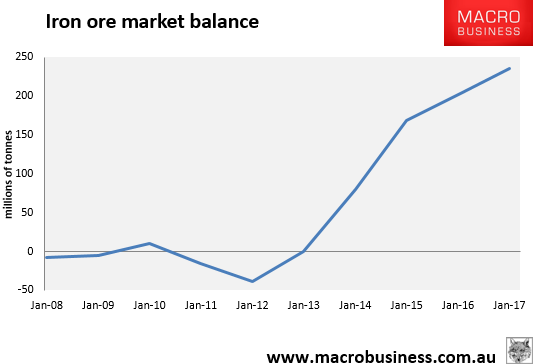
The surplus to come in seaborne iron ore is double or triple that of the two coals. No commodity has tested these extremes of oversupply in recent years. High-cost Chinese and international production will close to balance the market but not quickly enough to prevent further deep price falls.
That should not really surprise anyone. The one hundred year history of real iron ore prices shows that $US60 is the average and it has spent long periods well beneath that, especially after booms in the 1890s, 1930s and 1970s:
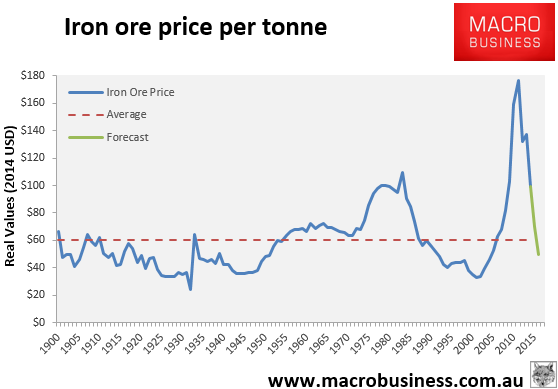
At MB we would very much like to believe that this time it is different but sadly we cannot. Iron ore is not going to bottom until below $US50, most likely sometime in 2016 and it probably won’t rise much from there for many years.
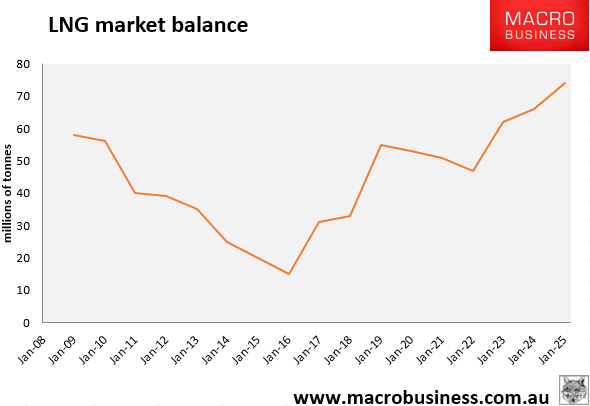
The story for LNG is similar if less dire with it riding a wave of global supply growth for gas, coming from the US, Russia, Africa and Australia:
The price falls have begun but are likely to be deeper yet:
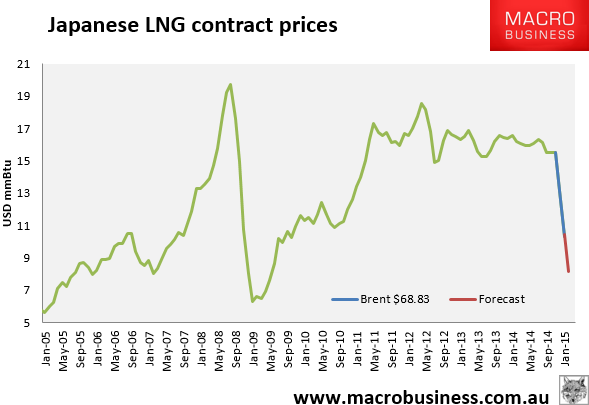
Though most LNG is sold on oil-linked contracts, that is unlikely to provide much protection. Energy is energy and the rise of one source displaces another. For instance, much of the Australian LNG boom is linked to the global surge in unconventional oil and gas supply that is already causing oil price carnage.
So, as iron ore and LNG show, the supply response and a slowing China are already punishing commodity prices. What about the other two dimensions of the super cycle: the US dollar and financialisation?
Looking at the second first, we find that the boom in financial commodity hoarding peaked at roughly the same time as Chinese growth and has been declining ever since:
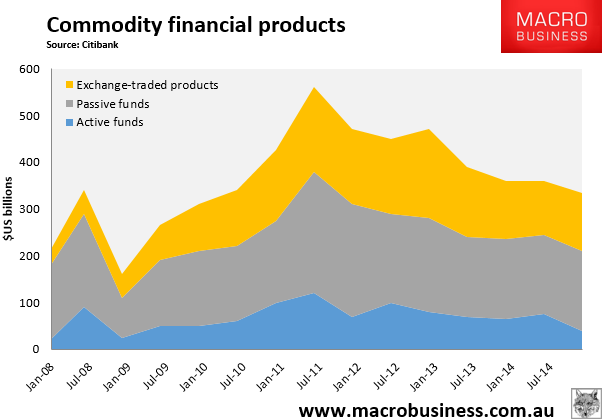
It has dawned on investors that commodities are not much of an asset class for the long term given no yield, and once the cycle turns the exit looks pretty good. As well, moving with admirable haste, US regulators have shoved banks out of the commodities trade owing to the balance sheet risk that commodity hoarding entailed. We can therefore expect the trend in the de-financialisation of commodities to continue.
As for the US dollar, the embarkation upon the second phase of the post-GFC global economic recovery has shifted that currency into a secular bull market, simultaneously supported by superior US economic prospects and monetary easing everywhere else:
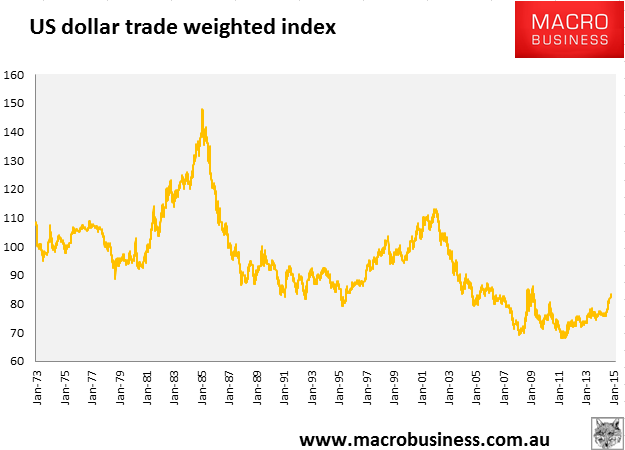
A huge double bottom is in place, the bull is running, and there is plenty of room for upside before applying any competitive squeeze to the US economy!
In summary, then, we can say with relative confidence that the three main drivers of the commodity super cycle – real, monetary and financial – are all in full reverse and could run backwards for a lot longer than most prognosticators expect. Just as the boom did, so will the bust.
The upside of falling commodities
One more dimension of the the second phase of the global post-GFC recovery is important. It is the case that US bond yields have been rising in anticipation of interest rate rises. But the process has been slow and halting and is likely to continue to be so. The reason is that the end of the commodity super cycle delivers one other dividend to Western and other commodity consuming economies: disinflation.
Lower input costs and oil prices take the pressure of costs for both firms and consumers and are effectively a wealth transfer from commodity producers to households and manufacturers.
Although US growth is likely to benefit from lower commodity prices, outside of shale oil production, its central bank will be in no hurry to raise interest rates given already low inflation is likely to remain very subdued.
This, in turn, will fuel the US stock market in the continuation of one of its greatest bull markets. It is likely to be able to run on an improved consumer and abundant liquidity for several years yet, probably until it reaches bubble-like valuations. Both Nouriel Roubini and Jeremy Grantham reckon on this course and do not see the denouement until late 2016 following the US presidential election. Perhaps as what rate rises there are finally bite, or possibly if the debt underpinning the US shale boom comes-a-cropper.
Australia enters the dark side of the boom
But that bullish US cycle is unlikely to benefit Australia much. We’re a commodity producer not consumer and on the wrong end of the second phase of post-GFC global recovery.
The significant falls in commodity prices since late-2011 are already weighing on national disposable income (NDI) growth, which has been declining in the face of rising GDP (see next chart).
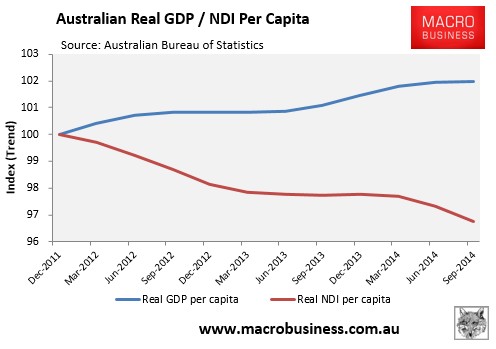
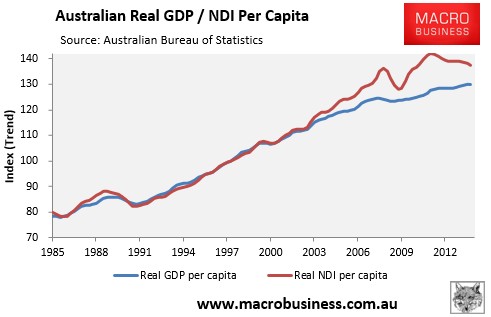
Essentially, after growing at nearly twice the pace of output, as measured by GDP, between September 2003 and December 2011, the blue line (real GDP per capita) and red line (real NDI per capita) below are converging, which means a protracted period of anaemic (if any) income growth for the Australian economy:
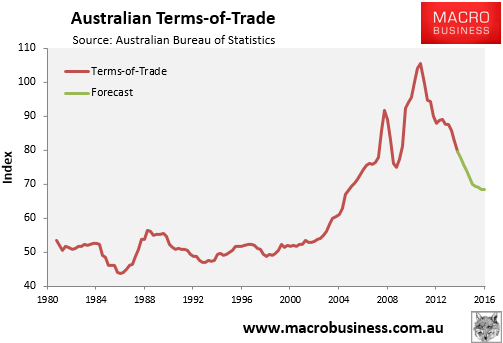
The rot is unlikely to stop until both GDP and NDI are once again in unison, or until Australia’s terms-of-trade retraces enough. MB does not expect a full reversion to historic averages for the terms of trade given ongoing high demand for consumption goods and soft commodities but there’s more than enough downside ahead for deeper income falls:
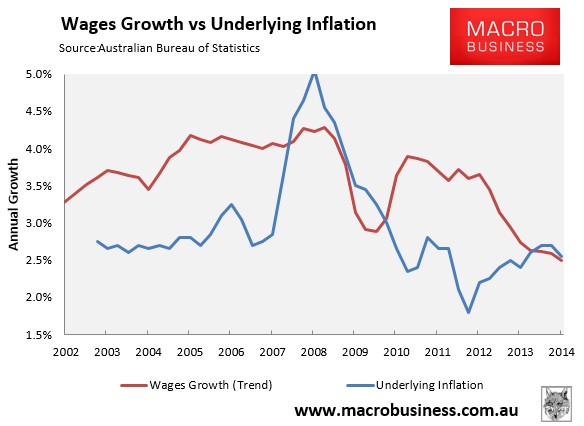
Already, the declining terms-of-trade has had a deleterious impact on Australian households. The Australian Bureau of Statistics’ (ABS) labour price index revealed that wages growth is running at the lowest level on record (1997), with wages nationally increasing by just 2.5% in the year to September 2014, slightly below the rate of underlying inflation (see next chart).
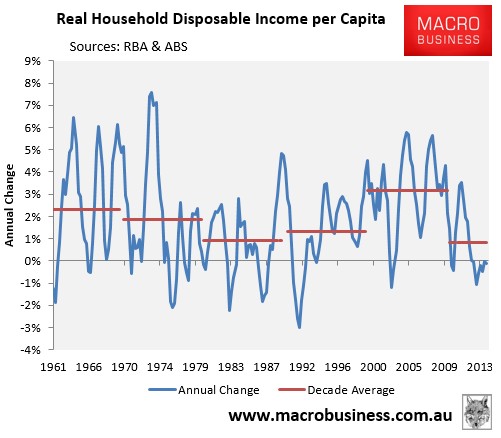
Similarly, after surging during the 2000’s commodity boom, whereby real per capita household incomes grew by 3.2% per annum on average, household income growth this decade has slowed to the slowest pace in 60 years, averaging just 0.8% per annum (see next chart).
The income shock is nothing, however, compared with the disorderly unwinding of the mining investment boom, which is set to take a sledgehammer to employment.
As shown in the earlier mining investment chart, the surge in mining investment from the mid-2000s was unprecedented, dwarfing the 1970s and 1980s booms. From a long-run average of around 2% of GDP, mining investment hit a peak of 7.5% of GDP in June 2013, and was tracking at 6.9% of GDP as at June 2014. Moreover, around half of this investment spike occurred in the three years to June 2013.
The latest Bureau of Resource and Energy Economics (BREE) update on the pipeline of major Australian resource projects painted a bleak picture for future mining investment, with the current stock of resources projects all but exhausted by 2017 (see next chart).

In MB’s view, most of the projects labelled as “likely” and “possible” by BREE are in fact “heroic” and “a nice idea”: how many resources companies are likely to commit new money amid gluts and falling prices for iron ore, coal and petroleum (gas)? These three make up three-quarters of BREE’s prospective projects.
Rather, once the current pipeline of projects are exhausted in 2017, MB sees mining investment retracing to around 1% of GDP – as was the case after the 1970s boom – as investment undershoots the long-run average.
While output (GDP) will be supported as rising commodity exports offset reduced investment, the implications for employment are highly unfavourable.
According to Reserve Bank of Australia estimates, the mining sector accounted for nearly 10% of Australian employment in 2011, with two-thirds of these jobs in areas directly related to mining capital investment, such as construction workers, engineers, and other mining services. As resources projects are completed, much of the labour utilised during the construction phase will no longer be required, leading to a material increase in unemployment unless other areas of the economy can expand sufficiently to fill the void.
Indeed, to get a sense of the employment shift that will take place, as well as the likely impact on mining communities, one only needs to consider the outline of jobs at Gladstone’s three $70 billion-plus LNG plants, which are currently under construction and are due for completion over the next 18 months where direct construction jobs across the three projects number around 10,000.
Once the projects are completed, and the LNG plants move into the operational phase, then only 420 employees are expected to be required. That’s a reduction in direct jobs of around 95%, not to mention the loss of jobs in functions peripheral to construction (e.g. engineers and mining services in our capital cities), as well as those indirectly affected (e.g. services staff in Gladstone), which will multiply the losses.
Add in similar types of declines across Western Australia (e.g. Gorgon LNG, Wheatstone LNG and the Roy Hill iron ore mine) and the Northern Territory (Ichthys LNG), and you have the ingredients for a major employment shock that will gather strength from mid-2015 and run right through 2016 and 2017.
The total number of mining jobs likely to disappear from the 2011 peak is in the vicinity of 100,000. Add in multipliers to other industries and that figure could double.
A hamstrung “rebalancing”
Normally, such a mining bust would be accompanied by a major rebalancing of growth drivers in the economy as both interest rates and the currency fall. Similar is underway this time around.
However, there are two major inhibitors to a successful rebalancing in this cycle which have not been present before. The first is that the high Australian dollar has weighed very heavily for a long time on non-mining tradable sectors. Both import-competing and export industries have been hollowed out. It will be very time consuming and costly to rebuild them.
The most obvious example of this is the closure of Australia’s automotive assembly industry, whereby all three major car makers have scheduled to exit the country by the beginning of 2017.
Modelling by the Productivity Commission estimated that the closure of Australia’s car industry would cost up to 40,000 jobs, mostly in Victoria and South Australia. The Commission’s findings were broadly similar to modelling undertaken late last year by the Allen Consulting Group, using economic analysis from Monash University, which estimated that the closure of the local car industry would cost around 33,000 jobs in Melbourne and around 6,600 jobs in Adelaide by 2018.
Both studies appear optimistic, however, given they assume that a high proportion of component manufacturers will move into exports and/or the after-sales parts market, which are already crowded and highly competitive. The PC also assumed that two thirds of the expected 40,000 retrenched auto workers will find another job – an assumption that seems heroic given the lack of other manufacturing industries in Australia, the sheer size of the employment shock (alongside the sharp decline of mining investment), and the overall weakening labour market.
The job losses have already started and will accelerate throughout 2015 and 2016, adding to the mining job shock.
The second, and perhaps more important, inhibitor to rebalancing is high household debt. So far, the Reserve Bank has sought to “rebalance” the economy away from mining via engineering a housing “boom” – essentially increasing housing and consumer spending via the “wealth effect” from rising home values.
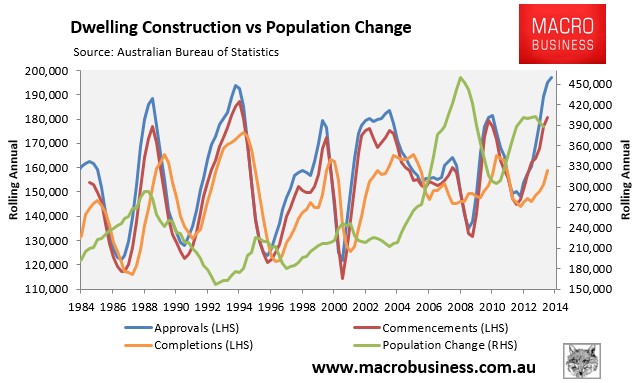
To date, this approach has worked to a limited degree, with housing construction levels running near record highs (but less favourably in population-adjusted terms) and household consumption expenditure, such as via retail sales, growing solidly.
However, housing remains hopelessly outgunned in its capacity to offset mining investment’s decline. As illustrated in the next chart, mining construction is at least 10% larger than housing construction. We say at least, because some mining-related activities – such as railway construction – is not counted in the below chart, which only captures direct expenditures on mines and pipelines:
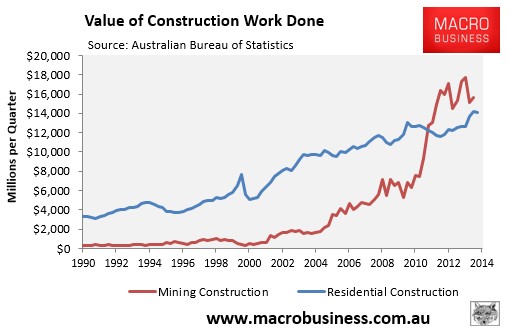
Moreover, as shown above, the rate of change for mining investment makes it impossible for housing construction to “fill the void” as mining investment literally crashes in the period ahead.
As well, the housing price and construction boom already appears to be running out of steam, and by our estimates will enter a downturn in 2016 (if not sooner), weighing on both jobs and growth as the mining purge gathers pace.
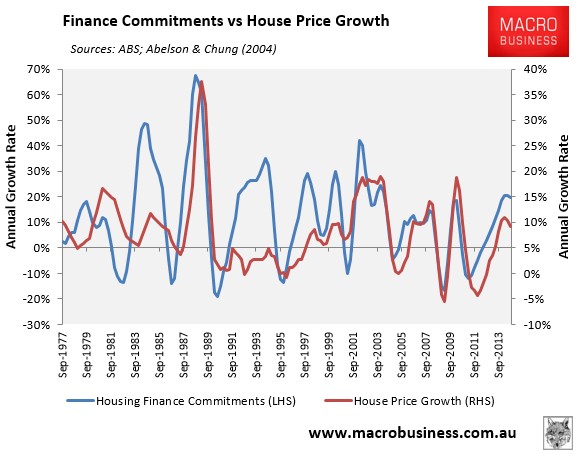
As shown in the next chart, annual house price and mortgage credit growth is past its peak, which given past experience, suggests values may only have another year of growth before they begin heading south:
In a similar vein, dwelling approvals appear to be peaking, which along with falling population growth suggests that construction levels will turn down within the next year or so:
Despite authorities’ best efforts to unleash a multi-year housing boom, Australian households are unwilling and unable to participate as widely as they have done in previous housing cycles. The boom is therefore unusually narrow, mostly confined to Sydney and Melbourne, and driven by a very limited segment of housing investors, with first home buyers largely absent.
What is preventing a longer, wider and more sustained boom is record high levels of mortgage debt:
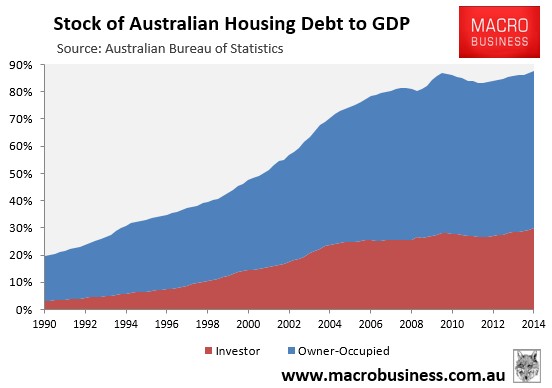
The narrowness of the boom is now creating its own set of problems as credit to the investors bidding up prices with one another swiftly takes on the characteristics of a credit bubble with over-extension in high-risk loans such as zero-interest, the very kind of lending that blew up the US housing bubble.
Authorities’ are thus being forced to move to contain these risks even though doing so will slow the very boom they have stoked. The Murray Inquiry, the Foreign Investment in Real Estate Inquiry and moves by the Australian Prudential Regulatory Authority (APRA) to introduce macroprudential tightening, will all slow the boom more swiftly than otherwise, leaving the labour market shock to run further and with less growth offsets than would normally be the case at this stage of the cycle.
Three supports
That is not to say that no policy support will be forthcoming as mining implodes, tradable sectors struggle and housing fades. After a year or more of Reserve Bank of Australia dithering, interest rates are now likely to fall by 50bps points in the first half of 2015. That will help offset new rules around foreign property buying and macroprudential tightening, and it will lower the Australian dollar further helping boost the low-hanging fruit of tradable sectors like tourism and education, softening the income shock. It will also help household consumption via lower debt-servicing costs.
Moving into 2016, MB expects interest rates will fall by another 50bps to 1.5%, close to as low as they can go given the need to fund the current account deficit. By late 2015, then, MB expects the Australian dollar to be trading at 70 cents and by late 2016 to be at 60 cents.
Fiscal support is also building. The federal fiscal tightening of last May is now history. What started as a tight Budget is swiftly becoming very loose as various reforms are turned back by a hostile senate. MB expects this process to continue but the Coalition Government is unlikely to roll over completely given its mandate to repair the Budget over time so another tightish Budget is probable in May 2015.
At the state level, all Coalition governments are aiming for surpluses and will continue to do so.
Moving into 2016, Abbott Government road building and other infrastructure initiatives will begin to flow through. But, given the degree of political dysfunction and policy ineptitude on display, these projects are likely to arrive haltingly and without much productive impact.
Still, they will help boost short term activity via construction as both mining and housing diminish. Perhaps 1% of GDP can be expected in 2016 and 2017, a useful contribution to a capex starved economy.
However, there will be a price to pay for this “fiscal bleed” strategy. The AAA sovereign rating depends upon government demonstrating a clear path to surplus across the cycle. That is what reduces the public debt stock to GDP ratio, which is the measure that the rating agencies monitor for balance sheet strength.
Standard and Poors has openly declared that Australia’s net general government debt to GDP ratio must not breach 30% if the AAA is to be retained. The ratio currently stands at 21% and with fiscal bleeding necessary to support economic growth over the next two years, there will be little improvement in the ratio:
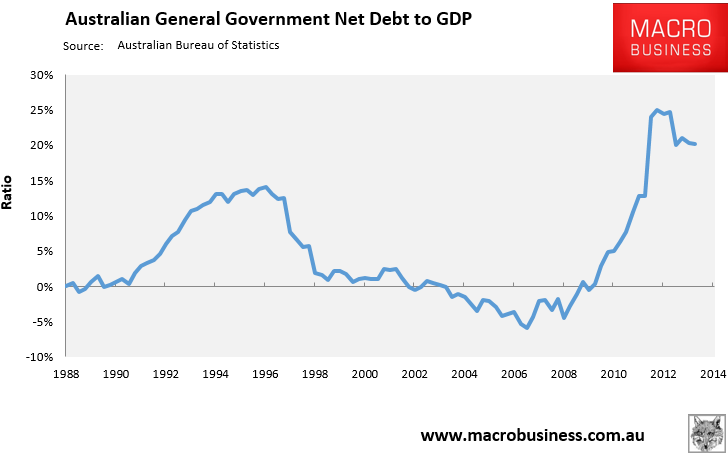
That leaves the economy very vulnerable to the next global shock (perhaps in 2016/17). A little fiscal stimulus combined with automatic stabilisers will send deficits through the roof (see the GFC period in the above chart), the 30% ratio will be ruptured quickly and the AAA be stripped.
Because the government balance sheet guarantees the major bank’s offshore funding, they too will be downgraded. Australia’s cost of funds will rise just as it runs out of scope for monetary and fiscal policy easing.
Conclusions for Australia
After 23 years of almost uninterrupted growth, the Australian economy is at the cross-roads. The duel commodity price and mining investment booms that have defined the economy over the past decade are unwinding, which is already placing pressure on national income and will soon lead to widespread job losses as mining mega projects are completed over the next 18 months.
Meanwhile, the biggest player in the manufacturing industry – the automotive assembly industry – is scheduled to close by 2017, which will conservatively see a forecast 40,000 workers lose their jobs, mostly across Victoria and South Australia over the next two years.
The great white hope for the Australian economy – the housing boom – is already long in the tooth. House price growth is past its peak and authorities are moving to contain high-risk debt – via macroprudential and foreign buyer restrictions – which will likely see values turn negative from 2016. Similarly, housing approvals are nearing their peak which, given the usual lags between approvals and construction, could see the rate of dwelling construction turn negative from late-2015.
Policy support will continue, with falling interest rates and larger Budget deficits, which should help keep households afloat through lower debt servicing costs and prevent an even worse situation developing in the labour market. However, we are swiftly using up our available policy-support ammunition, and when the next global shock arrives (at a wild guess in late 2016) Australia will have very few rate cuts left and a Budget already on the verge of losing the AAA sovereign rating.
Put simply, the economy is facing storm clouds on multiple fronts, which will likely hit with progressing severity over 2015, 2016 and 2017. We believe now is the time to position for the correction, be it by selling surplus properties, buying put options (insurance) against financial assets, diversifying investment portfolios into international assets, or simply paying down debt.
If Australia has a little bad luck in the next few years (we’re probably due!) and the many difficult adjustments described above converge unfavourably (a strong risk case), then historians will need to look much further back than 1991 for apposite comparisons.