Demographia’s Wendall Cox has produced an interesting report in New Geography drawing on satellite navigation data from Tom Tom (called the Tom Tom Traffic Index) to determine which regions have the worst traffic congestion. Under the Tom Tom Traffic Index methodology:
…travel times during non-congested periods (free flow) [are compared] with travel times in peak hours. The difference is expressed as a percentage increase in travel time. We take into account local roads, arterials and highways. All data is based on actual GPS based measurements and for each city the sample size is expressed in total number of measured kilometres for the period.
Advertisement
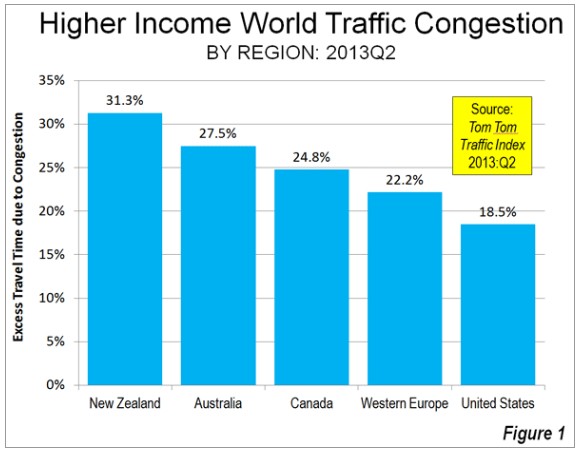
According to Cox, New Zealand has the worst traffic congestion in the five regions surveyed, with Australia coming in second. The United States, by contrast, suffers from the least congestion, with cities operating liberal land supply/planning policies fairing the best:
Tom Tom produced data for 122 urban areas in the higher income United States, Western Europe, Canada, Australia and New Zealand. This included nearly all urban areas with more than 1,000,000 population, and some smaller. It might be expected that the “sprawl” of US urban areas, and their virtual universality of automobile ownership, as well as the paucity of transit ridership in most metropolitan areas would set the US to to the nether world of worst traffic congestion. This is not so, and not by a long shot.
1. New Zealand: The trophy goes to, of all places, New Zealand (Figure 1). The average excess time spent in traffic in the three urban areas of New Zealand rated by Tom Tom was 31.3%. This means that the average trip that would take 30 minutes without congestion would take, on average, approximately 40 minutes in the three urban areas of New Zealand. This is stunning. New Zealand’s urban areas are very small. The largest, Auckland, has a population of approximately 1.3 million, which would rank it no higher than 25th in Western Europe, 35th in the United States and 4th in Canada and Australia. Christchurch and Wellington are among the smallest urban areas (less than 500,000 population) covered in the Tom Tom Traffic Index, but manage to rank among the 20 most congested (Figure 2). Christchurch has no freeways and Wellington’s are not long.
2. Australia: Second place is claimed by Australia. The average trip takes 27.5 percent longer in Australia because of traffic congestion. All five of Australia’s metropolitan areas with more than 1,000,000 population are among the 20 most congested urban areas in the higher income world. In the case of four urban areas (Sydney, Brisbane, Perth and Adelaide), every larger US urban area has less traffic congestion. Melbourne is the exception, but is still “punching well above its weight,” with worse traffic congestion than larger Chicago, Dallas-Fort Worth, Houston, Toronto, Philadelphia, Miami, Atlanta, Washington, Riverside-San Bernardino and Boston.
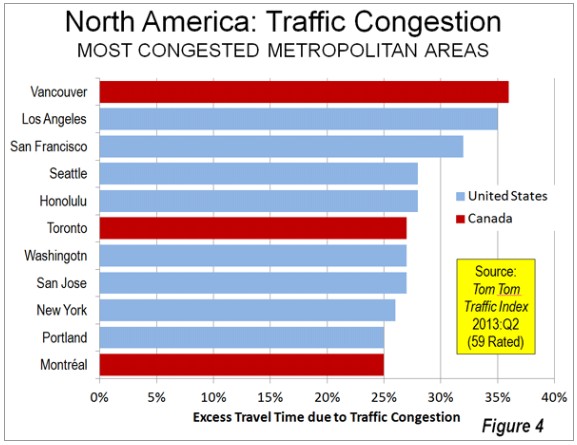
3. Canada: Canada is the third most congested, with an excess travel time of 24.8 percent. Vancouver ranks as the third most congested urban area (36 percent excess travel time) in the higher income world, and has displaced Los Angeles as suffering the worst traffic congestion in North America. This is a notable accomplishment, since Los Angeles has more than five times the population, is more dense and only one-third as many of its commuters use transit to get to work. None of the other five largest urban areas in Canada (Toronto, Montréal, Ottawa, Edmonton and Calgary) is rated among the 20 most congested in the higher income world (Figure 3). Toronto is tied for 6th worst in North America with Washington (DC-VA-MD) and San Jose (Figure 4).
4. Western Europe: Fourth position in the congestion sweepstakes is occupied by Western Europe, where the excess travel time averages 22.2 percent. Marseille (France) and Palermo (Italy) are tied with the worst traffic congestion in the higher income world, with excess travel times of 40 percent. Excluding Christchurch and Wellington, Marseille and Palermo are among the smallest urban areas among the most congested 20, though their large and dense historic cores complicate travel patterns. Rome, Paris, Stockholm and Rome, all with strong transit commute shares, are tied with Vancouver for the third worst traffic congestion (36 percent excess travel time). Other Western European entries to the most congested 20 rankings are London, Nice and Lyon in France and Stuttgart, Hamburg and Berlin in Germany. Western Europe contributes only 11 of its 54 rated urban areas to the most congested 20 list (the most 20 most congested list includes 24 urban areas because of a five way tie for 19th)…
5. United States: The United States is the least congested in these rankings with an excess travel time of 18.3 percent. Even after losing its top North American ranking to Vancouver, Los Angeles continues to be the most congested urban area in the United States, with an excess travel time of 35 percent. San Francisco (32 percent), Seattle, and much smaller Honolulu (tied at 28 percent) are also in the most congested 20. Only four of the 53 rated US urban areas is in the most congested 20.
While the results might seem counter-intuitive, they are not. The fact remains that urban consolidation policies can slow travel times, since they 1) pack more people into a given area, increasing congestion in the process; and 2) tend to favour public transport over roads, despite most people preferring (and using) the latter option.
Leith van Onselen is Chief Economist at the MB Fund and MB Super. He is also a co-founder of MacroBusiness.
Leith has previously worked at the Australian Treasury, Victorian Treasury and Goldman Sachs.